Esri honored the organization and team that developed the world’s go-to dashboard and map for vital statistics and information about the coronavirus disease 2019 (COVID-19) pandemic with a prestigious award.
The Center for Systems Science and Engineering (CSSE) at Johns Hopkins University won the Making a Difference Award for its COVID-19 dashboard, created using ArcGIS Dashboards.
The award was presented by Esri President Jack Dangermond during the 2020 Esri User Conference.
Graduate student Ensheng Dong’s concern about the health of family and friends in his native China was the impetus for launching the online app. He worked with professor Lauren Gardner, codirector of CSSE, to develop the dashboard with technical assistance from the Johns Hopkins Applied Physics Laboratory and Esri.

Their first dashboard, showing the location of COVID-19 cases in China and several other countries in Asia, went live on January 22, 2020, with Gardner sending out Tweets with the news of the launch.
Since then, the dashboard—with its maps and data on cases and deaths worldwide, along with graphs and charts showing disease trends—has been viewed billions of times.
Esri president Jack Dangermond calls what Gardner’s team did with ArcGIS Dashboards “amazing work.”
“[They] collected data from many sources, brought it together, did all of the manipulation to get it correct, and then published it,” Dangermond said. “This organization made over a trillion maps in the last few months, and billions of people saw them. The map was interesting, but more importantly, it woke up the world to seeing [the spread of the disease] in context.”

Dong, who now manages the dashboard project, was excited about receiving the award.
“I’m honored to receive this Making a Difference Award from Esri with our amazing team!” Dong said in an online interview. “Let’s keep up the good work and make the world a better place!”
You can listen to an Esri & the Science of Where podcast interview with Gardner. In it, she discusses what motivated the team to create the COVID-19 dashboard and how it became an authoritative source on the spread of the disease. The dashboard has been used to inform policy makers, major media sources, and the public.
At this year’s Esri UC, Dangermond also presented the Enterprise GIS Award to two organizations. One recipient was the staff at the Louisiana Department of Transportation & Development. “They implemented a complete enterprise GIS in their highway department,” he said, adding that every fieldworker in the organization is now outfitted with GIS technology. The project was headed by Brad D. Doucet, director of the department’s Enterprise Support Services.

The second Enterprise GIS Award recipient was Enel Green Power North America (EGP), which has wind, hydroelectric, solar, and geothermal energy plants in the United States, Canada, and Mexico.
“This is likewise a company that has implemented GIS across [its] entire organization,” Dangermond said. “It was selected not only for some of [its] creative [enterprise GIS] work but also because it’s doing pioneering work in renewables.”

Dangermond praised Keith Aubin, chapter leader, Geographical Information Platform, at EGP, and his team for their work on the enterprise GIS project and in renewables.
“They are tapping into this vision of making our world green power generated,” Dangermond said.
The President’s Award, which Dangermond alone selects, went to the Regional Municipality of York in Ontario, Canada.
“We are giving [the Regional Municipality of York] this award because this organization built one of the first pioneering shared infrastructure systems for GIS,” said Dangermond. “It is geospatial infrastructure at its best.”
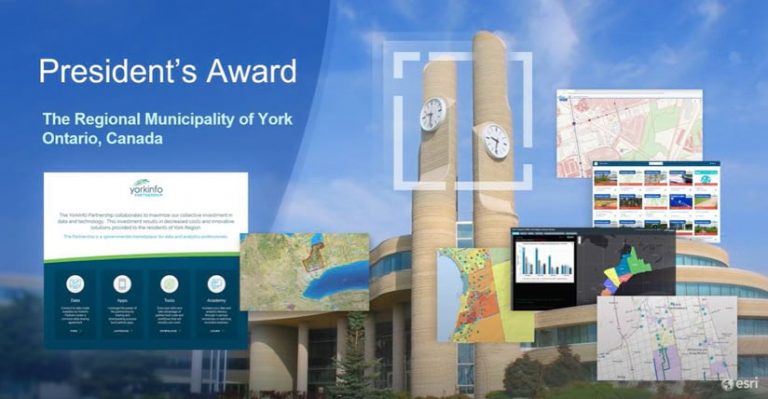
According to a press release issued by Esri Canada, York Region used Esri technology to create a data cooperative project that involves access to and the sharing of code, data, technology, and training among the local municipalities’ GIS users.
John Houweling, director of Data, Analytics & Visualization Services for York Region, acknowledged the award via video shown at the conference. “Thank you, Jack. What a wonderful acknowledgement of our incredibly talented team. Working together with our partners, we are connecting our world here in York Region,” he said. “We are doing this through a culture of collaboration that encourages sharing, breaks down silos, and puts our collective data to work.”
More than 175 organizations around the world won the Special Achievement in GIS (SAG) Award, including the United Nations World Food Programme; St. George’s University in Grenada; the United States Department of State; the State of Delaware; the City of Thornton, Colorado; Tampa International Airport in Florida; and the South Coast Air Quality Management District (SCAQMD) in California.
View the list of all the award winners, including the Map Gallery and Young Scholars honorees.