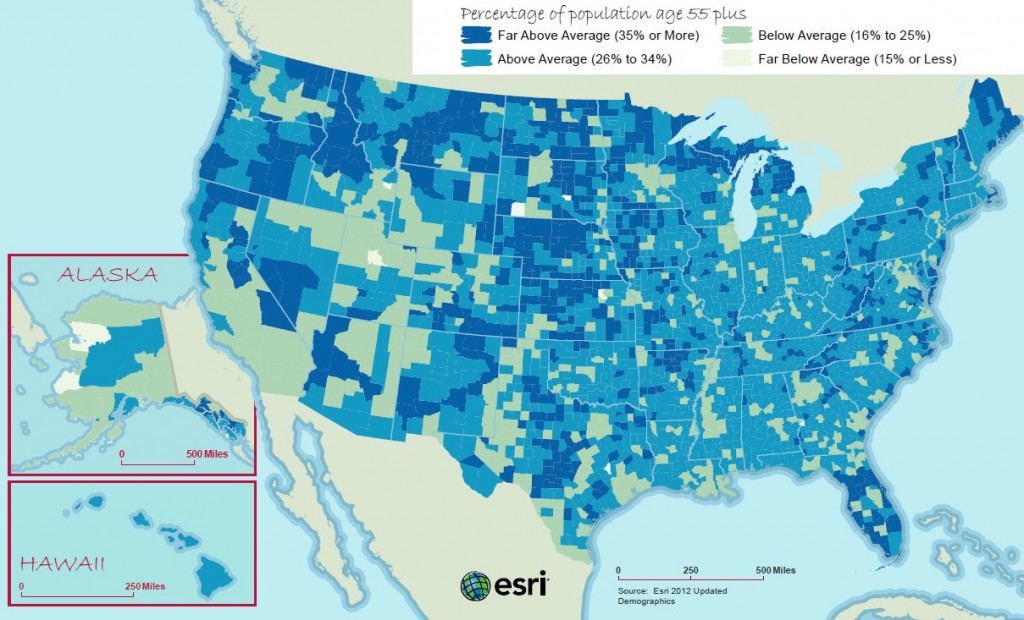
Like it or not, we are all aging. In 2000, the median age in the United States was 35.3 years. By 2010, this number had increased to 37.0 years; today, the median age is 37.3 years. By 2030, seniors will comprise 20 percent of the total US population. In addition to people living longer, the jump in the US median age is also due to aging Baby Boomers.
Seniors are not one monolithic demographic cohort. From those aged 55 to those in their 80s and older, seniors have vastly different lifestyles, preferences, and spending habits. These differences become even more apparent when classified by demographics such as affluence, education, employment, and race/ethnicity. Data about product and media preferences, leisure activities, and shopping habits provides even more detail.
So how can you easily find this type of information about seniors? Through segmentation.

What is Segmentation?
Segmentation operates on the theory that people with similar tastes, lifestyles, and behaviors gravitate toward others with the same tastes—“like seeks like.” These behaviors can be measured, predicted, and targeted. Segmentation provides valuable insights into behavior, and can answer the who, what, where, and how questions about consumer segments.
- Are seniors retired, still working, affluent, lower income, married, or single? Segmentation helps you to understand who they are based on their demographic and socioeconomic composition.
- Segmentation helps identify seniors’ leisure activities, preferred types of media, and stores they patronize so you can learn what products and services they might buy based on their age, income, preferences, and lifestyle.
- Geography links demographics with neighborhood geographies such as ZIP codes, census tracts, block groups, or census blocks, allowing you to research other areas to find where more people with similar tastes and lifestyles are located.
- Seniors’ media preferences are as varied as their demographics and product choices. These differences provide many opportunities for how to reach the right segments with the right messages at the right time.
Identifying Types of Seniors
 Esri’s Tapestry Segmentation system divides US residential neighborhoods into 65 unique market segments based on socioeconomic characteristics such as age; income; education; product, service, and media preferences; leisure activities; and much more. Tapestry classifies seniors into nine distinct segments that range from affluent, active seniors to older, sedentary folks with limited resources.
As seniors’ lifestyles evolve, opportunities abound for organizations to succeed in this growing, discrete, and increasingly profitable market. The more you know about seniors in your area, the better you can identify them, reach them, and serve them.
To learn more, read the white paper “Is ‘Seniors’ One Demographic Group?” [PDF]
For more information about Tapestry Segmentation, visit www.esri.com/tapestry.