One of the most important aspects of data is understanding how it relates to itself or other data. However, the discovery of relationships in data becomes increasingly difficult if you do not have a way to visualize relational data. So, before you start doing this the old-school way with pins, strings, and a bulletin board, let’s look at the new-school way with link charts in ArcGIS AllSource.
A link chart visualizes relationships between entities in data and is a complementary view to the map. Link charts consist of two main components, nodes and links. Nodes represent entities that are people, places, and things, for example, a name, phone number, or an IP address. Links are the lines connecting nodes and are the visual representation of related/connected entities.
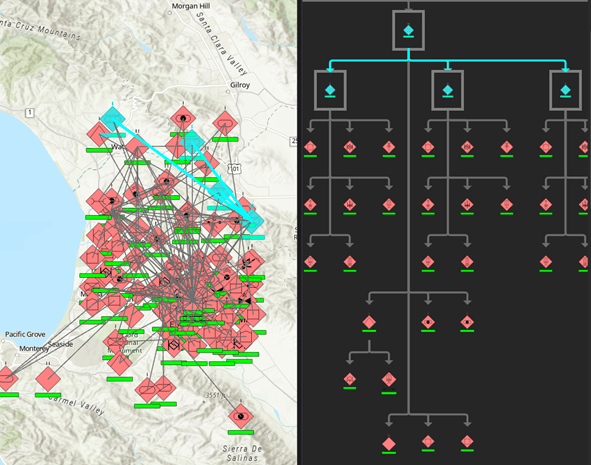
Link charts are created using attributes in your data depending on what you want to visualize and how your data is modeled, without requiring complicated schemas or predefined ontologies. The data you use to create a link chart can be contained within a single feature layer, multiple feature layers, or in a stand-alone table. In this part of the blog, you are going to learn how to create a link chart from a single feature layer however, the process is the same for stand-alone tables.
Build a link chart from a single feature layer
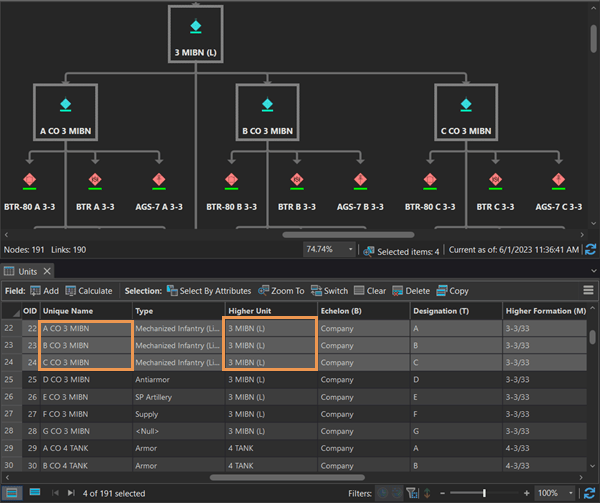
The link chart above shows a typical organizational chart for a fictional military organization. All the units are entities, and the links show the hierarchy of the organization which is the relationship between these units. You will create the same link chart using data from a single feature layer. However, before you begin, let’s examine the data to gain a better understanding of how it’s organized. The Units feature layer has each units’ name stored in the Unique_Name field. Notice that there are some duplicates in the Higher_Unit field because these higher units have more than one unit under their command.
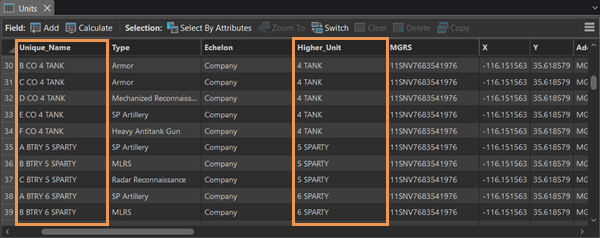
The first step to create a link chart is to create an empty link chart. To create an empty link chart in a project, complete the following steps:
- On the Analysis tab, in the Link Analysis group, click New Link Chart. The Link Chart view appears. Additionally, the chart is listed in the Contents pane.
- Optionally, rename the link chart on the Link Chart properties dialog box.
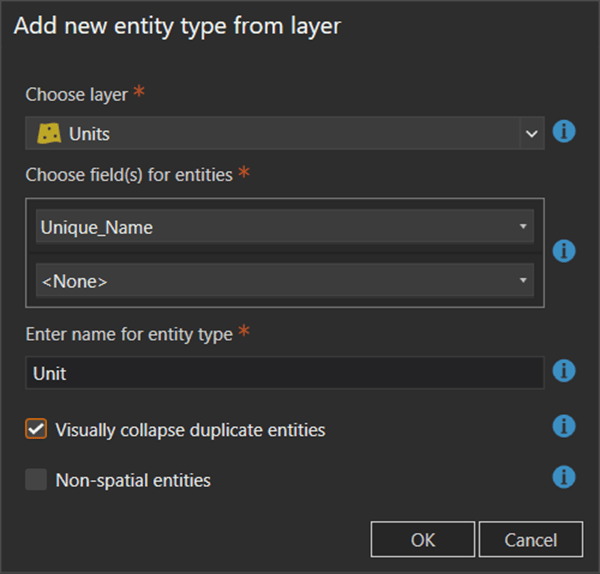
Next, you’ll create entity types from a field in your feature layer. To create an entity type, complete the following steps:
- On the Link Chart contextual tab, in the Add group, click Entity Type. The Add new entity type from layer dialog box appears.
- In the Choose Layer drop-down menu, choose the Units layer.
- In the Choose Field(s) for entities drop-down menu, choose Unique_Name. Choosing the Unique_Name field creates an entity for each unique value in this field.
- Check the Visually collapse duplicate entities box. This will collapse duplicate fields so that you don’t have multiple entities of the same unit showing up in the link chart.
Next, you will create the relationship type to define how the entities are connected in the link chart. To create a relationship type, complete the following steps:
- On the Link Chart contextual tab, in the Add group, click Relationship Type. The Add new relationship type between entities dialog box appears.
- In the Choose source entities drop-down menu, choose Unit.
- In the Choose target entities drop-down menu, choose Unit.
- In the Enter name for relationship type text box, name your relationship Unit to Higher Unit.
- In the Choose key type drop-down menu, choose Entities.
- In the Source entity key field drop-down menu, choose Unique_Name.
- In the Target key field drop-down menu, choose Higher_Unit.
- Click OK.
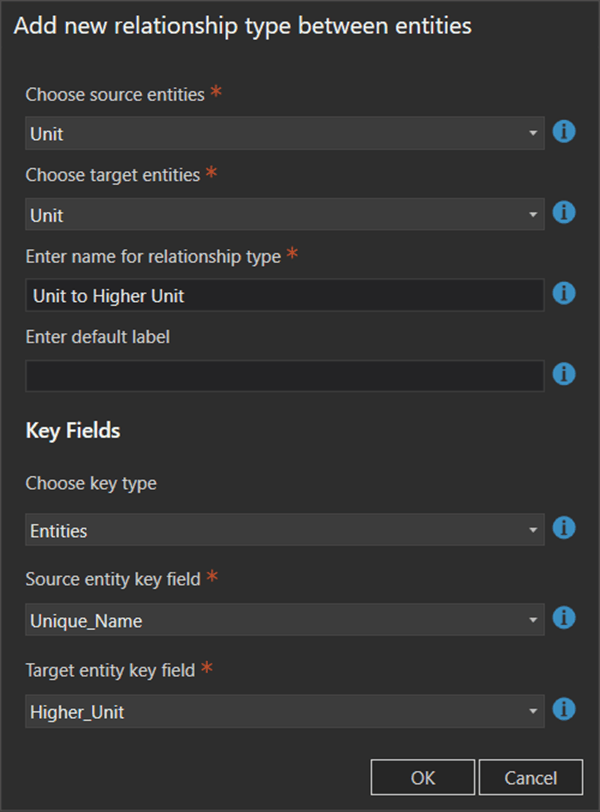
When you create a relationship using the key type Entities, you are using attributes from the source and target entity types to link the entities based on matching attribute values. In this example, you’ve created a relationship that shows the link between units and their commanding units.
Analyze the link chart
Link charts enable you to visualize relationships and add further context to your data and map. However, in addition to visualizing relationships in your data, link charts also have analysis tools to aid you in your work. In Part 2 of this blog, you will learn about the Centrality, Cluster, Neighborhood, and Path Link Analysis tools available in ArcGIS AllSource.
Tips and tricks
- Entity types can be created in any order.
- If your feature layers do not have fields that contain linking values between entity types, you can skip setting the key fields by setting the key type to None when you create the relationship type. After the relationship type is created, you can manually draw links between entities using the Add Link tool.
- If your feature layers have fields that contain linking values between entity types, but not all records have values, set the key type to Entities so that a link is created for the entities that do have linking values. For entities that don’t have a linking value you can manually draw links using the Add Link tool.
- The Change Layout drop-down menu consists of three layouts—Hierarchic, Clustered, and Organic—that rearrange entities and relationships according to the new layout. Some layout types display a given set of data better than others so you may need to try different layout types to see which works best for your data and use case.
Related resources
Visit the ArcGIS AllSource website.
To learn more, see the link chart help documentation.
Continue to Part 2 to learn about link analysis tools.
Card photo by Volodymyr Hryshchenko on Unsplash
Banner photo by Planet Volumes on Unsplash


Article Discussion: