ArcGIS 10 introduces a new set of reporting tools for the desktop. You will now be able to create, load, and run reports using the new Report Wizard, Report Viewer, and Report Designer. Using these tools, it is easy to create and design reports in ArcMap.
Accessing the Report Commands
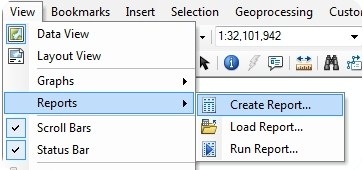
From the View menu in ArcMap, use the Reports pull-right menu to access the report commands. The
Create Report command launches the Report Wizard, which will walk you through creating a report. The Load Report command allows you to open a saved report in ArcMap or load a report layout file (.rlf) as a template in the Report Designer. The Run Report command allows you to regenerate a report based on an .rlf template.
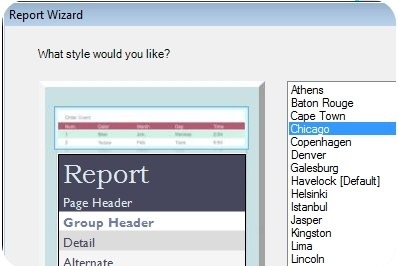
Using the Wizard to Create a Report
The Report Wizard includes options for setting up the design of your report. The only requirement for creating a report is to choose a set of fields to display in the report. However, the wizard allows you to configure many properties that are common with a well-designed report. These properties include grouping, summary statistics, field sorting, and orientation of the report. One of the new features in the wizard in ArcGIS 10 is the ability to choose from a list of preset styles for your report. If you want to create your own style, you can do that as well using the Style Manager in the Report Designer.
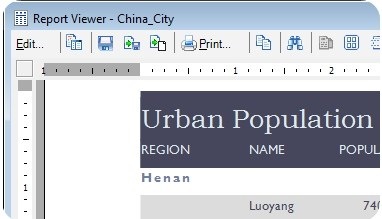
Using the Viewer to Preview a Report
The Report Viewer lets you preview your report. The preview allows you to see how report elements are spaced, aligned, and formatted. If you want to alter any of the report properties, you can click Edit on the viewer’s toolbar, which will open the Report Designer. The toolbar also includes commands that allow you to save, export, and add the report to the layout. Export formats include PDF, HTM, TIFF, XLS, TXT, and RTF.
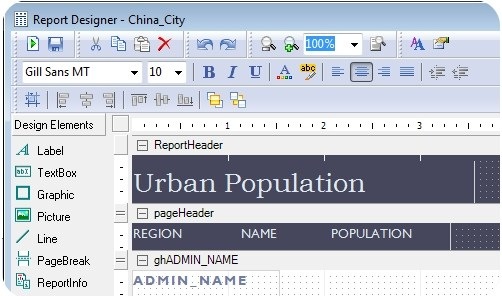
Using the Designer to Customize a Report
The Report Designer allows you to customize your report. Click elements in the report if you want to change their properties. The properties for any selected element are displayed in a properties grid to the right of the report view. To reposition elements on the report, simply click and drag them to the desired position. You can also resize an element by clicking it and using the handles (the little white squares) to adjust its height or width. Click Save on the main Report Designer toolbar to save a report layout file, which can be used as a template or to rerun a report.
Content Provided by Kent Marten
Commenting is not enabled for this article.