This year’s Esri Developer Summit was the biggest one yet. Crucial conference highlights include: the giant outdoor carnival full of games and food and fun, and the opportunity to talk with visitors to the GeoAnalytics showcase. Getting to hear your questions, comments and use cases is always exciting and inspiring. In case you weren’t there, our team has compiled the most frequently asked questions here in hopes of answering yours!
“What is ArcGIS GeoAnalytics Server?”
GeoAnalytics Server is a licensing role for one or more ArcGIS Server machines used for the analysis of large volumes of vector and tabular data. What’s unique about these analysis servers is that they can distribute processing across multiple machines and cores. This means that when your datasets become too large to be processed on a single machine or core, GeoAnalytics can step in to speed up that process. Jobs that may have taken months, weeks, or days can take hours or minutes with GeoAnalytics.
“I see that the ArcGIS Enterprise portal’s Map Viewer has both Standard Tools and GeoAnalytics Tools. What are the differences, and when would I use one or the other?”
Standard tools are available by default in ArcGIS Enterprise and perform feature analysis using your hosting server. These tools are useful when you are processing average-sized data. GeoAnalytics Tools, however, process data in parallel on your GeoAnalytics Server, and are specialized to process larger amounts of data more quickly. Both toolsets contain some similar tools, like Aggregate Points, Join Features, and Find Hot Spots, but GeoAnalytics’ extra edge is that it provides tools to track trends, patterns and anomalies in both space and time.
Learn more about standard analysis and GeoAnalytics Tools
“GeoAnalytics, GeoEvent, Insights, and analysis in ArcGIS Pro: How does it all work together?”
GeoAnalytics, GeoEvent Server, and Insights for ArcGIS complement each other, but also work well in isolation. GeoEvent is used to ingest real-time stream data from sources like sensors and GPS measurements. GeoEvent exposes ingested data as feature layers, which can optionally be explored further in Insights or processed using GeoAnalytics Tools. Insights provides a data workbench experience for your data, allowing you to explore, iterate on and share your findings via charts, graphs and maps. Insights can take advantage of different analysis engines, so while you are using your Insights workbook, your analysis may be powered by Insights, standard analysis tools, or even GeoAnalytics Tools, depending on the configuration of ArcGIS Enterprise.
“I have a huge dataset, and it’s not drawing quickly. I want to draw a zillion points, how do I do that?”
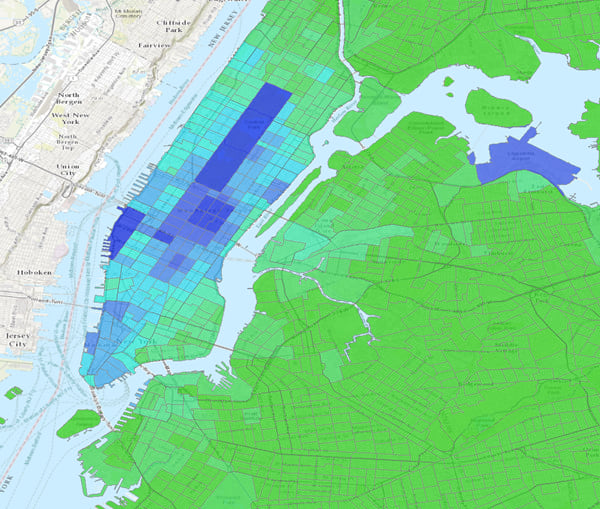
Well, you may not want to. Why? Because visualizing millions and trillions of features on their own isn’t informative. Instead, consider using GeoAnalytics to visualize big data patterns by aggregating and summarizing trends. This allows you to explore and find patterns that would otherwise go unseen amid your many features. For example, below are millions of…can you tell? Exactly — it’s hard to see anything with that many points. These are taxi pickup locations in New York City (Do not try this at home!)

However, when we aggregate our data into census tracks using Aggregate Points, we are able to derive valuable information, like the concentration of pick-ups around Central Park.

“Am I able to automate GeoAnalytics workflows? Does it work with the Jupyter Notebooks I’ve been hearing so much about?”
Yes, and yes! The ArcGIS Python API can be used to automate and execute workflows. For those of you who are fans of Jupyter Notebooks, GeoAnalytics Tools can be executed there, too! Additionally, GeoAnalytics Tools can be used with Model Builder in ArcGIS Pro and in ArcPy. If REST is your preferred tool execution method (props to you!) then you can run the tools through the REST API.
“That all sounds great. Now, how do I install it? Is GeoAnalytics an extension or a separate install?”
GeoAnalytics is a server role within ArcGIS Enterprise, not an extension. It builds off of the ArcGIS Enterprise base deployment. First, install ArcGIS Server and license it for GeoAnalytics, then federate your GeoAnalytics site with your Enterprise portal. You’ll need to also install and configure the ArcGIS Data Store (spatiotemporal big data), used as an output for your results. Once your environment is all set up, you can start crunching some data!
Hopefully this was useful in answering your questions. Which features are you excited about? Are you currently using GeoAnalytics? Let us know at GeoAnalytics-PEs@esri.com!

Commenting is not enabled for this article.