ArcGIS Hub gets a lot of love, and rightfully so. It’s a tool that makes it easy to show the extent of an issue or progress made towards a goal. It also makes accessing the raw data behind these visualizations simple which increases transparency and builds trust with your community. The challenge then for most people is in getting (and keeping) high quality, actionable, and relevant data into your ArcGIS Hub site.
As we talked about in Part 1 of this blog series, there are a variety of ways that you can get data into Hub. The tool you choose largely depends upon two things: how often your data updates and your technical skill level. If your data never changes (imagine a dataset that has only building permits from 2018), then it’s likely that you don’t need a formal extract, transfer, and load (ETL) process. On the other hand, if your dataset is continually updating on some regular schedule (imagine a table of E911 calls) then it’s much more likely that you will need an ETL process to keep your data in Hub fresh.
Of the five most common tools that were outlined previously, the one I tend to rely on the most is Data Interoperability (also known as FME Desktop). It offers several key benefits that push it to the top of my list which may or may not apply to you:
- No coding required: I don’t know python well enough to code a complex ETL process on my own
- Routine can be scheduled: I regularly need an ETL process that can be executed on a schedule with no human intervention
- Easy to maintain: Once an ETL process is built, it’s easy for me to share it with someone else on the team (even if they have less technical skills) and for them to maintain it
- Clear process: Adding comments or annotations directly in my ETL process is essential so that I can remember what’s happening in each step and communicate that to anyone in the team that ends up maintaining the process.
The Data Interoperability (DI) extension for ArcGIS Pro (again, also called FME Desktop) has a very intuitive interface. If you’ve ever seen a flow chart diagram where there’s a start, some stuff in the middle, and an end result, then you already have a basic understanding of how DI works. For clarity, here are the key terms you’ll need to know:
- Reader: A reader is the first block in your process where the software connects to a data source. This can be something as simple as a flat csv file or as complex as data stored in a NoSQL Amazon DynamoDB table. You can connect to more than one data source in a single process (as is the case when you need to join two different datasets together) but you’ll always need at least one reader.
- Writer: A writer is the last block in your process where the software saves or writes the result out. Since we are focused on getting data into ArcGIS Hub, the data you have processed would be written either to a feature service in ArcGIS Enterprise or ArcGIS Online for it to be accessible in your Hub site. As with a reader, you can have multiple writers in a single process. For example, you could write the result of your process out to a hosted feature layer and a csv. Either way, you’ll always have at least one writer.
- Transformer: A transformer is the step in between reading and writing data. You can have no transformers (which is rare), one transformer, or many transformers in your process. It all depends on how much you need to clean, adjust, or enrich your data before you write it to its destination. Most commonly, transformers are used to rename or reorder fields, alter values in rows (like changing coded values to actual words), perform enrichment of data (e.g., adding a city council district number to a point when it falls within the council district polygon), and more.
- Workbench: The workbench is the “canvas” that holds all the readers, writers, and transformers in your process. Within your workbench you can add annotations to help future you (or your coworkers) understand the flow of data through the process. The workbench is also a file that you can execute on a routine basis using something like Windows Task Scheduler.
- Features: The term “features” can be used interchangeably with “records.” GIS professionals typically refer to records in a table as features (since “features” are what we call the points, lines, and/or polygons in a map) and Data Interoperability/FME Desktop follows this nomenclature. If you’re coming to this technology from an IT background, just know that the two terms mean the same thing.
Scenario
To help illustrate the usefulness of Data Interoperability, here’s a hypothetical scenario: Imagine you work for a city that wants to share building permit information. The source system overwrites a csv file each night with all the new building permits that were processed that day. Your task is to create an automated process that takes this new file and adds the records within it to a hosted feature layer in your city’s ArcGIS Hub site. The overall process will look like this:
- Examine the Data
- Build the workbench to create the hosted feature layer for the first time: Read, Transform, and then Write the Data
- Confirm that the data written is correct and fill out remaining item information
- Alter the workbench so that it appends future records to the (now) existing hosted feature layer: Update the reader csv source to a new csv file and then update the writer settings to append to the existing hosted feature layer
Step 1: Examine the data
The first, and most important step to any ETL process is to examine the dataset. This can take many forms but often it’s easiest to look at a csv file in a spreadsheet program like Microsoft Excel. Look for the values present in the columns. Common things to ask are:
Standardization: Are the values consistent in the fields? This applies most to fields that have
-
-
- Coded value domains: Do all the rows in the table have a value in the list of potential values? Are there some rows with old values or does the source system allow users to override the domain and enter a free text value?
- False duplicate values: Are there values that a human would see as duplicates but that a program would see as different values? Example of this could be: “City of Happyville”, “CITY OF HAPPYVILLE”, “City of Happyville Government”
-
Null or blank values: Are there null values where you expect to see information? Similarly, are there blank values where there should really be a null? A blank field could mean missing data whereas a null value typically means no data. Having this consistently in your dataset is important as it impacts the usability of data by users as well as in charts and maps.
Dates and times: Are date fields using a consistent format? Are the values in a particular time zone? Do time fields contain offsets for daylight savings time? Do time fields use a 12- or 24-hour clock?
Special characters: Are there values that contain commas, dashes, ampersands or other characters that could complicate the reading/writing of data into certain formats? For example, if there are commas in a field, this could create issues when trying to work with the data in a csv (comma-separated value file).
Location: Do the records in the table have location information? Is it in a consistent format like an address or is there a mix of addresses, street intersections, and parcel numbers?
Links to other datasets: Is there a foreign key present in the data that can be used to associate it to another dataset (as in a parcel APN number for each associated building permit)?
Personally identifiable or restricted data: Perhaps most importantly, does the table contain any information that is restricted by laws or policies? Does the data expose personally identifiable information (like names, addresses, social security numbers, or victim information) that needs to be removed or obfuscated prior to publishing?
Examining your dataset before you begin building an ETL process is extremely important and will guide the transformers you will need to use in the following steps.
Step 2: Build the workbench to create the hosted feature layer for the first time
After you have examined the raw dataset and understand its nuances and challenges, we can begin building the workbench in Data Interoperability. We are assuming in this step that we are creating a hosted feature layer (which will be hosted in your organization’s ArcGIS Online account). The same process can be used if you are relying on services hosted in ArcGIS Enterprise in your infrastructure.
Step 2a: Read the Data
Since our data is accessible through a csv that is updated nightly, our reader will connect to the csv itself. The first step here is to open Data Interoperability and open the “Reader” tool.
From within the Reader prompt, we can search for whatever format we need to read (in this case we’re looking for csv) and then start filling in other information like file location.
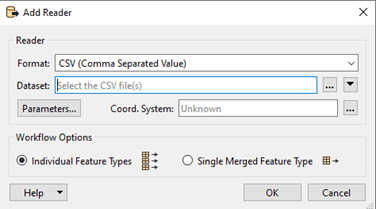
Once we save the configuration Data Interoperability will attempt to read in the data from the csv. It’s best to have the “enable feature caching” option turned on when building a workbench for the first time. This option is found in the dropdown next to the Run button. The interface will show us a cached version of the data from the csv that we can use to visually inspect the data.
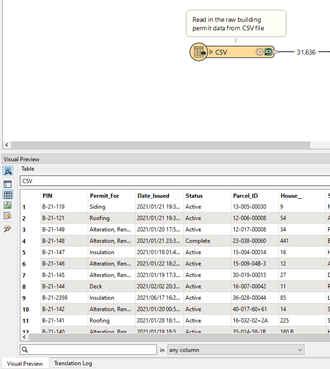
It’s important to note that Data Interoperability can also connect directly to a variety of databases (the “system of record”) but that process requires a read-only login to the database and understanding the table structure of the database both of which are beyond the scope of this introductory blog.
Step 2b: Transform the Data
There are a variety of transformers available in Data Interoperability and even more in the community that you can utilize. The most common ones that I use and, coincidentally, what we’ll use in this example are:
AttributeManager: This transformer is my go-to, multi-tool that can change field names, adjust values, and much more. We’ll use it to change the field names and remove the underscores in the data (because I can’t stand underscores in data… I don’t know why)
DateTimeConverter: Have weird datetime values (or even text strings) in your data that you need to standardize? We do in this dataset so we’ll convert the data in the “date issued” field into a format that works with ArcGIS Online.
CenterPointReplacer: If you need to create a point feature from a polygon (centroid), this transformer will do it with ease. We’ll use the CenterPointReplacer to convert a spatial parcel layer (which is polygons) into single points. As an aside, the VertexCreator is a better choice if you have a coordinate pair and need to create a point.
FeatureMerger: If you need to perform a join of one dataset to another using a key, this is the tool to use. You can do inner, outer, left and right joins with this transformer. We’ll use it to join the building permit data to a spatial parcel dataset which will:
-
-
- Add value to the building permit data: Users like the flexibility of data that has a spatial component in ArcGIS Hub. Plus, it’s cool to see building permits on a map over time.
- Increase the spatial accuracy of the building permit data: Using existing spatial data to geocode the building permit data is a more accurate process than street-based geocoding.
- Reduce the amount of geocoding we must do: Geocoders are great but can sometimes be less accurate than other methods of spatializing data. Also, they use credits to run (unless you’re using your own custom geocoder) which can add up over time.
-
ArcGISOnlineBatchGeocoder: Sometimes you just need to sling a bunch of records against a geocoder and see what sticks… this is the transformer for doing just that. In our case, we’ll use it to make any of the remaining building permits that didn’t match with a parcel have a point.
Once all the transformers in the workbench are wired together, it will appear like this:
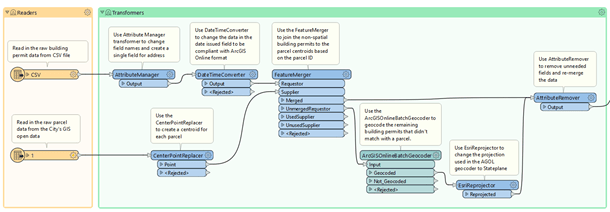
There are a few important things to note about our workbench as it currently exists:
- The diagram is designed to be read from left to right and top to bottom. You can rearrange this to suit your needs but I’ve found it’s easiest to arrange the flow as long and linear with lots of annotation.
- There is an additional reader branch at the bottom of the diagram (bottom left). This is to read in parcel data that is converted into points and joined with the building permits (based on the parcel ID) to make them spatial without needing to geocode all 40,000+ records.
- There is an additional transformer that we haven’t talked about yet: When records are geocoded against the ArcGIS Online geocoder, they are projected in what’s called the “World Geodetic System” (translation: latitude and longitude). Local governments in the United States typically use the State Plan Coordinate System (translation: northing and easting). Basically, we need to convert the geocoder’s results from one type of coordinates to another so that all our spatial data lines up correctly.
- There is no writer in this diagram yet as we’ll add it in the next step.
Step 2c: Write the Data
Now that we’ve successfully read and transformed the data, we need to write it to our ArcGIS Online account. Since this data doesn’t exist as a hosted feature service, this first writer process will create the layer and load the records. Later, we’ll go into ArcGIS Online and update the item’s details including a thumbnail, summary, description, tags, and more so that users will understand what to expect in the dataset when they find it in your ArcGIS Hub site.
To start this process, we launch the “Writer” dialog and then search for “Esri ArcGIS Online (AGOL) Feature Service” as our output format. We’ll also configure the output hosted feature service name, ArcGIS Online account to use, target projection, and more. Inputs with a red exclamation mark (!) or that are highlighted in pink must be filled in and any other inputs are optional.
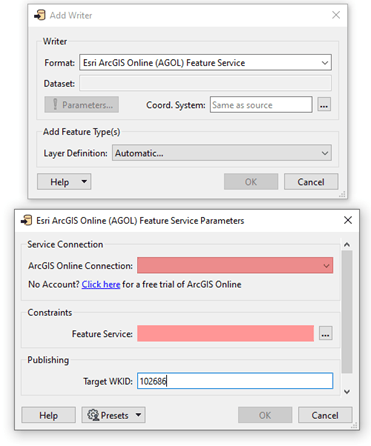
Once the configuration is done, we’ll run the entire workbench and publish the data to ArcGIS Online. The workbench now looks like this with all of the readers, transformers, and writer configured:

When we run the workbench, the translation log at the bottom of the screen will show messages that give us insight into what’s happening. Messages highlighted in red typically indicate failed processes and warrant a deeper look.
Step 3: Confirm that the data written is correct and fill out remaining item information
At this point, we need to login to our ArcGIS Online account and make sure that the data has been written correctly to the hosted feature layer. This means that we will look at the data in both a table and a map. We’re looking for general things like improperly written values, unexpectedly null or blank cells where data should be, and even data that appears way outside of the city limits (possibly indicating that either the projection settings were incorrect or poor geocoding results).
Additionally, we need to complete the dataset’s item page details. These details include:
- Title: Clear title of the dataset that non-experts will be able to understand
- Summary: A brief summary of the what the dataset is and where it comes from
- Description: A deeper summary of the dataset with more detail about the source, update cadence, and any other important characteristics of the dataset that we need users to know (without looking at the formal metadata)
- Thumbnail: A high quality, standardized thumbnail that visually communicates what the dataset covers and ideally includes branding information from our organization
- Terms of Use: Typically, this section includes a description of the data sharing policy (i.e., Creative Commons, custom license) that helps users understand what they can do with the data and what they shouldn’t do with the data
- Categories: Categories help group datasets together within your organization and ArcGIS Hub site in order to make searching and finding similar datasets easier for users
- Tags: Specific search terms that users might use to search and find this specific dataset
- Credits: The originator’s name(s) that users might have to add to the data if they use or republish it elsewhere
- Sharing: The groups and visibility level of this specific dataset that governs if the dataset appears in the ArcGIS Hub site and if it is visible to everyone (public), organization (semi-private), or just to the data owner/publisher (private)
Making sure that these components of the item page are filled out helps users of our ArcGIS Hub site understand the provenance of the data at a glance while also helping to power the search and filtering capabilities of the site.
Step 4: Alter the workbench so that it appends future records to the newly created layer
Now that we have a hosted feature layer that has all the “old” building permit records and contains the critical item page information, we can adjust our workbench to keep our data fresh. There are a few things we need to do to accomplish this.
Step 4a: Update reader csv source to new csv file
At the beginning of this process, we discovered that our source system that holds all building permit data can create a new csv file nightly that contains only the new building permits processed for that day. To adjust our existing workbench to take advantage of this, all we need to do is change the dataset source to the new file. This assumes that the schema of the file is the same as what we used previously and that the file name won’t change (source system will simply overwrite the same file).
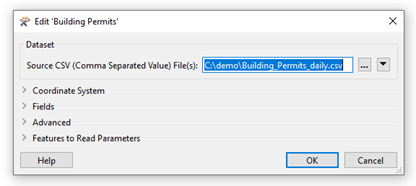
Step 4b: Update writer settings to append to existing hosted feature layer
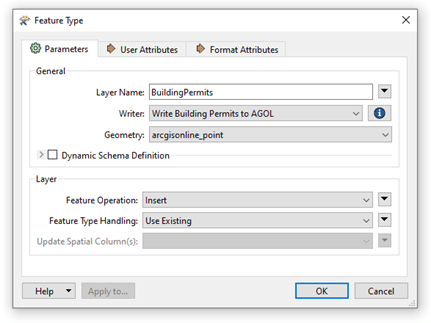
When we originally built the workbench, the writer was configured to “Insert” records and “Use Existing” as shown below. Frequently when I build a workbench, I’ll change the feature type handling to “Truncate Existing” since I’m testing the process and want the workbench to delete all the records from the hosted feature layer before writing new ones. Make sure that you switch these settings back so you append new data rather than wipe out all your old data.
Conclusion
Data Interoperability is a great tool to help you more easily migrate your data into your ArcGIS Hub site. It takes a little bit of time to learn the terms and to figure out how to build a process that works for your data, but the reward is well worth the effort. If your goal with ArcGIS Hub is to drive transparency or engage with your community, the best way to do it is to make fresh data available. Your users will thank you and, more importantly, they’ll trust the data and visualizations that you create.
If you’re interested in learning more about Data Interoperability and the many, many things it can do for you, check out the ArcGIS Data Interoperability blog.
Explore this Workbench
Click here to get a copy of the workbench used in this blog. When deploying this on your computer make sure you have a license (even if it’s a trial license) for ArcGIS Data Interoperability or FME Desktop.
Steps to deploy this workbench on your machine:
- Download the building permit data from the link below as a csv file and update the path to the csv in the Building Permits reader (top left of workbench).
- Configure your ArcGIS Online account credentials by going to Navigator > Web Connections > Esri ArcGIS Online.
- Change the name of the hosted feature layer in the Building Permits writer to something in your ArcGIS Online organization.
Acknowledgement
Special thanks to the City of Worcester, MA’s “Informing Worcester” open data site built on ArcGIS Hub and their building permits and parcel data used in this blog.
Hungry for more ArcGIS Hub content and learning?
- Attend webinars and meet-ups to discover how others are using ArcGIS Hub
- View ArcGIS Hub conference presentations, demos, and how-to videos
- Sign up for the ArcGIS Hub e-newsletter
- Follow us on Twitter @ArcGISHub


Article Discussion: