Introduction
The United States spans an entire continent and contains tens of thousands of distinct places, from small towns to major metropolitan areas. Each place has a combination of characteristics that makes it unique.
Some characteristics are about physical geography, like whether a place sits along the coast, beside a lake, in the mountains, or on a broad plain. Others are demographic, reflecting differences in age, income, or population density. There are infrastructure characteristics, like whether a place has a large multimodal transit system, while another has little public transit at all. And there are other characteristics that are harder to define but still shape what a place is like. Maybe it has a large college student population, or most people work in one industry.
The same characteristics that make places unique are also what connect them to other places across the country, and these connections can be useful across many different contexts. Someone looking for a new place to live or travel to might want to find somewhere similar to a city they already like. A planner might want to identify peer cities dealing with comparable environmental or housing conditions. A policymaker could look for communities facing similar circumstances to understand how they have approached a particular challenge. But comparing thousands of places across many different characteristics is data-intensive, and defining what makes two places similar can get complicated quickly.
Two places could be similar demographically but completely different geographically. They might have comparable housing stock but very different transportation systems. They might share a climate but have little else in common. Depending on the question we are asking, some of those similarities may matter more than others.
Instead of trying to reduce all that complexity to a single definition of similarity, we can take a different approach: represent these characteristics as a network of relationships that we can explore and query using ArcGIS Knowledge.
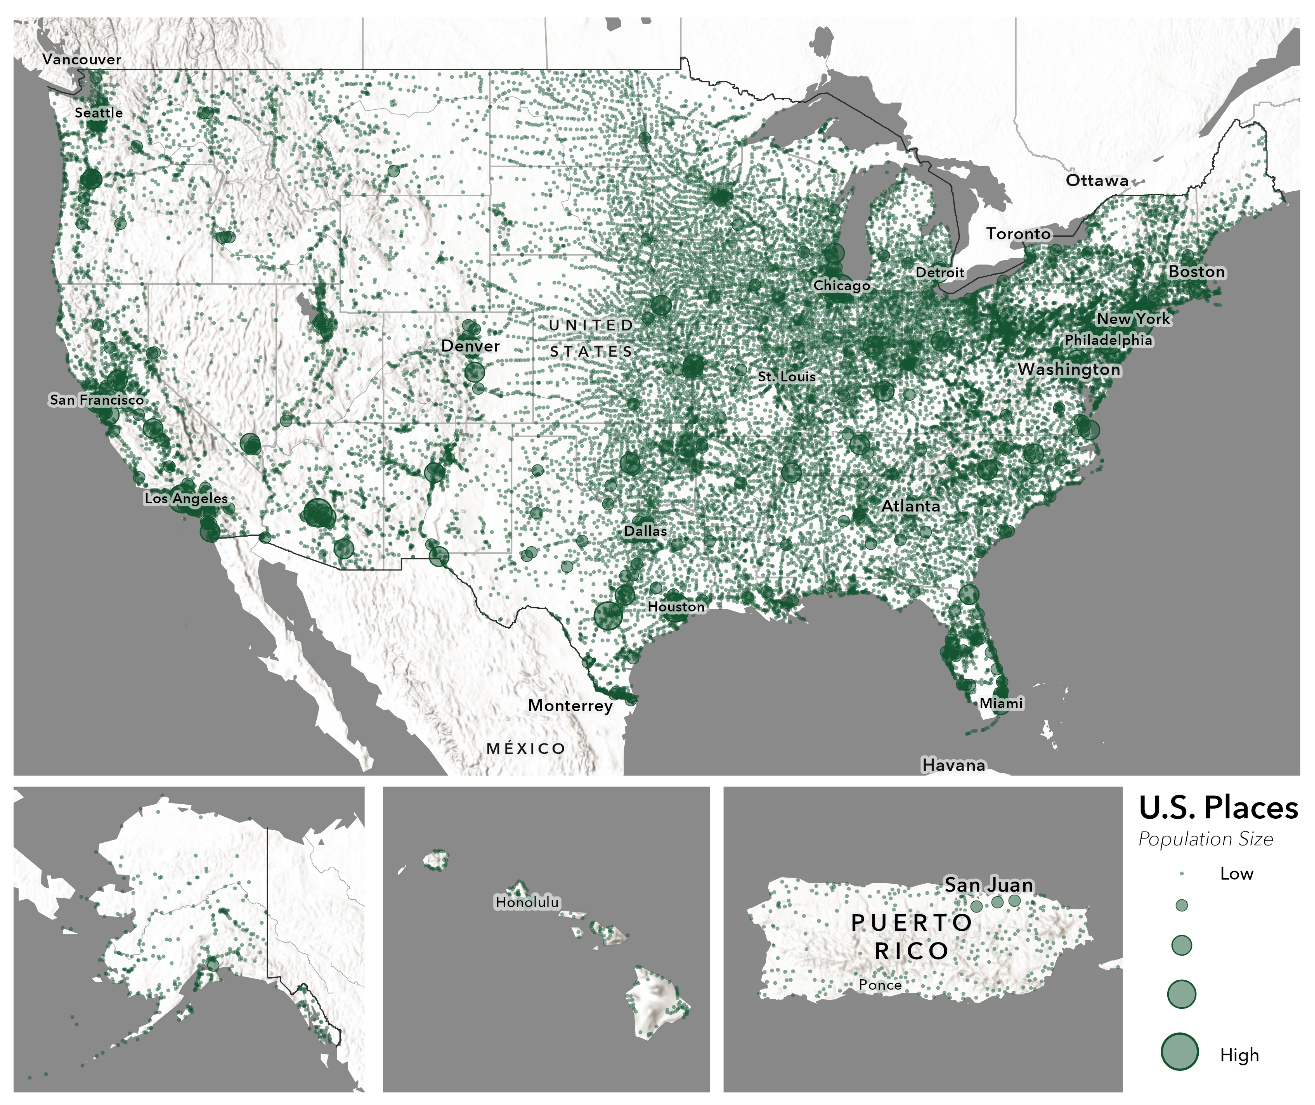
Connecting Places with ArcGIS Knowledge
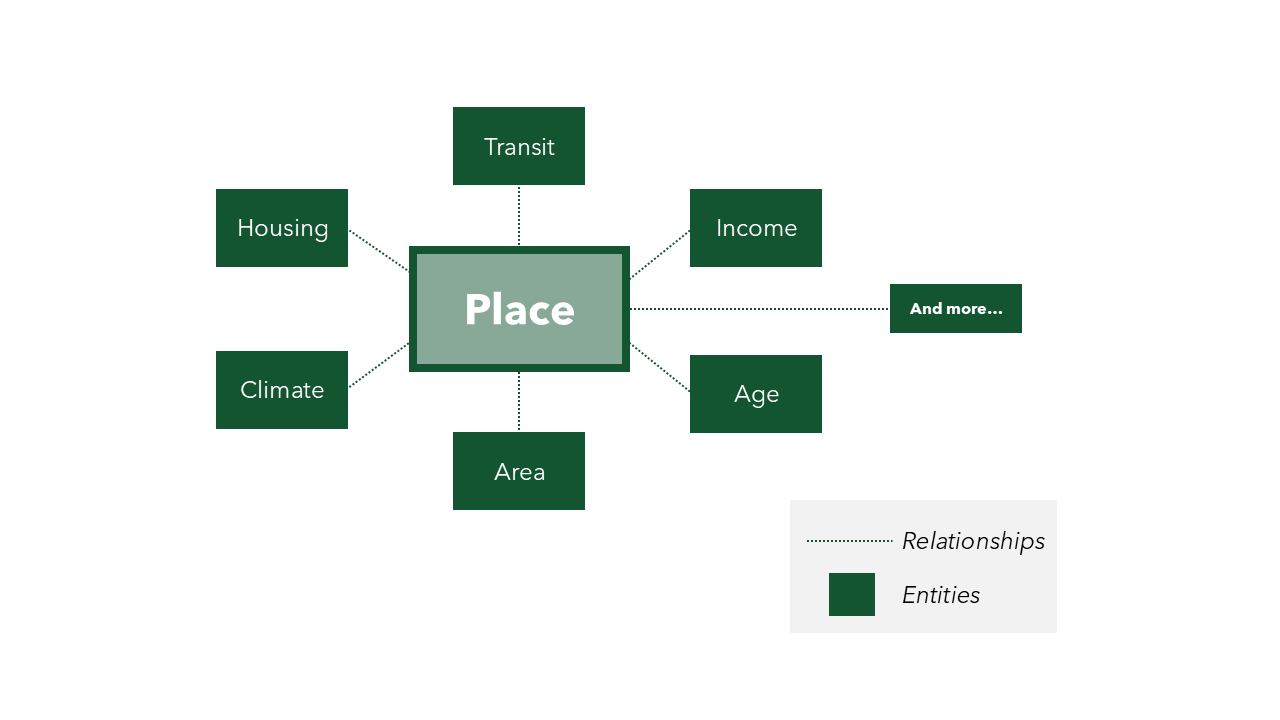
ArcGIS Knowledge allows us to represent information as a graph made up of entities and the relationships between them. For this prototype, the basic data model is relatively simple. Places are entities, their characteristics are entities, and relationships connect each place to the characteristics that describe it.
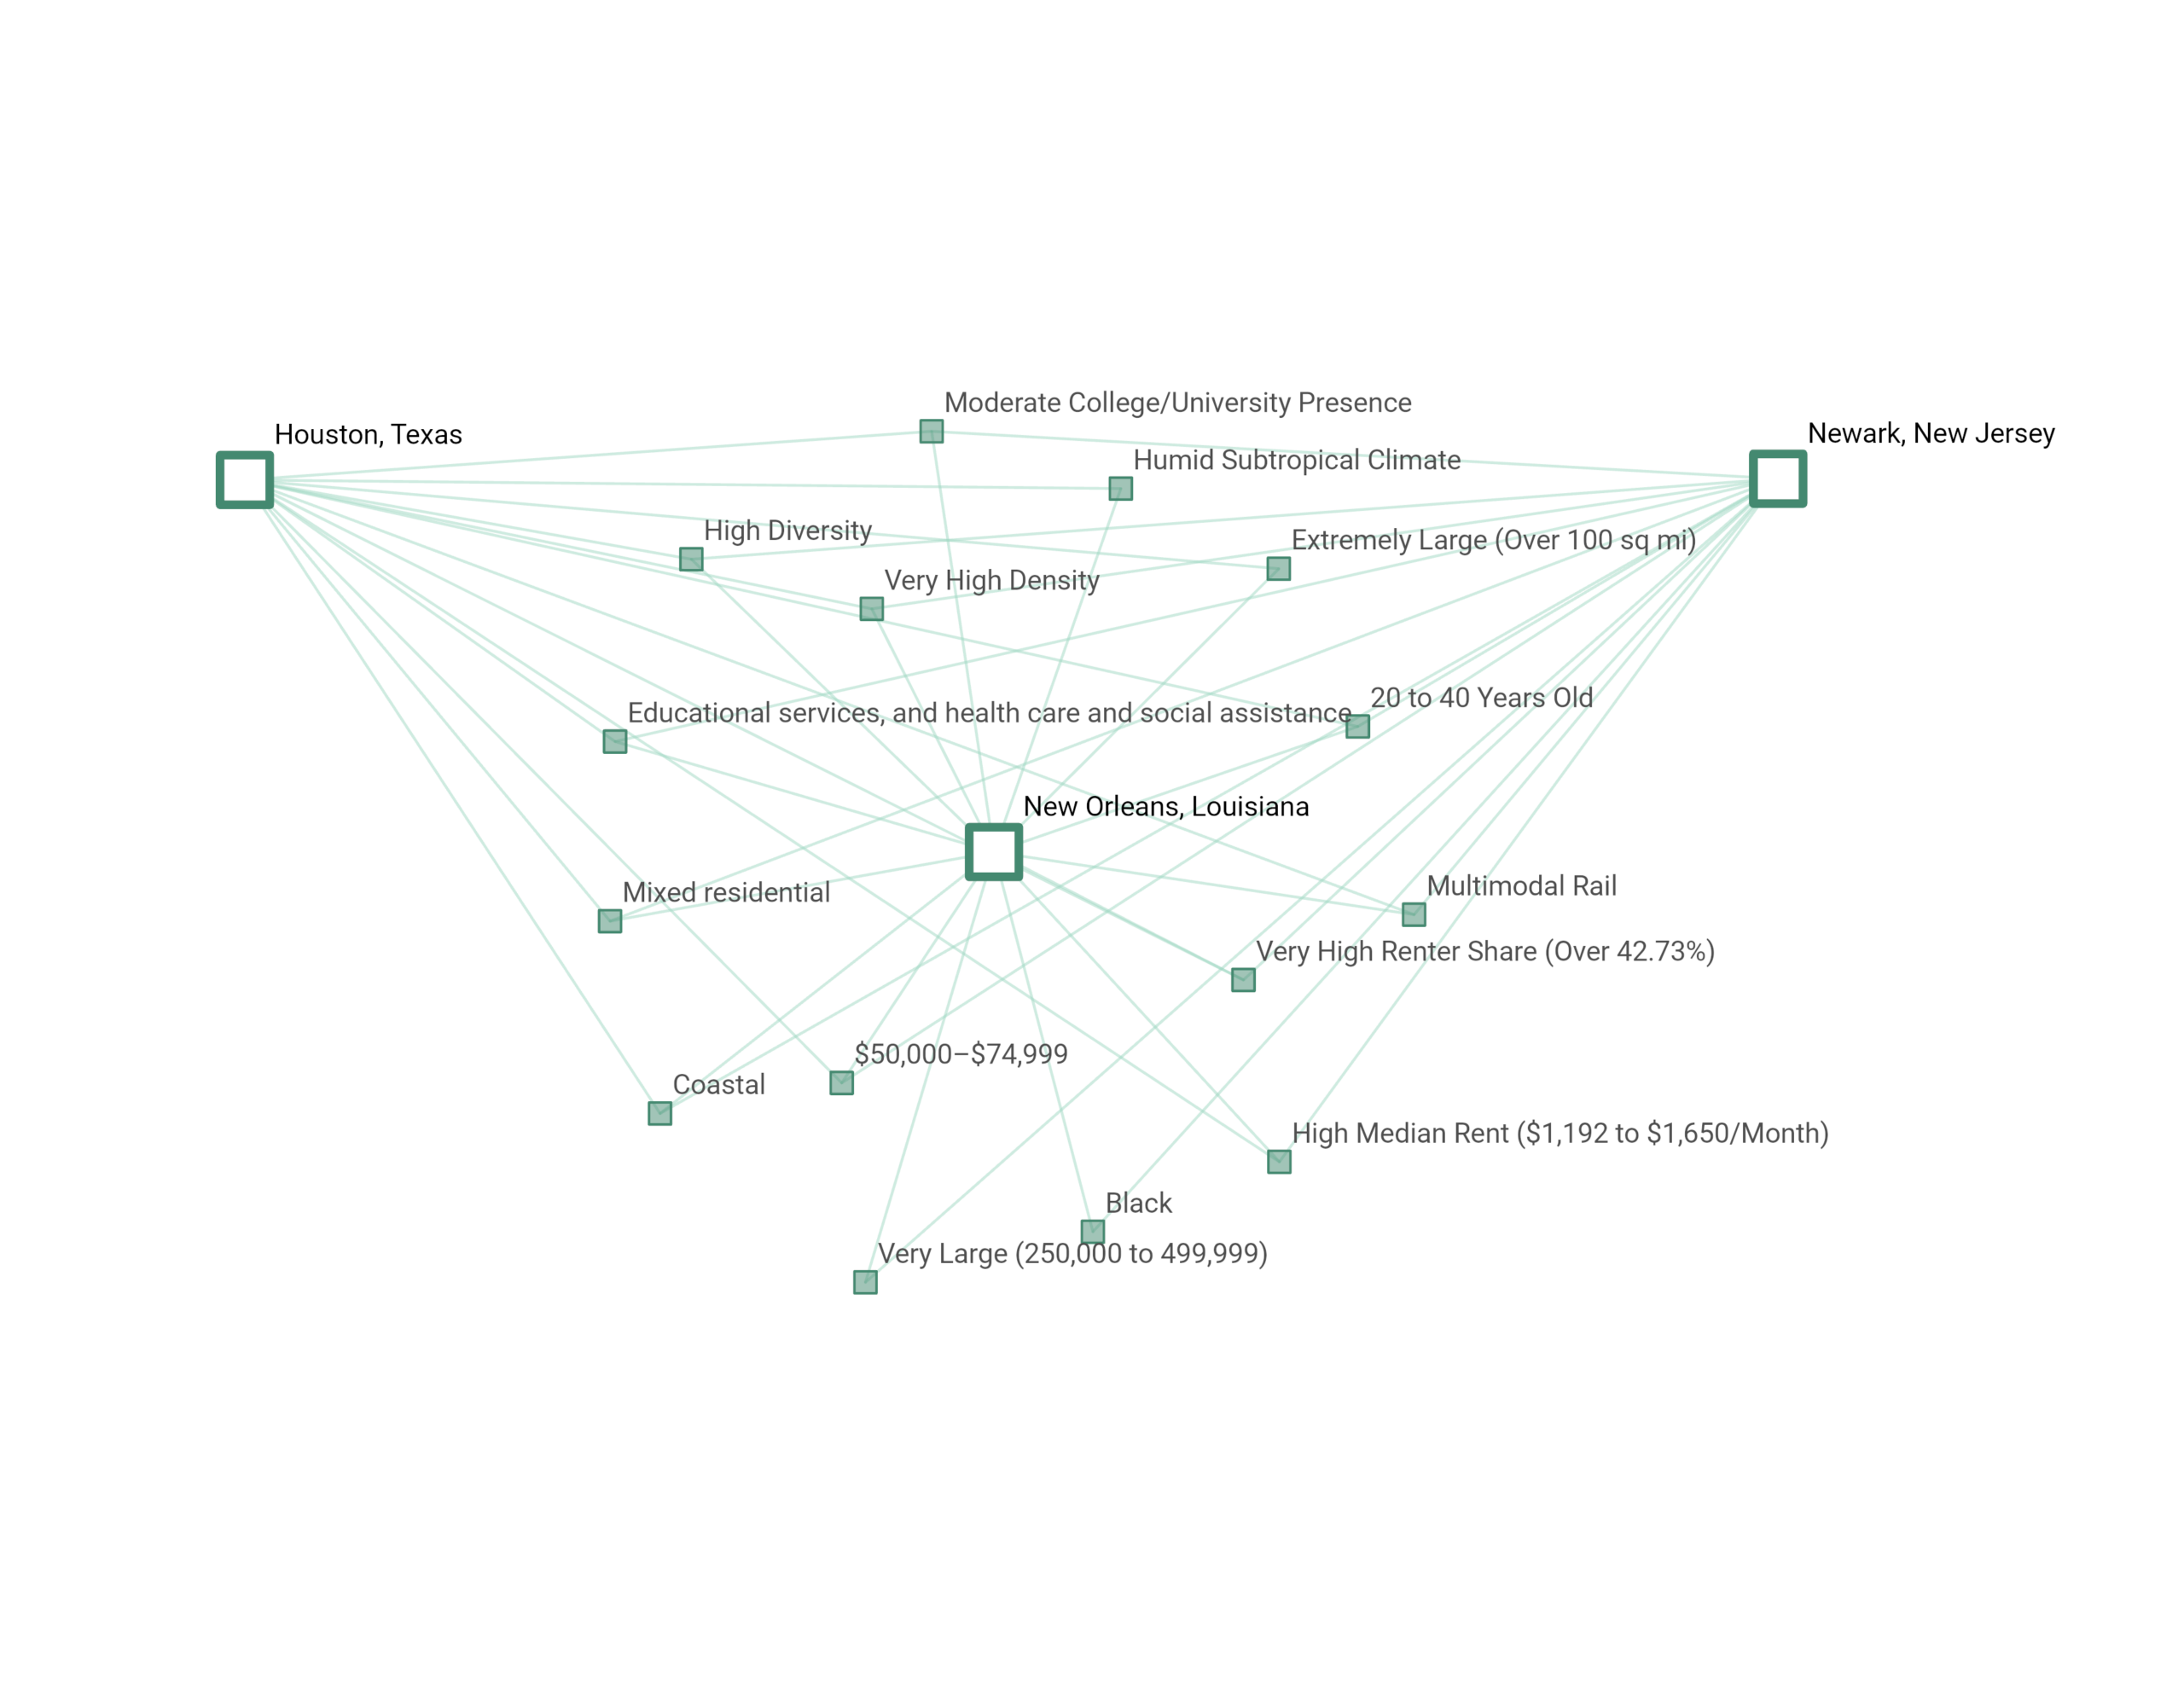
Using New Orleans, Louisiana, as an example, we can see how a place connects to different characteristics. New Orleans has a humid subtropical climate, mixed residential housing, a predominantly Black population, and a multimodal transit system. Those same characteristics can also connect New Orleans to other places across the country, like Newark, New Jersey, among others.
Instead of comparing places only as individual records in a table or points on a map, we can now compare them through the characteristics they share.
If another place is connected to many of the same characteristics as New Orleans, we have evidence that the two places have things in common. More importantly, the graph preserves what those commonalities are.
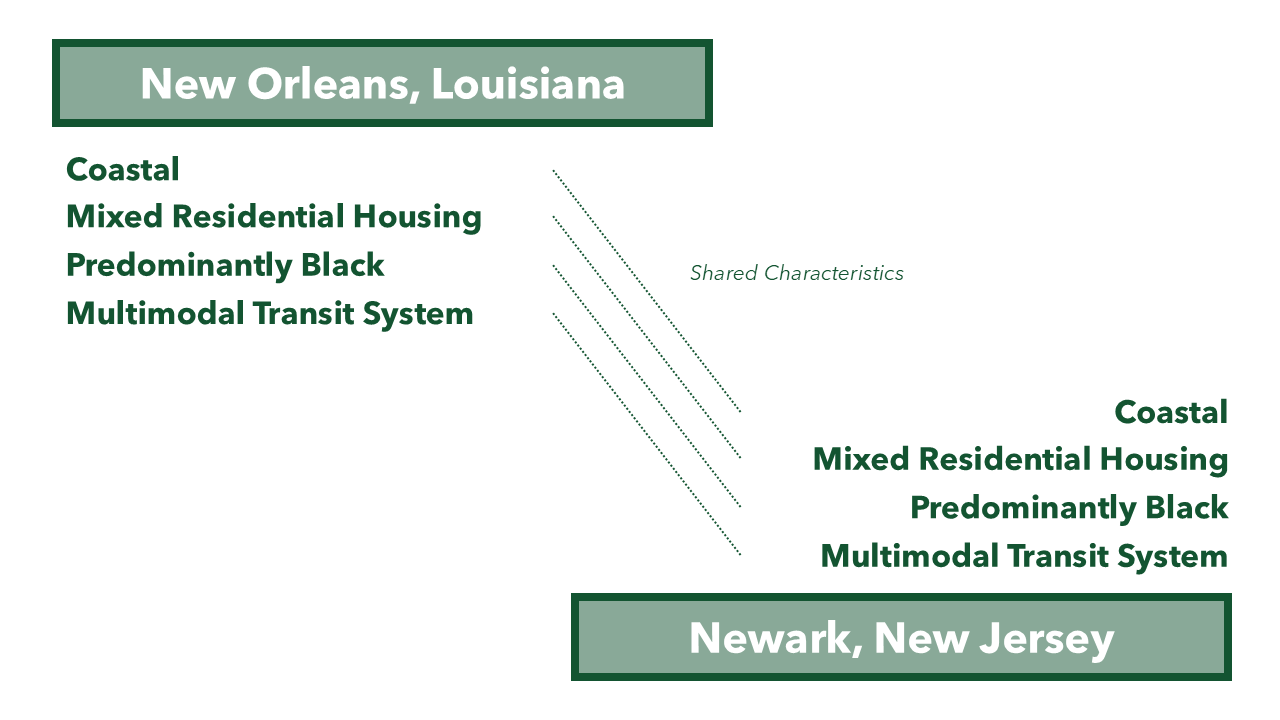
With a graph, the relationships behind that similarity remain visible. Maybe they share a similar climate and housing pattern. Maybe their demographic or transportation characteristics overlap. Similarity becomes something we can inspect rather than simply accept.
This also means that similarity does not have to mean the same thing every time. The characteristics that matter most can change depending on the context or on the question we are asking, while the underlying graph stays the same.
Building the Knowledge Graph
A major part of building this place similarity knowledge graph was deciding which characteristics meaningfully describe a place and preparing the data to represent them consistently.
For this prototype, we used the U.S. Census Bureau definition of a “place,” which includes incorporated places like cities and towns, as well as census-designated places (CDPs), or named communities that are not legally incorporated. We then selected 16 characteristics across four broad themes: physical geography, demographics, industry and culture, and housing and infrastructure.
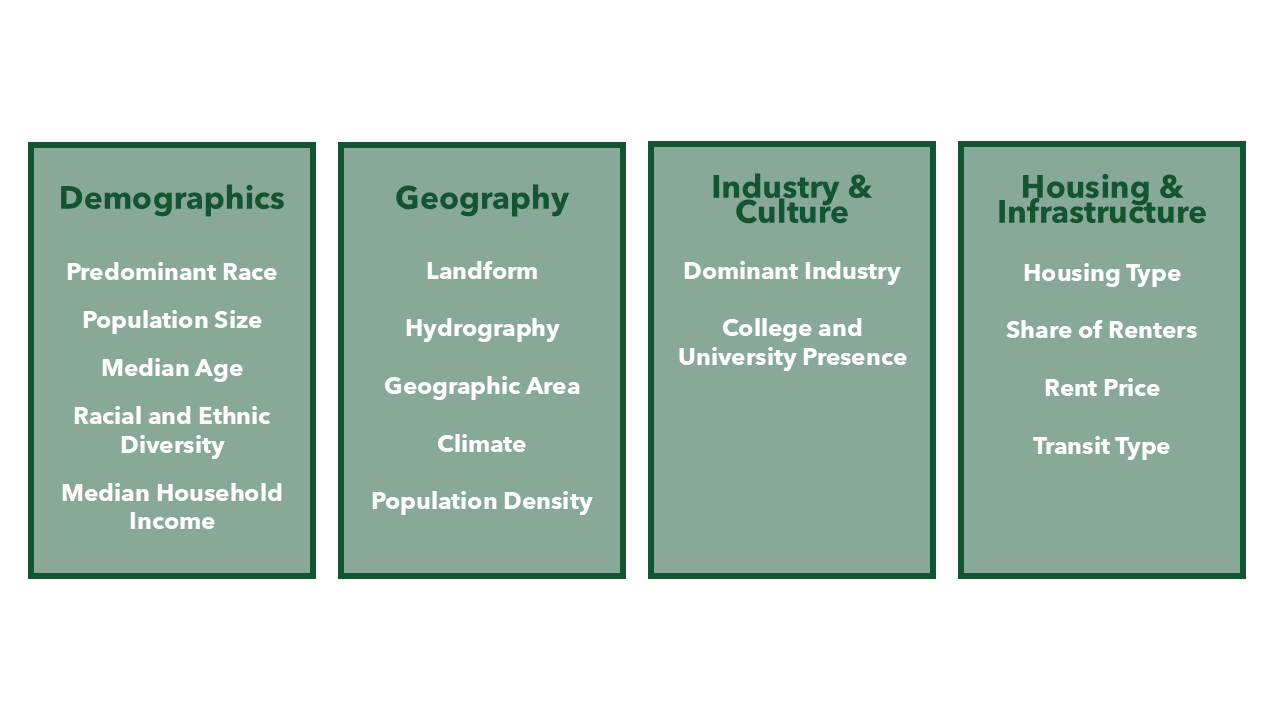
Most of the underlying data came from the U.S. Census Bureau’s American Community Survey, supplemented with other datasets where appropriate. Instead of loading raw numbers into the graph, we translated those values into categories that became the basis for connections.
For example, rather than storing the percentage of single-family detached homes as a numeric value, we used the data to classify places by their dominant housing type. That housing type becomes a category in the graph, connecting places with similar housing characteristics. We followed a similar process for each of the 16 characteristics, although the calculation depended on the underlying data.
Some characteristics also required geospatial analysis. Using ArcGIS Pro, we classified places based on where they are located or what surrounds them, such as their proximity to a coastline or the climate zone they fall within.
Because these classifications ultimately affect how places are connected and compared, we documented the source and calculation for each characteristic.
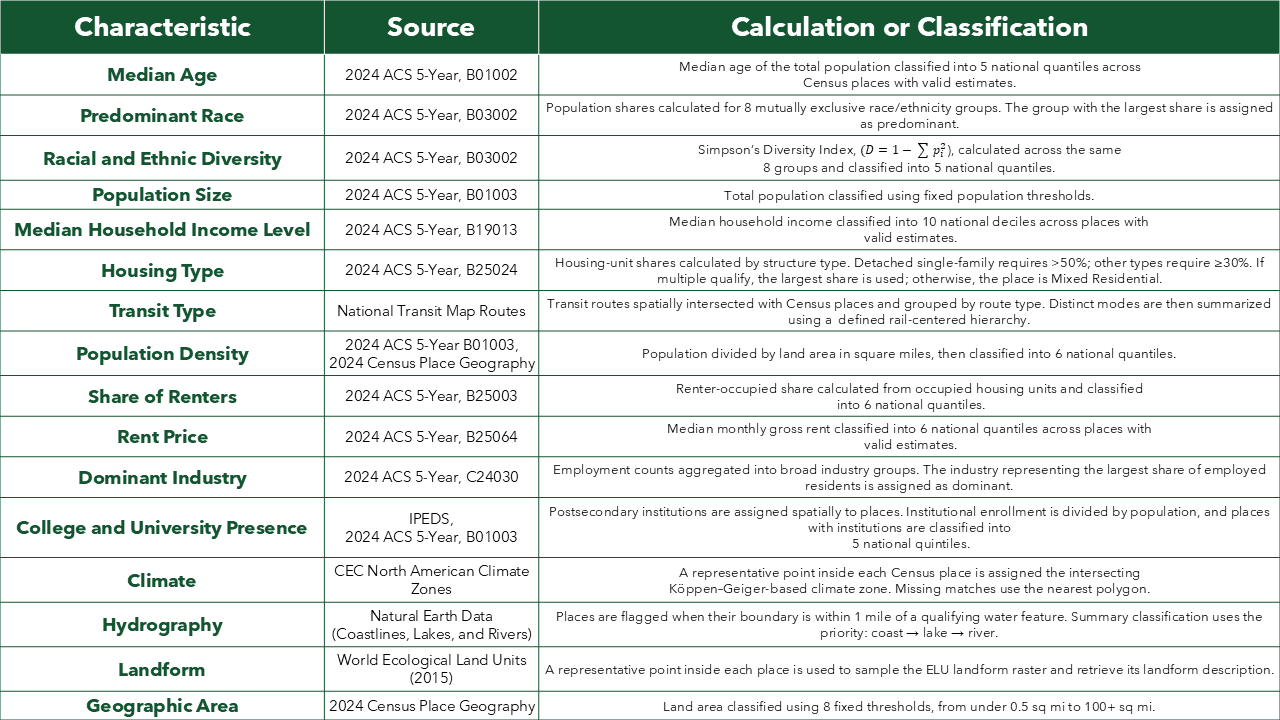
With over 30,000 places and 16 different characteristics to calculate, we used ArcPy notebooks to automate much of the data preparation and create the tables needed to load the results into the knowledge graph.
From there, we used the Census GEOID as a consistent identifier for each place and loaded the places into ArcGIS Knowledge, retaining their geometry. We then loaded the categorical characteristics and created relationships connecting each place to the characteristics that describe it:
[PLACE] → HAS_[CHARACTERISTIC] → [CATEGORY]
A single place can have up to 16 relationships with their various characteristics, while the same characteristic can be shared by thousands of different places. Two places that are far apart geographically can therefore become connected in the graph through the characteristics they have in common.
Exploring and Querying the Graph
Once the knowledge graph is built, we can start exploring the connections between places and their characteristics.
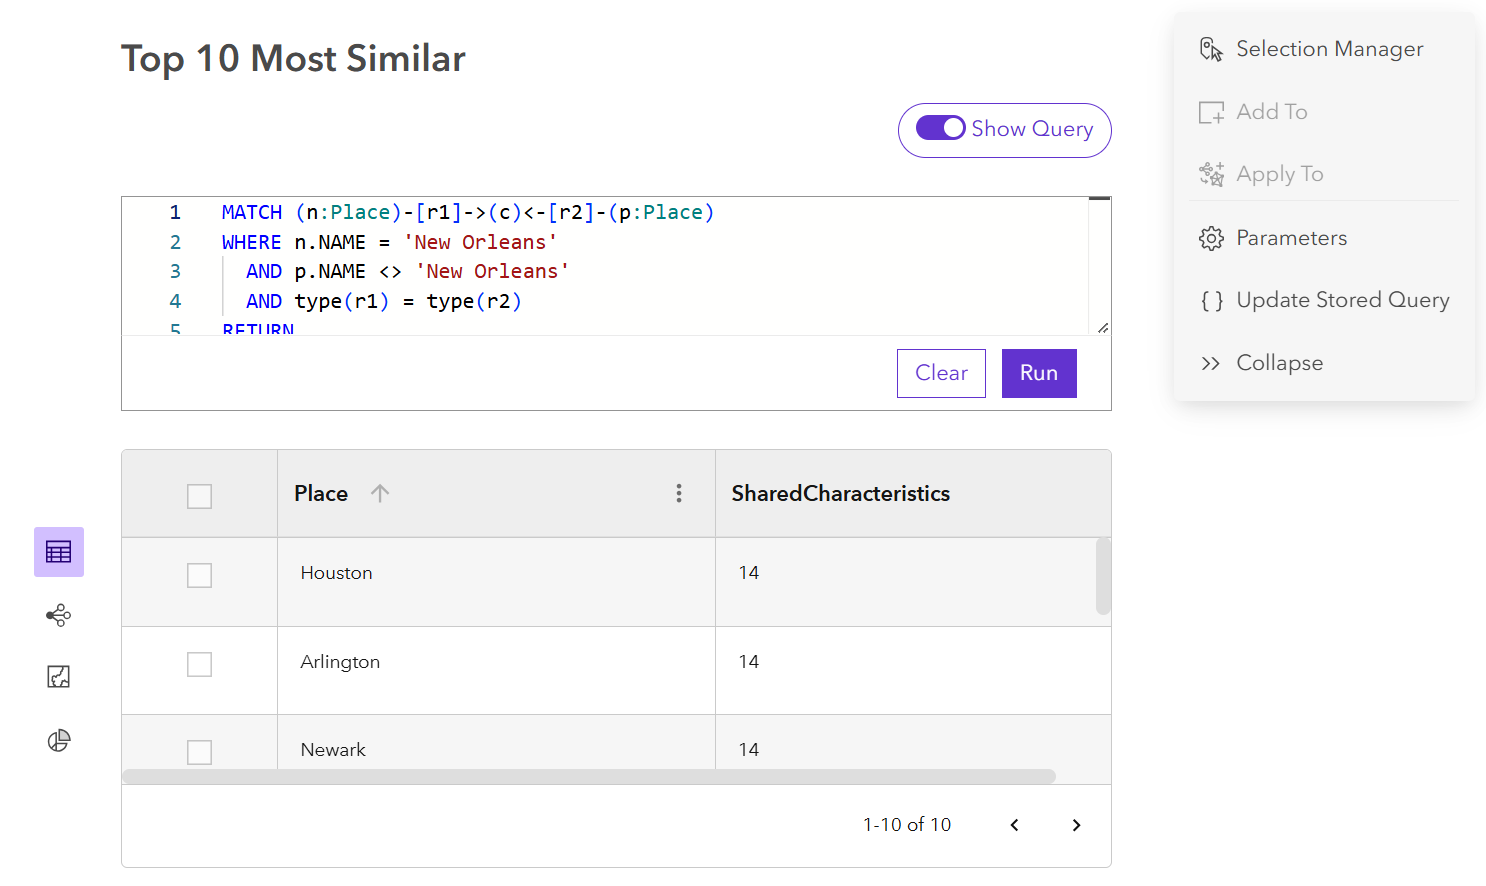
Using openCypher, we can translate questions about places into queries the graph can understand. For example, if we wanted to find the top 10 places most similar to New Orleans, Louisiana, we could write a query that counts shared characteristics and returns the places with the most in common.
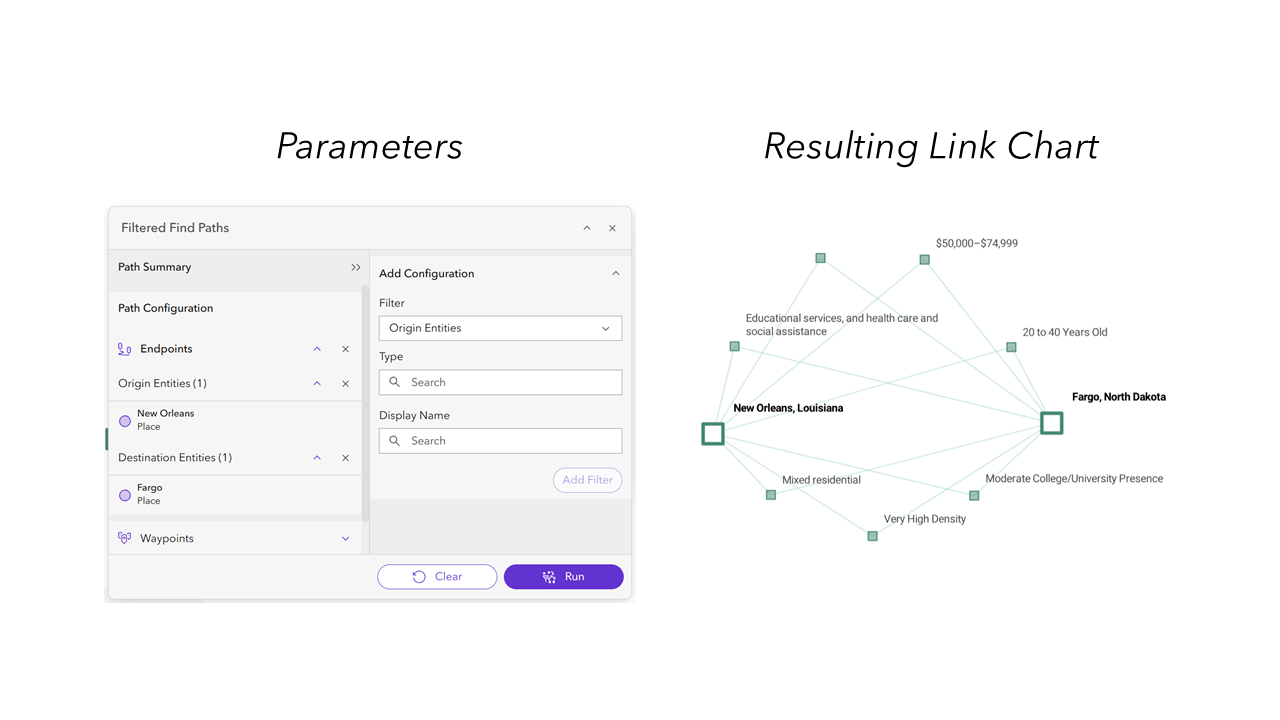
We can also explore the graph without ranking places by similarity. If we pick two places, the Find Path tool in ArcGIS Knowledge Studio can show how they are connected through the graph. For this project, that means we can see which characteristics connect one place to another.
Finally, we can change what we mean by “similar.” Not every characteristic has to matter equally. If we’re interested in transportation, we can give transportation characteristics more weight in the comparison. If we’re interested in climate, climate and physical geography can matter more.
As an example, we can narrow our search to places that resemble New Orleans specifically in their housing and environmental characteristics, rather than across every variable in the graph.
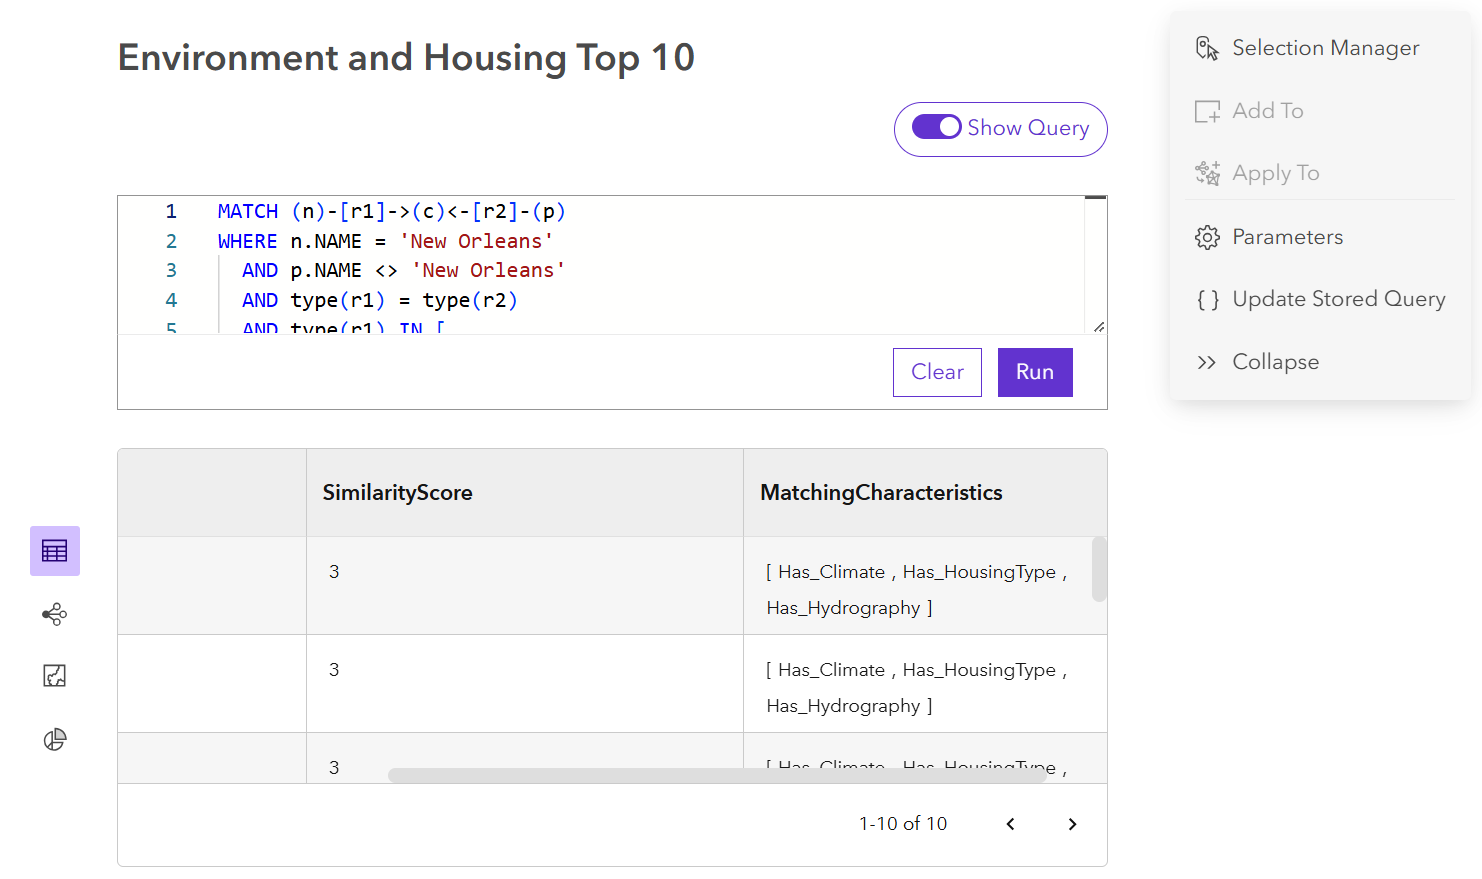
Together, these give us a few different ways to explore place similarity. We can find places with the most in common, look at the connections between two places, or change which characteristics matter most for the question we’re asking. And because those results come back to relationships in the graph, we can still see what is driving the comparison.
Making the Graph Easier to Explore
OpenCypher and the tools in ArcGIS Knowledge Studio give us ways to explore the knowledge graph directly. But not everyone who wants to explore similar places is going to know how to write a graph query.
Using the ArcGIS Maps SDK for JavaScript and the URL to our knowledge graph service, we built a web application that puts a more approachable interface on top of the same graph. Instead of writing openCypher queries, users interact with the data through a structured interface.
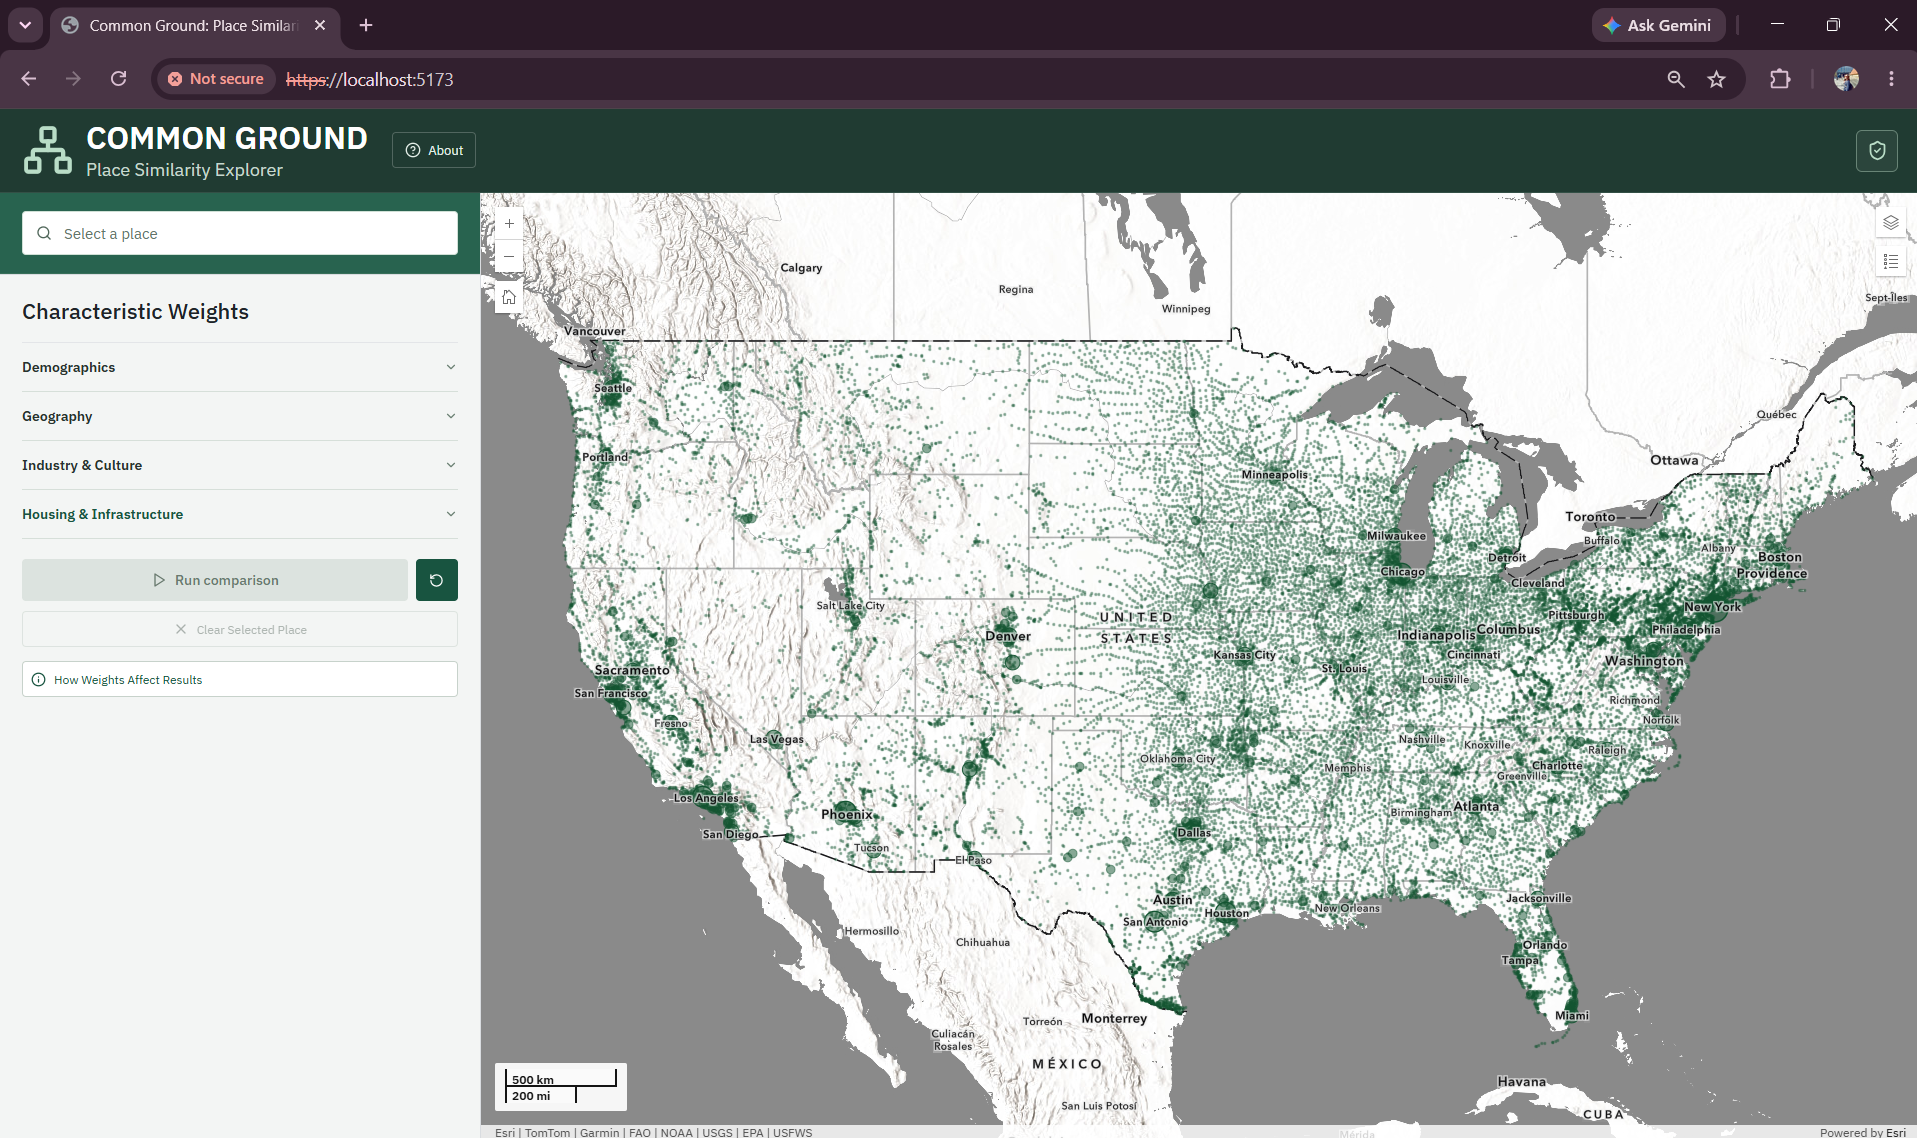
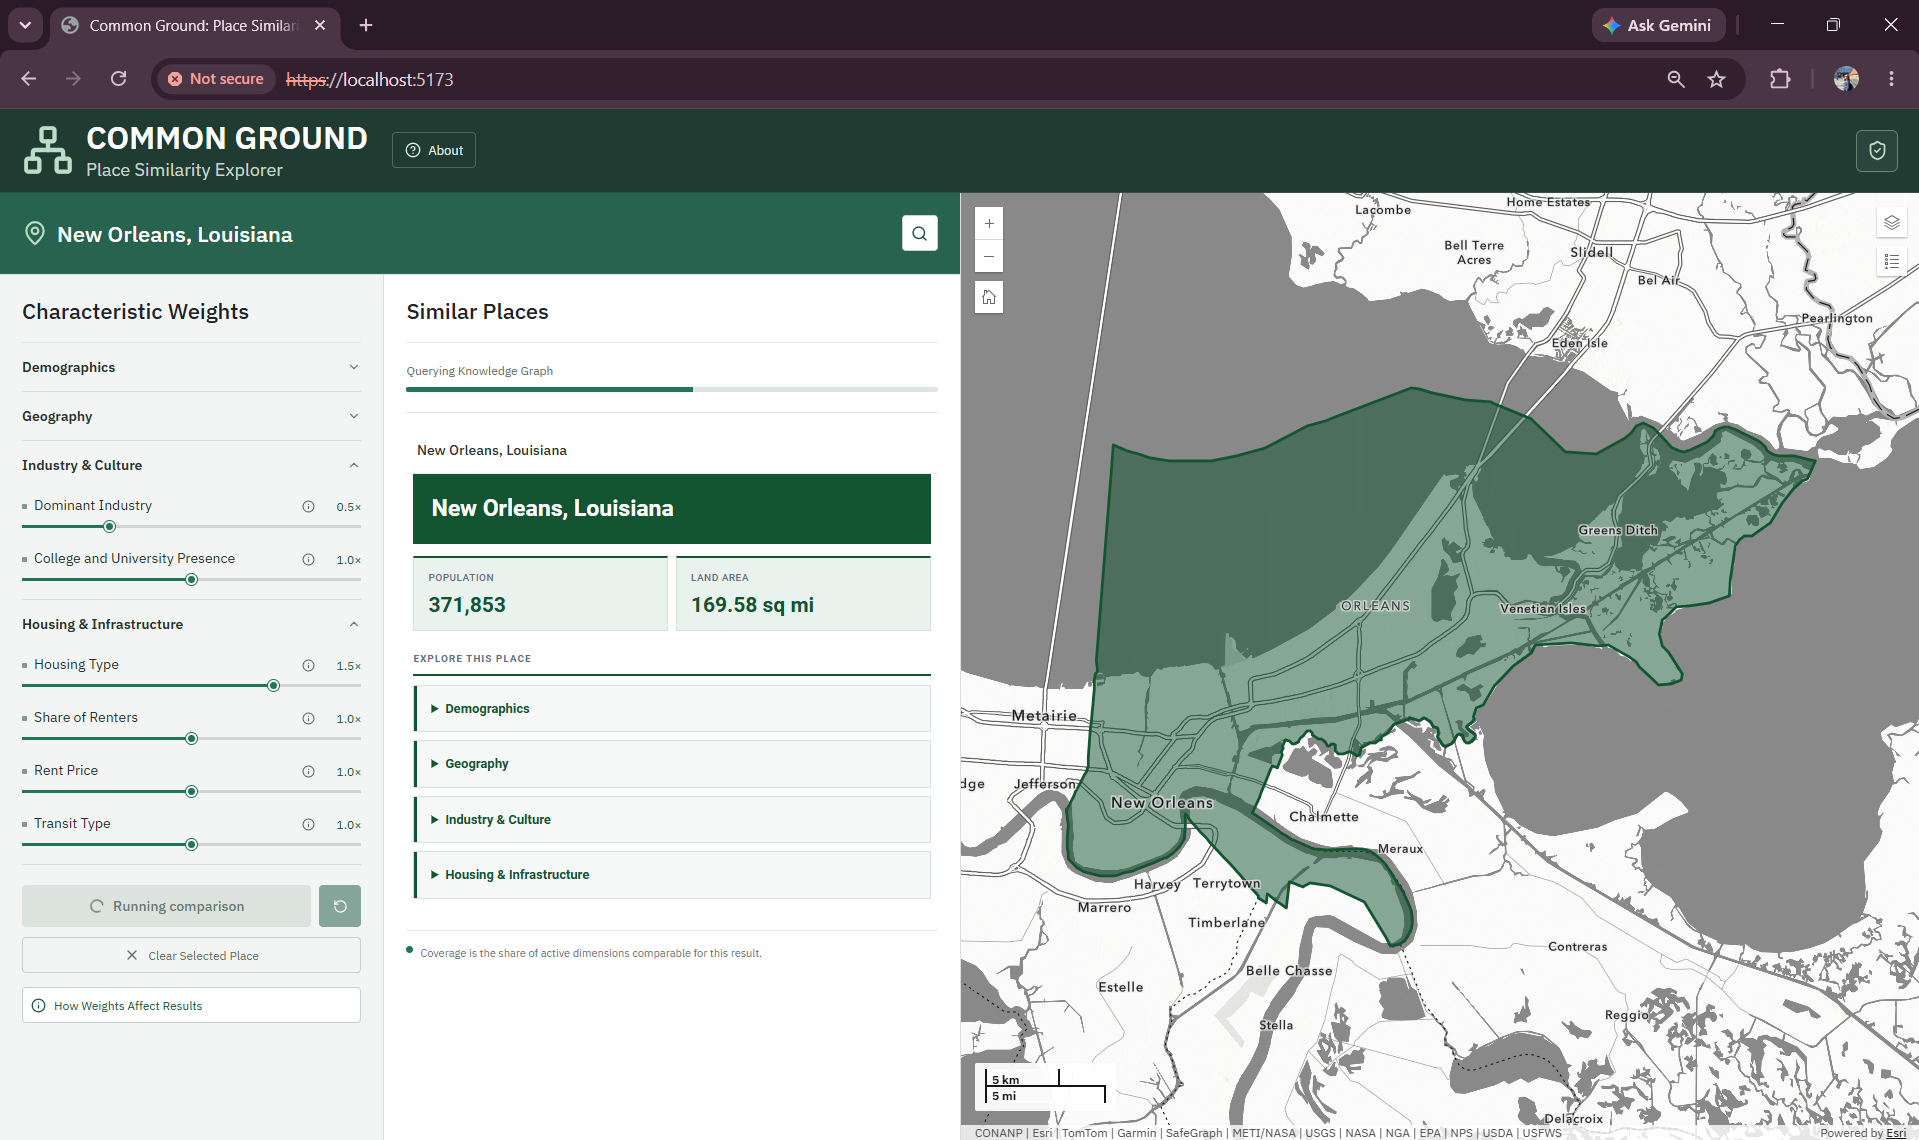
A user can start by searching for a place or selecting one on the map. From there, they can decide which characteristics matter most to them, adjust the weights, and run the comparison to find places that best match their criteria.
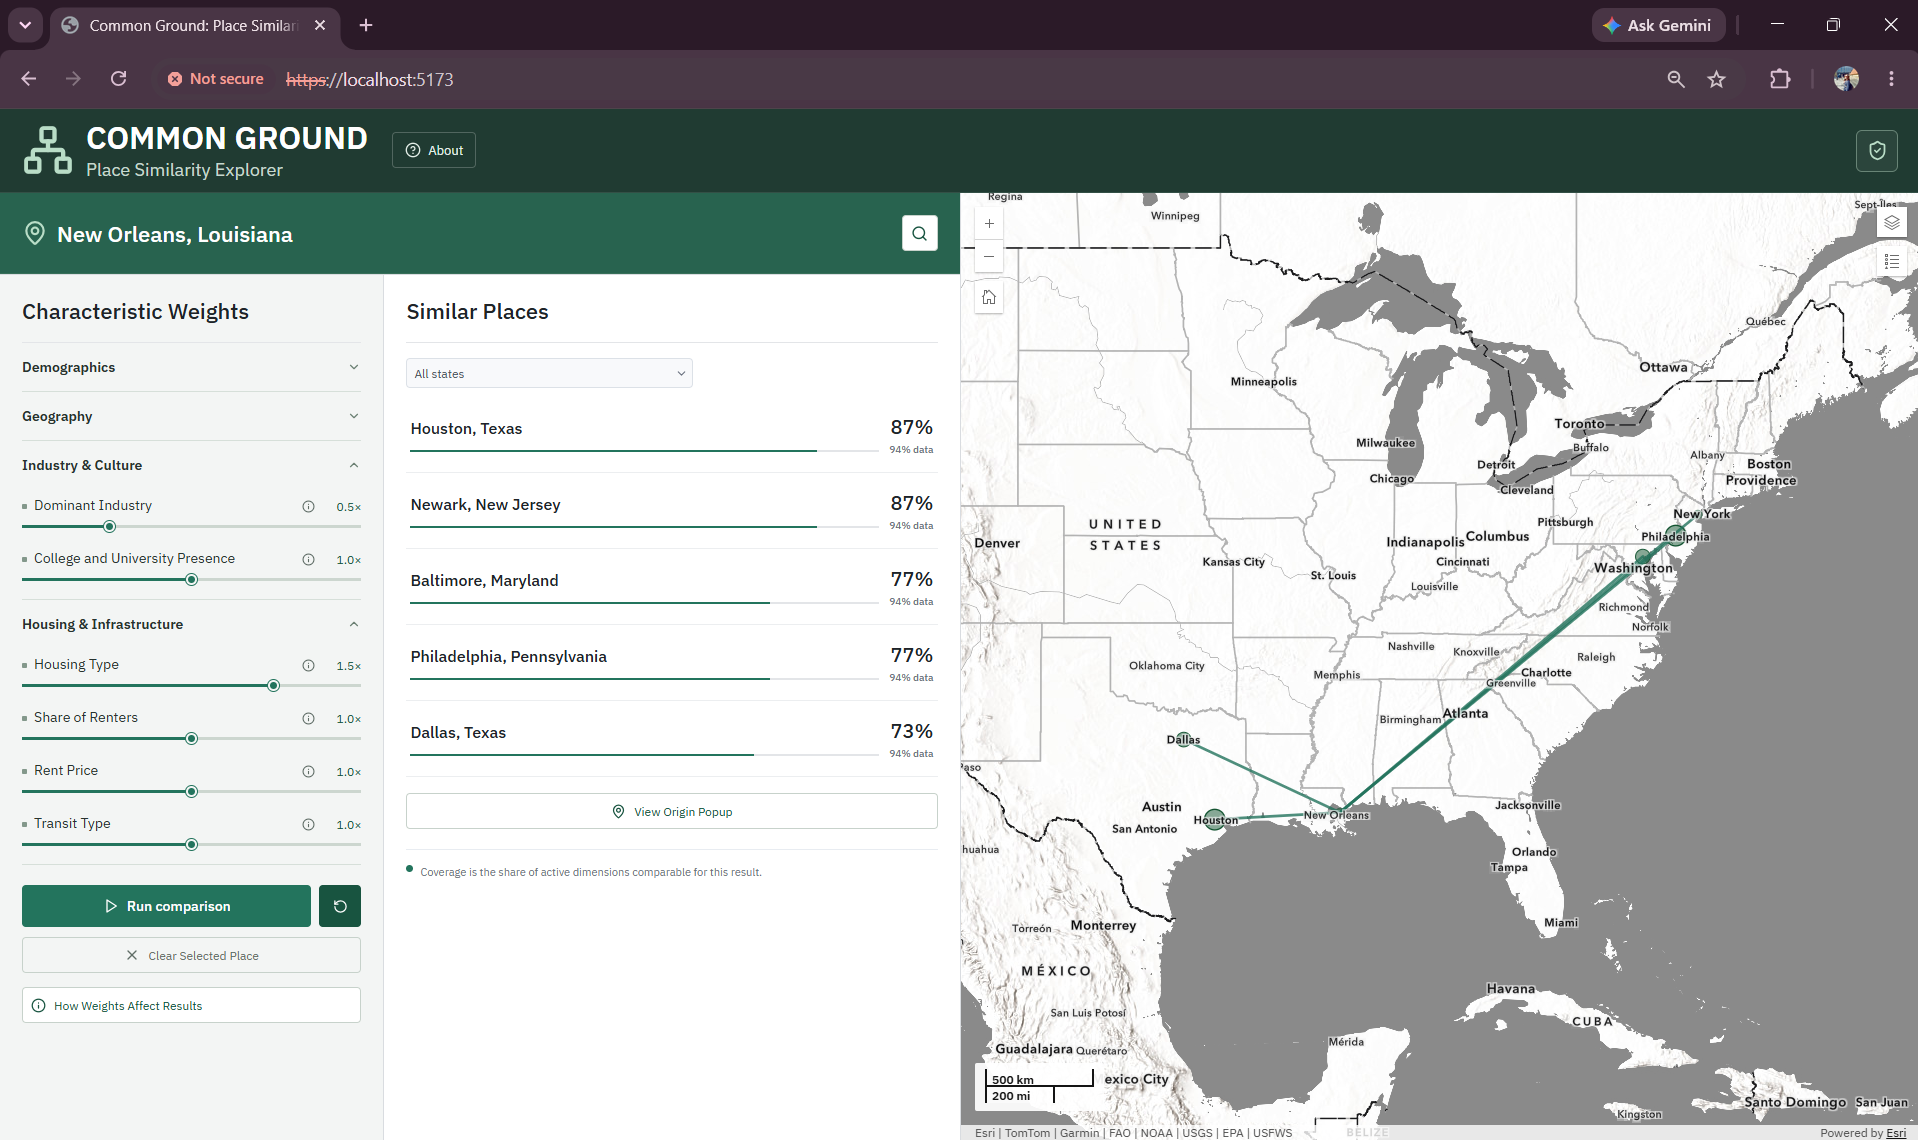
The results are shown on the map, and users can also explore the relationships behind them.
Selecting a similar place brings up a link chart showing the shared characteristics connecting it to the original place.
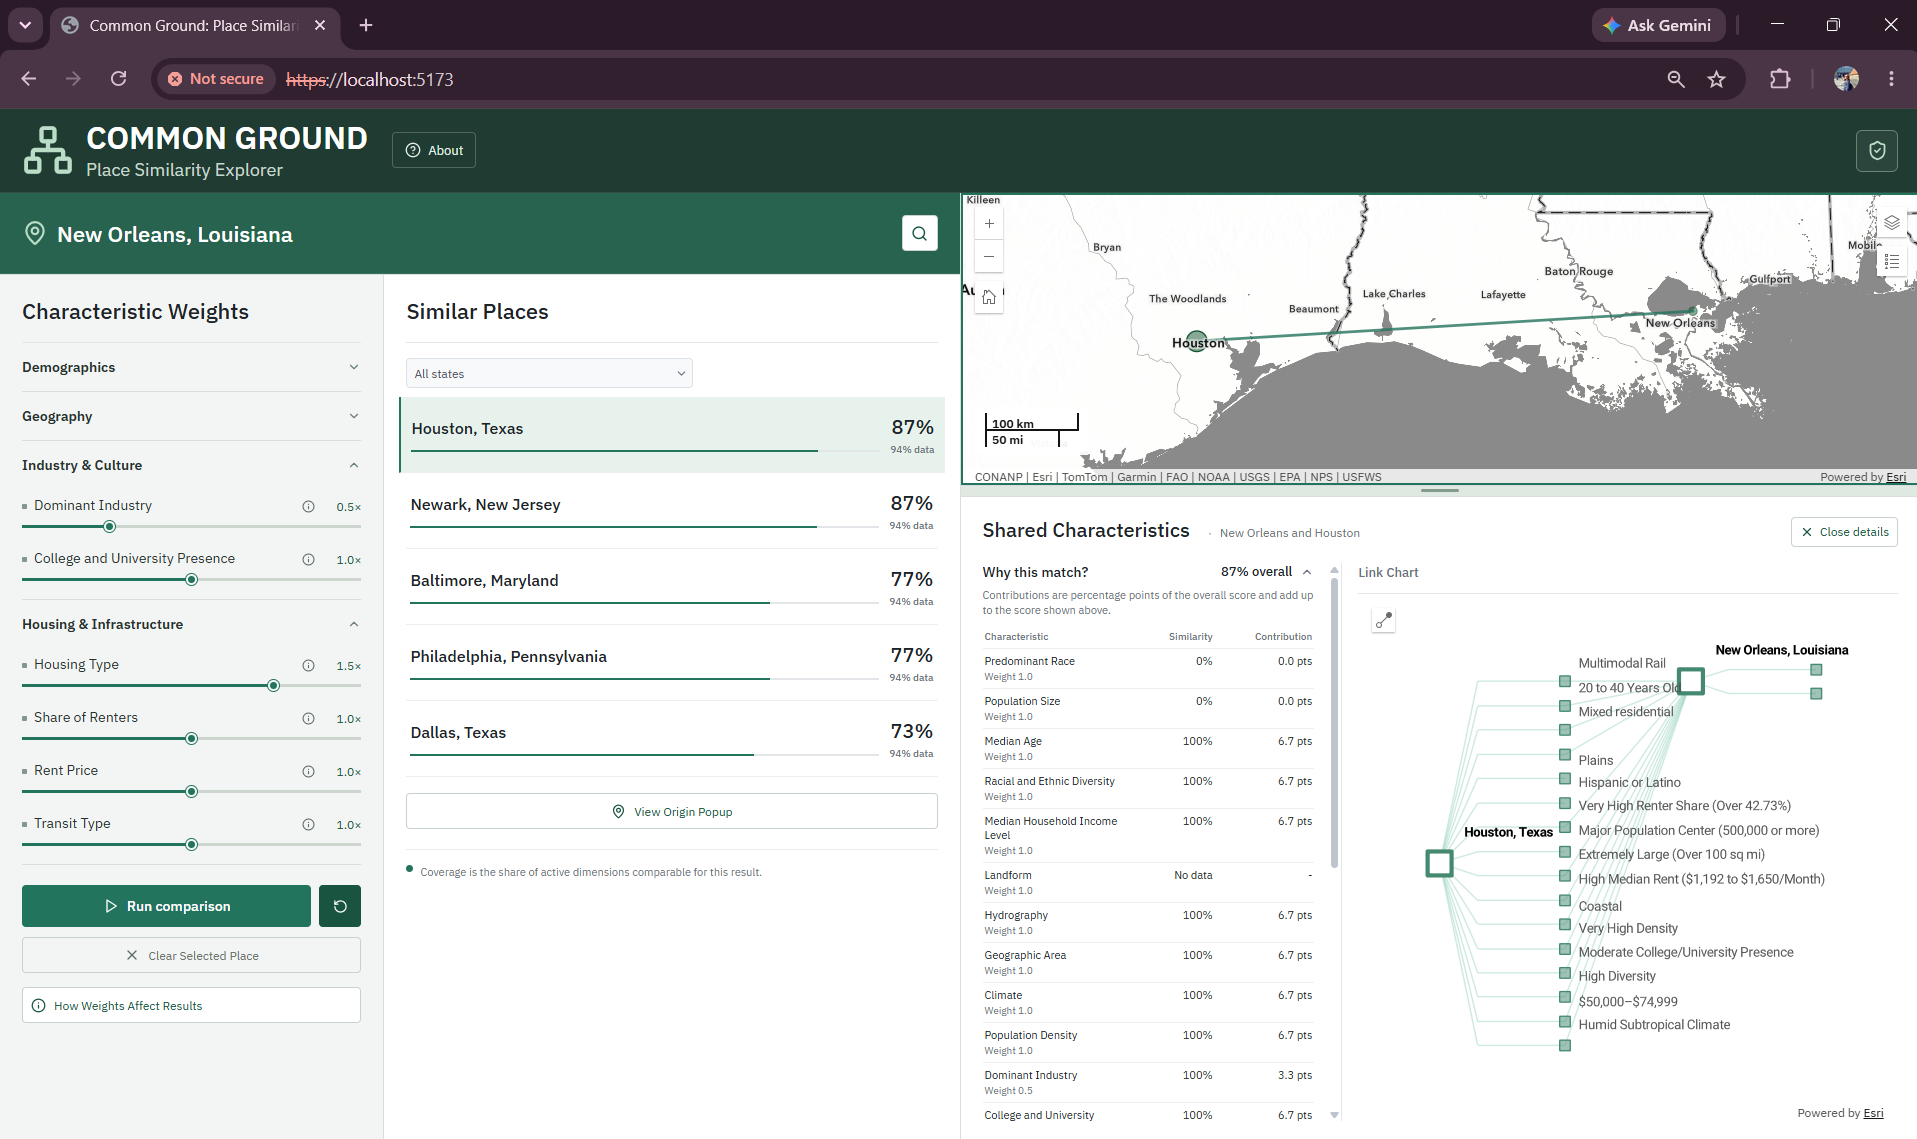
We can also include information about how each characteristic was calculated and where the underlying data came from. This gives users a way to see not just which places were returned, but what went into the comparison.
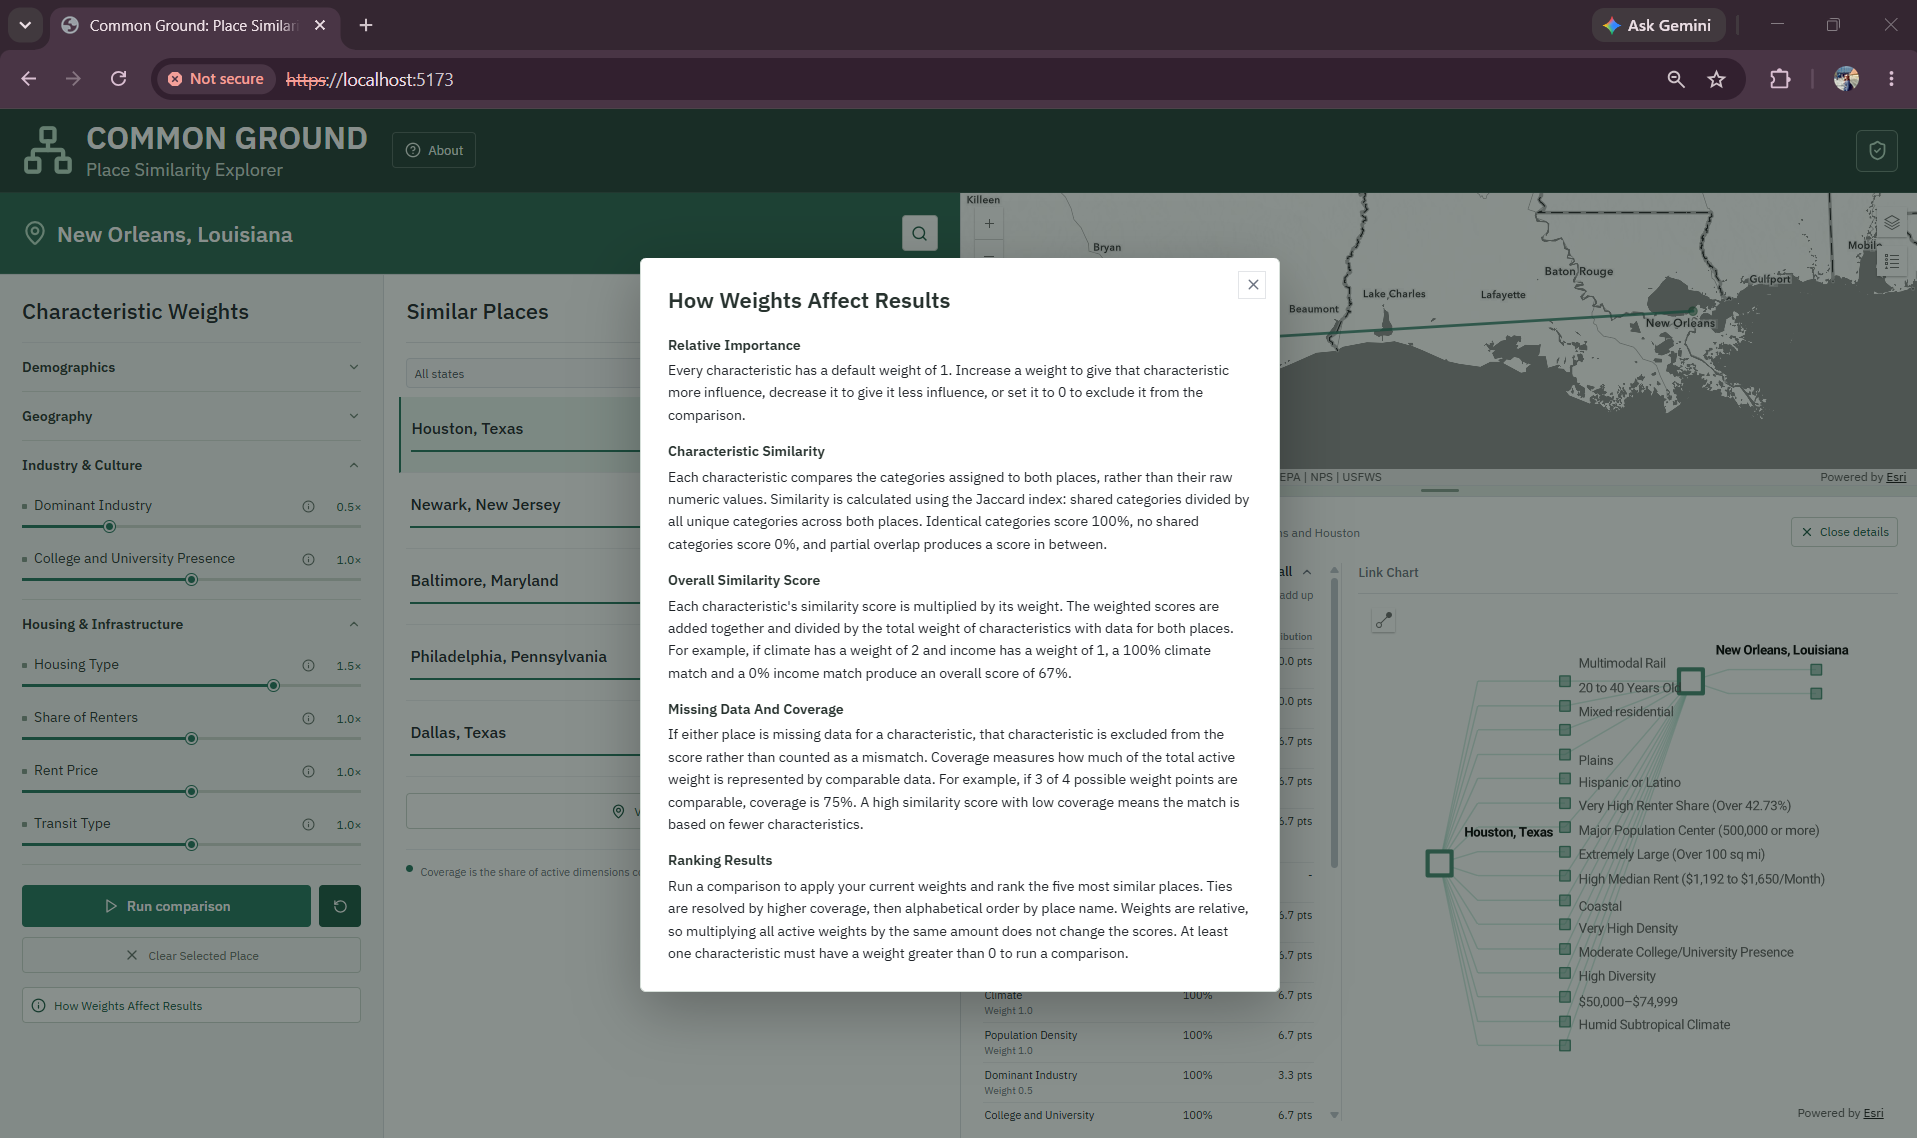
The knowledge graph is still doing the work behind the application. The ArcGIS Maps SDK for JavaScript gives us a way to turn those queries and relationships into a web experience where users can explore the graph without having to write the queries themselves.
Conclusion
Finding similar places across the United States can be a complex task, especially in a country with so many different communities and so many ways to describe them. But those comparisons can also be useful, whether we are looking for somewhere new to live or trying to understand how other communities have approached similar challenges.
Using ArcGIS Knowledge, we can not only identify places that have things in common but also understand what connects them and why. Because those connections are represented as relationships in the graph, we can trace a result back to the characteristics that contributed to it rather than relying on a similarity score alone.
For planners and policymakers, that can provide a starting point for finding peer communities, exploring what others have tried, and understanding whether those experiences might be relevant somewhere else. Similar places are not necessarily the same, but knowing what they have in common can help us make more meaningful comparisons.
By bringing geography and graph analytics together, ArcGIS Knowledge gives us a way to find connections between places that might otherwise be difficult to see, while keeping the reasons behind those connections visible.
Special thanks to Lydia Troup for assisting with the development of this blog!
Article Discussion: