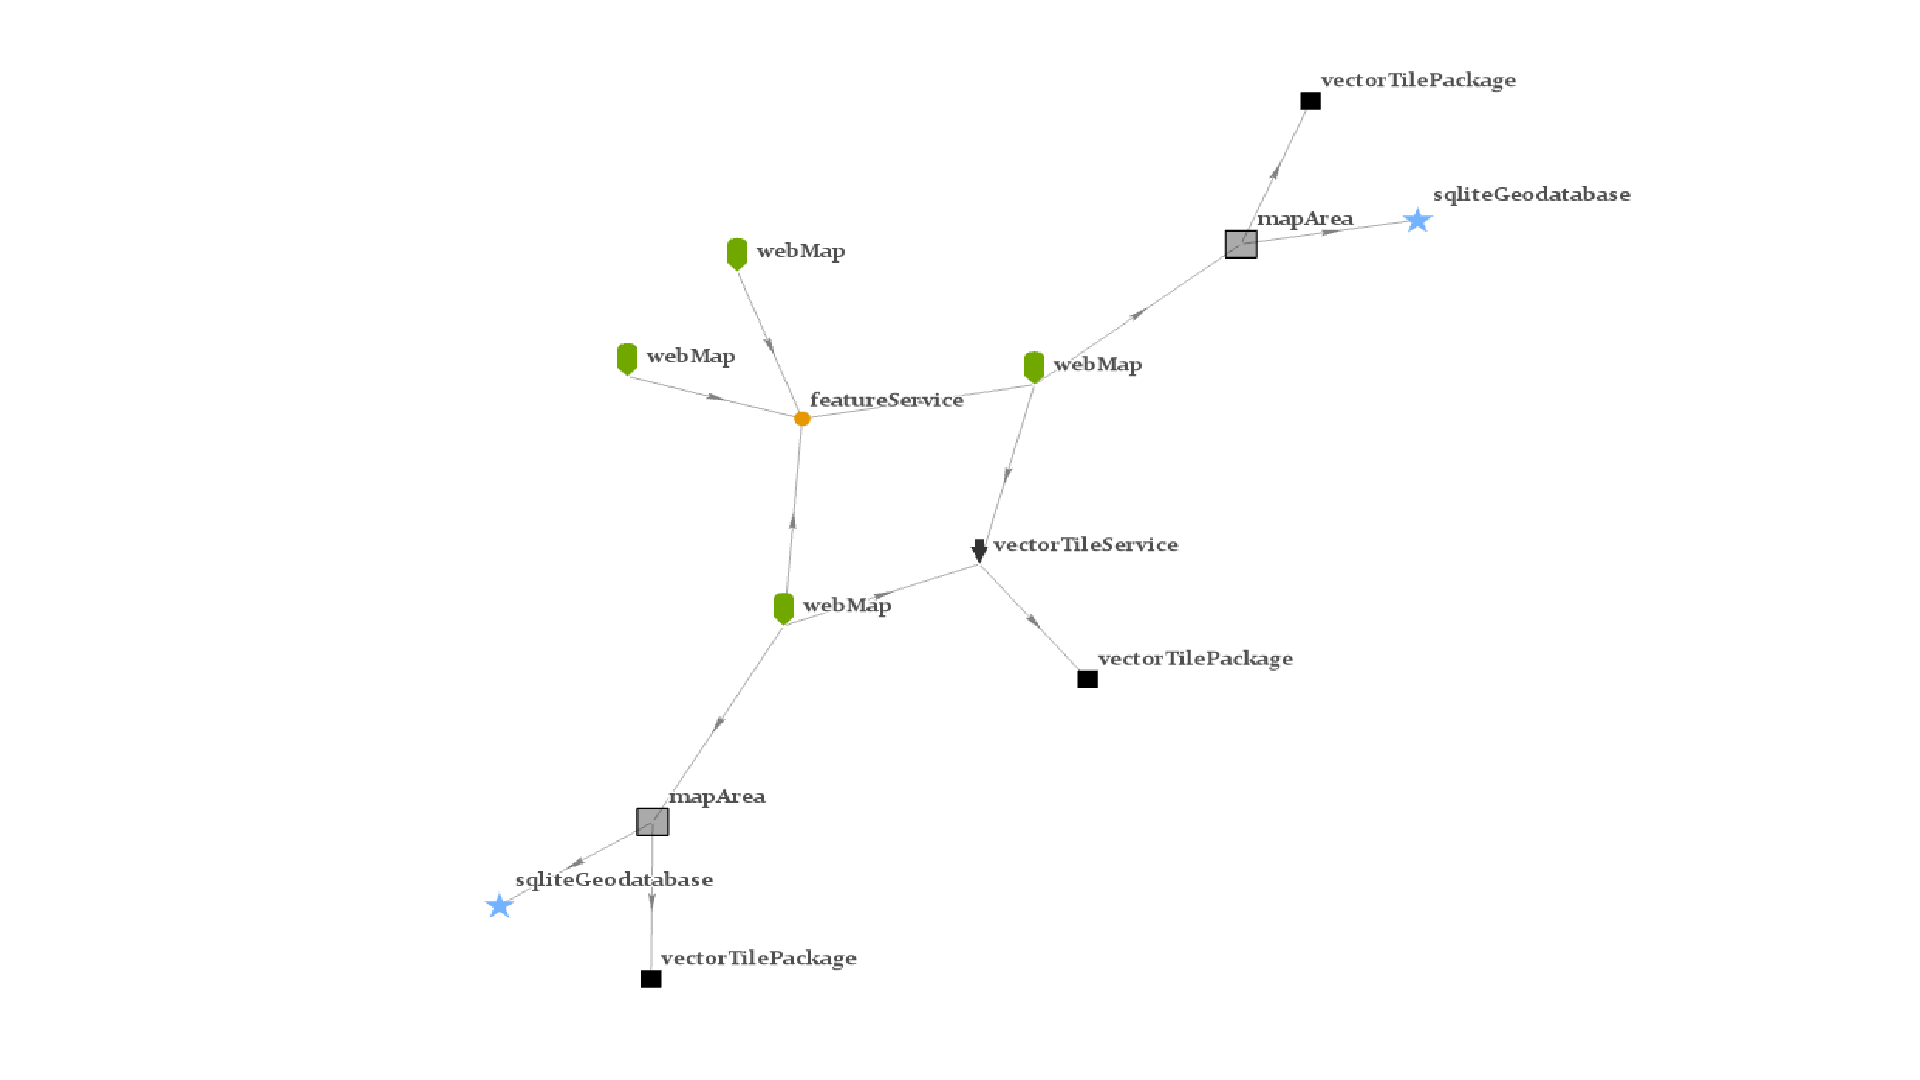
Introduction: What are we Discovering?
The goal of this workflow is to gain insight into how an ArcGIS Online or ArcGIS Enterprise organization’s items relate to one another. Understanding the ways that items (and services) depend on others is a key concept in managing an organization’s content. Here are a few examples of insights that this sort of data can provide:
- Which applications will be affected by a change to a service
- Which items must be included in migrations of other items
- Which items reference deleted or corrupted data sources
There are a ton of item types in the ArcGIS ecosystem (we’re talking hundreds!), and a variety of ways they can reference one another- so how is a user expected to figure this all out on their own? Luckily, there are some handy tools for compiling this information. The ArcGIS API for Python provides functionality that will analyze items to find all other items they connect to, and then compile them in a graph. This graph can then be fed into ArcGIS Knowledge, which gives users powerful tools for graph visualization and analysis.
Note that an ArcGIS Enterprise with ArcGIS Knowledge enabled is required for this workflow.
Terminology
Before we dive into the workflow, let’s establish some common terminology:
- A graph, in the context of this workflow, refers to the mathematic definition of the word: a set of related nodes connected by edges that define a relationship. All of the graphs in this workflow will contain nodes referring to ArcGIS items, services, or “unknown” types (a supposed item/service that may be corrupted or not exist). The graphs are directed, which means the edges have a one-way relationship. The relationship, in this case, is “has dependency” (see below).
The terminology may vary slightly depending on the product, but the concepts remain the same. - A dependency refers to a direct relationship between two items, with one relying on the other. For example, if a StoryMap contains a Web Map in its layout, the Web Map is a dependency of the StoryMap.
- A deep dependency refers to any dependency, dependency of a dependency, and so on, of a given item. This can be viewed as all other items needed for an item to exist. For example, if our Story Map contains a Web Map, and that Web Map contains a Feature Layer, then the Web Map and Feature Layer are both deep dependencies of the Story Map.
Part 1: The ItemGraph in the ArcGIS API for Python
As we mentioned earlier, there are various ways that items can reference other items & services. This includes relationships like:
- Web Maps displaying different Feature Layers & services
- Applications (like StoryMaps, Web Experiences, and Dashboards) containing embedded Web Maps and Scenes
- Feature Layers being published from files such as CSV’s, Shapefiles, File GeoDatabases, etc.
And many, many more. Due to the non-uniformity of items in the ArcGIS ecosystem, these relationships may be documented in different ways. Some are stored within the JSON data or resource files of an item, some are stored at designated REST endpoints for documenting relationships, and others in unique, one-off ways. In order to assemble a dependency graph with the total picture, they must be able to compile the data from all of these sources for each item type. This is what the functionality in the arcgis.apps.itemgraph module of the ArcGIS API for Python aims to do.
The create_dependency_graph() function will construct an ItemGraph based on a set of root items fed into the function. Once the graph is constructed, users can access an ItemNode for each node in the graph, which contains helper functions to see other items that relate to the node in question. The ItemGraph is an extension of networkx’s DiGraph class, giving users all sorts of options for scripted graph manipulation.
Below, we’ll create an ItemGraph and use the ItemGraph.to_knowledge_graph() function to convert it to a Knowledge Graph before doing any analysis. See this guide for more on the specifics and usage of the to_knowledge_graph() function. Refer to this guide for more on ItemGraph basics and analysis, and this sample for an advanced use case.
Creating your ItemGraph and Converting it to a Knowledge Graph
Despite the rather complex nature of how an ItemGraph is created behind the scenes, what we do here as an end user is quite simple:
- Establish our GIS connection and grab the items from our organization that we want to analyze
- Call
create_dependency_graph()to create anItemGraph - Call
ItemGraph.to_knowledge_graph()to create a Knowledge Graph
Below you’ll find a screenshot showing these steps. Note that the ItemGraph is built from items in a different organization than our Enterprise with ArcGIS Knowledge configured, but we can still create a Knowledge Graph from it. This aspect and other details are explained further in the previously mentioned guide.

Now, we’re ready to use the power of ArcGIS Knowledge to analyze our Items and their dependencies.
Part 2: Working with your Knowledge Graph in Python
ArcGIS Knowledge provides tools that will allow you to do deeper analysis into the patterns in the dependencies of your items. To create knowledge graphs using ArcGIS Knowledge, you will need a Knowledge Server and Graph Data Store configured in your ArcGIS Enterprise environment. Learn more about getting started with ArcGIS Knowledge.
ArcGIS Knowledge uses openCypher queries, which focus on defining the patterns in the graph you want to find and filtering the data within those patterns down to the desired matches. Read more about the syntax for it here.
The types of questions you will be able to answer using openCypher queries in Python are:
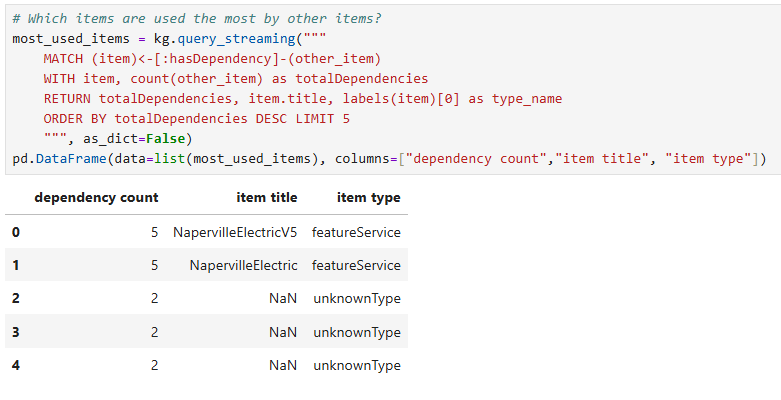
- Which items are used the most by other items?
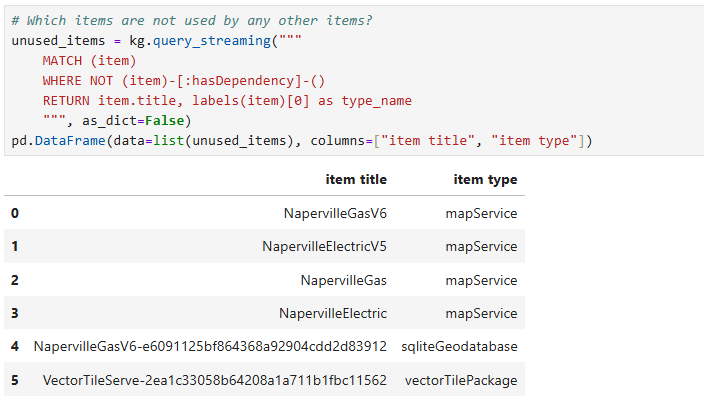
- Which items are not used by any other items?
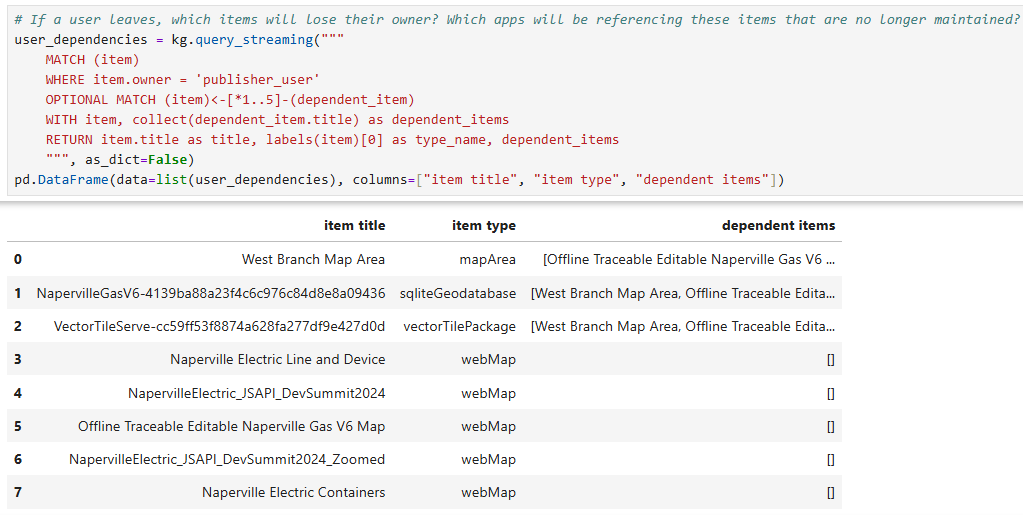
- If a user leaves, which items will lose their owner?
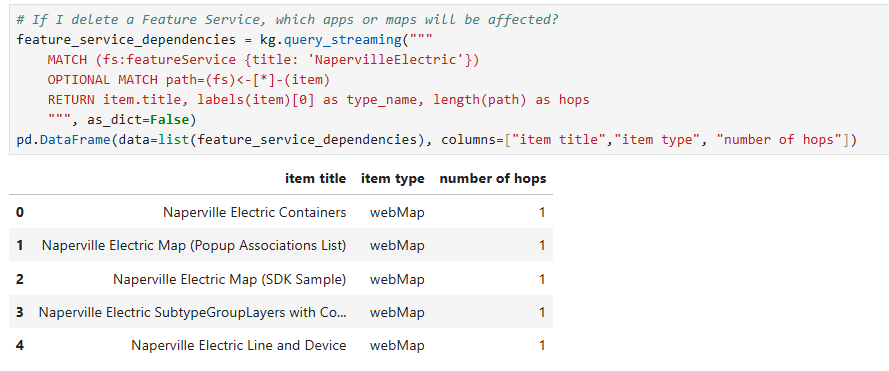
- If I delete a Feature Service, which apps or maps will be affected?
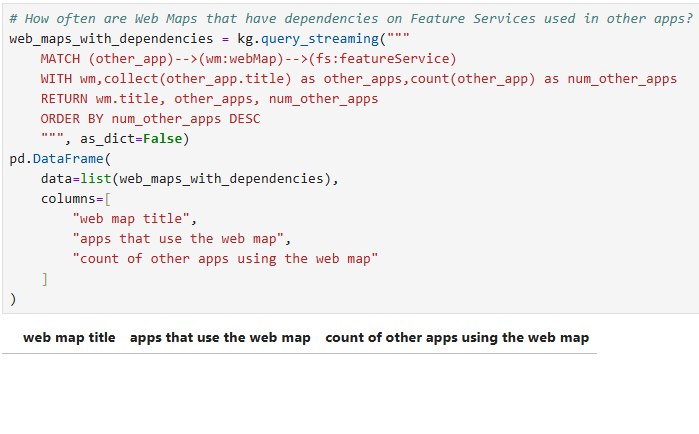
- How often are Web Maps that have dependencies on Feature Services used in other apps?
Queries to answer these questions can be executed in Python using the arcgis.graph module. Since we already created the knowledge graph in Part 1, we can directly use the KnowledgeGraph object in the kg variable.
In the first query, we are finding all items that depend on other items and returning the name, type, and number of dependencies for each of those items.
For the second query, we will find all items that do not have any dependencies in either direction (meaning they do not depend on anything and nothing depends on them) and return their names and types. These are items that we can delete with no impact on other items.
In this third query, we want to look at the implications of a specific user leaving or being deleted- we’ll call them “publisher_user”. Our query will return all items owned by publisher_user and all deep dependency items within 5 hops of those items owned by publisher_user. Our output dataframe will show each of those items and any dependencies they have. The dataframe will reveal that we need to make a plan to transfer the top three items to a new owner, as they have dependencies.
For our fourth query, we’re analyzing a specific Feature Service titled NapervilleElectric. Our query will find any items in the graph that are dependent on this Feature Service item, then return those item’s titles, type names, and how many hops away they are from our NapervilleElectric Feature Service.
Our final query finds any apps that depend on a Web Map containing a Feature Service. The query returns the Web Map information, along with a count of the apps that depend on it and a list of those apps. In our example graph, there are none.
We’ve now answered a handful of important questions programmatically- but we can continue our analysis of this graph outside of Python, using Knowledge Studio.
Part 3: Knowledge Studio and the ArcGIS Assistant AI Agent
Knowledge Studio
The alternative to scripted analysis of a Knowledge Graph is working with them in Knowledge Studio. Knowledge Studio gives users a graphical interface for working with their Knowledge Graphs. Like through the Python workflow, you can query and analyze your graphs, but the added benefit of Knowledge Studio is the ability to visualize your spatial entities on maps or how your data is connected using Link Charts.
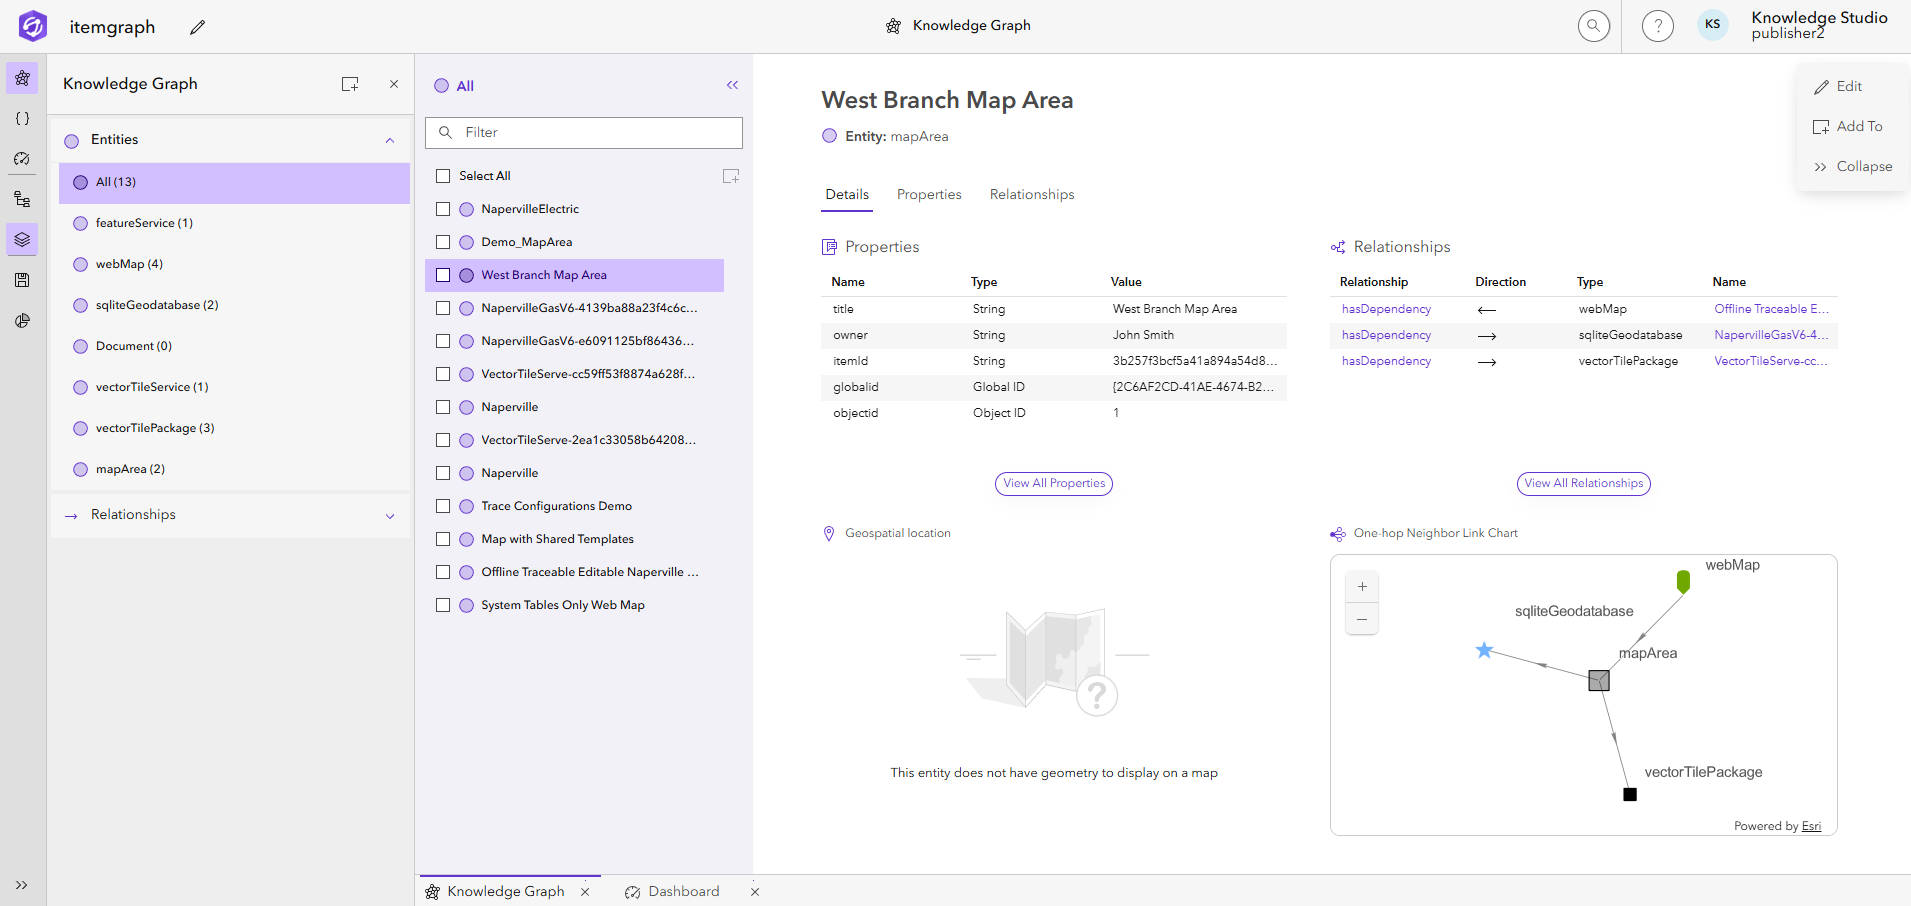
Knowledge Studio provides different views to analyze and visualize your data. The “Knowledge Graph” view provides an overview of the entities and relationships in the graph by their type, displaying details such as properties and direct connections.
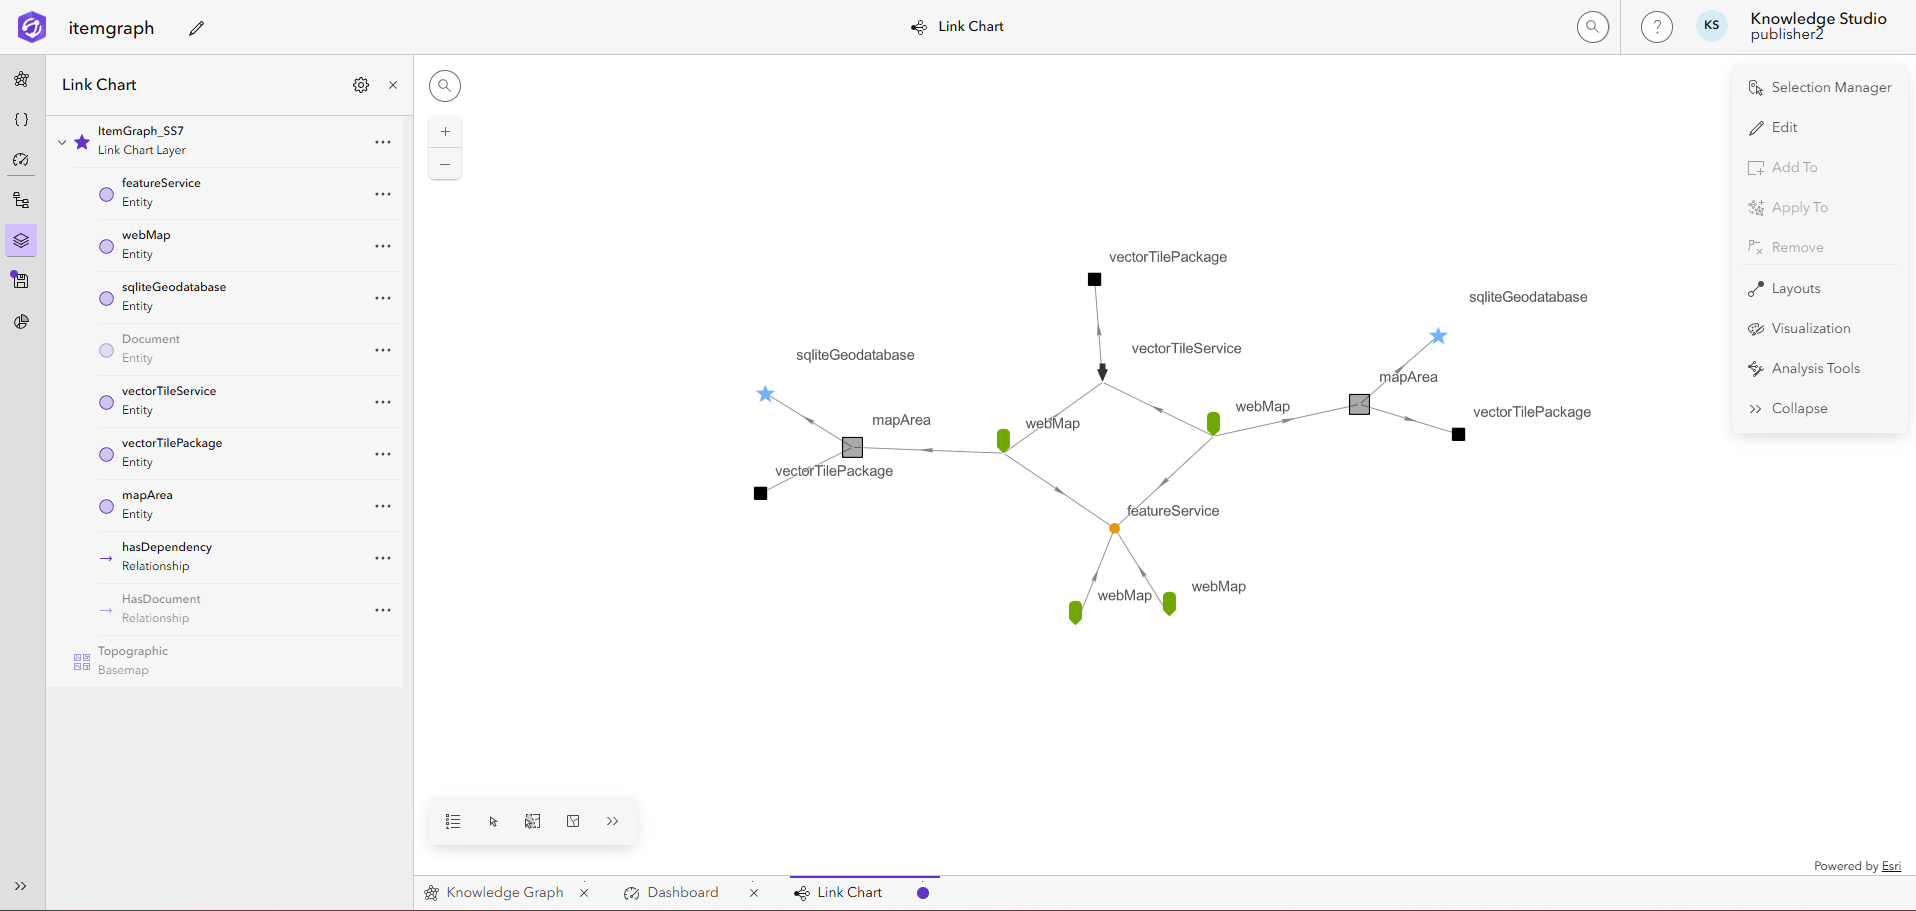
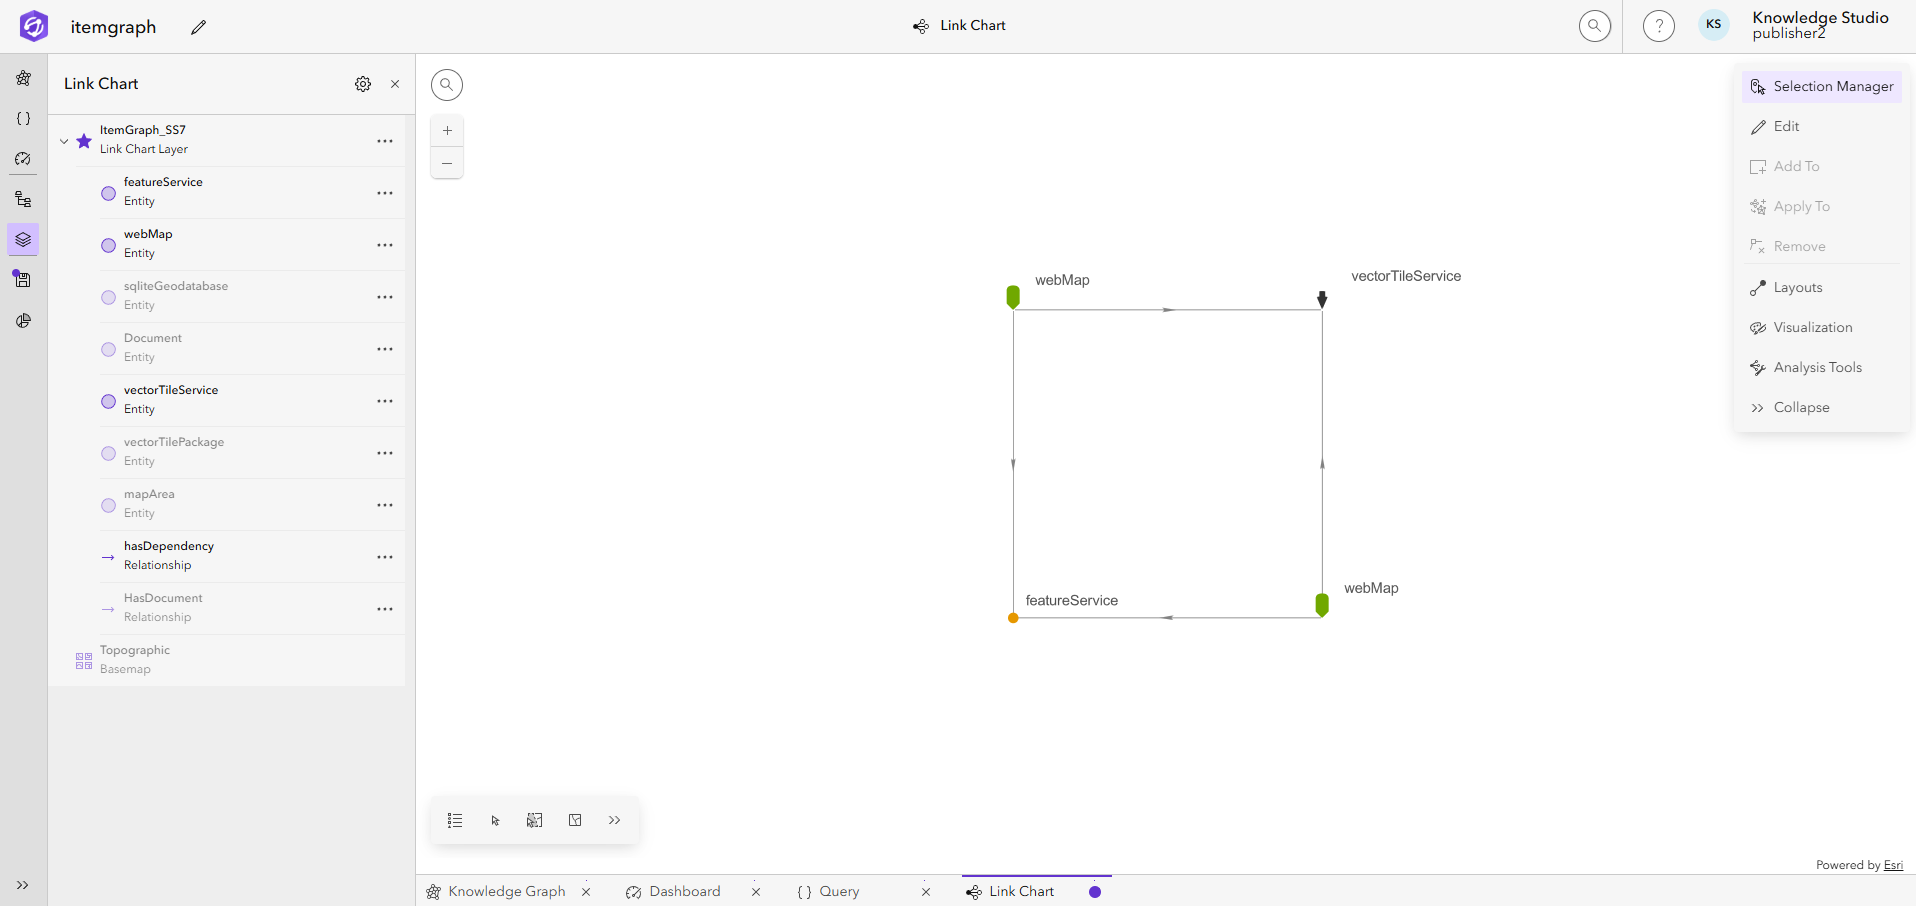
Link Charts allow us to visualize how items relate to one another. We can use the link chart to further analyze our data by expanding direct connections from specific entities or finding multi relationship paths between specific items. Check out the documentation for other link chart analysis examples.
As in the Python example, we can analyze the graph using queries in the query view. Here we can use the same query to find the items with the most dependencies.

We can then take the two most used items and add them to a new link chart to continue our analysis. We can then select these entites and use the graph analysis tool “find paths” to find the path through other items that connect this feature service and vector tile service, allowing us to identify how these two high dependency items might be connected to each other.
ArcGIS Assistant Knowledge Agent
Our final avenue for analysis is our newest one: an ArcGIS Knowledge AI agent in the ArcGIS Maps SDK for JavaScript, available in version 5.1+. Refer to this page for more on getting started with the JavaScript SDK, and click around for various tutorials and samples.
The ArcGIS Assistant Knowledge Agent, like the other agents in the newly available ArcGIS AI Assistant, is an AI agent that uses NLP (natural language processing) to allow the user to ask questions and explore their data. The Knowledge Agent specializes in ArcGIS Knowledge-oriented workflows, and can use your current data as context, allowing you to explore and analyze your Knowledge Graphs, Link Charts, and Knowledge Graph Layers.
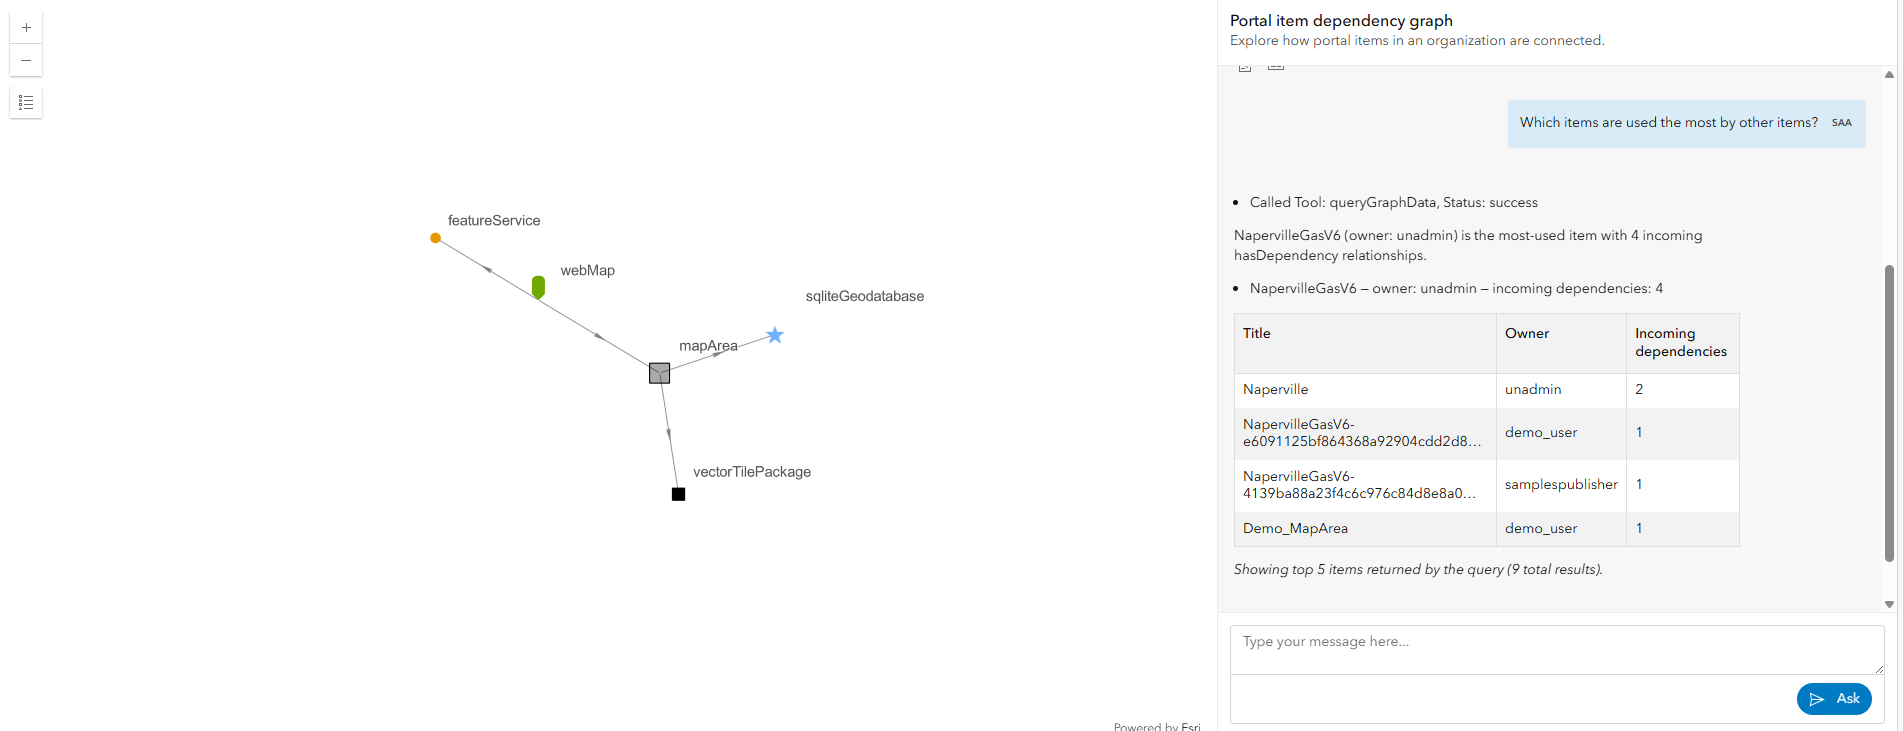
The knowledge agent can be used with a knowledge graph service, a link chart or a map with a knowledge graph layer as context. To use the knowledge graph with a link chart created from a query:
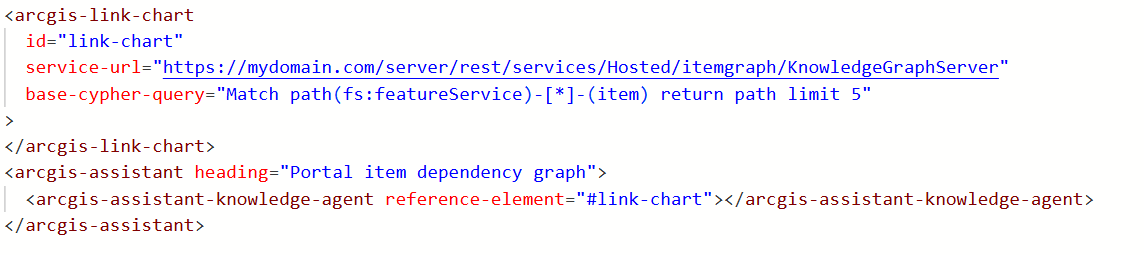
If you just want to use the knowledge graph by itself, you can provide the service URL directly to the agent.

You can use the knowledge agent to ask the same questions that we wrote earlier using openCypher in Python.
- Which items are used the most by other items?
- Which items are not used by any other items?
- If a user leaves, which items will lose their owner?
- If I delete a Feature Service, which apps or maps will be affected?
- How often are Web Maps that have dependencies on Feature Services used in other apps?
This sample displays the agent in action using a link chart portal item with a subset of our demo graph as context. To use with a map portal item, simply swap out the link chart with a map containing a knowledge graph layer. Below is a video of the agent in action. If you have an ArcGIS Online account, you can use the agent and interact with the graph yourself! Try out the suggested prompts or ask your own questions to see how you might explore your own item graph data.
See the embedded video below for a demo of the agent in action, or follow this link. Happy analyzing!



Article Discussion: