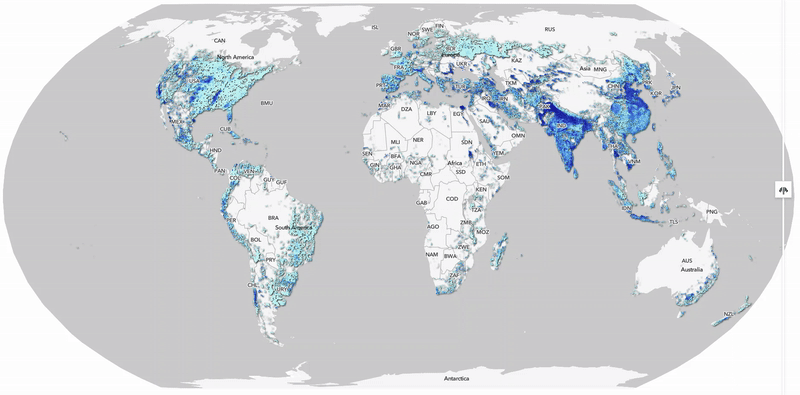
While the expansion of irrigated agriculture has boosted global food production, it has also placed significant stress on freshwater resources. Ensuring that increases in irrigated production occur only in places where water is relatively abundant is a key objective of sustainable agriculture. Moreover, knowledge of how irrigated land has evolved over time is important for measuring progress towards water sustainability. To help analysts visualize and understand irrigated statistics, there is a new layer available within ArcGIS Living Atlas called Global Irrigated Area 2000-2015.
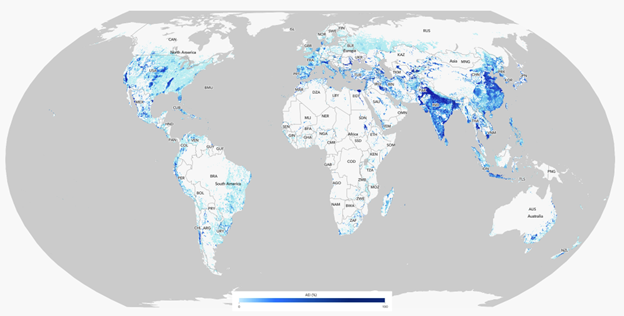
The layer contains an assessment of area equipped for irrigation (AEI), allowing for comparisons of ha (hectares) of irrigation over time to better understand water stress around the globe.
Understanding Area Equipped for Irrigation (AEI)
Published in the Nature Water journal, this dataset utilizes the latest subnational irrigation statistics (covering 17,298 administrative units) from various official sources, and maps the global extent of irrigated area (areas equipped for irrigation) at 5 arcminute (~10km) resolution for the years 2000, 2005, 2010 and 2015. The dataset is based on irrigation statistics compiled from international organizations, national government reports and other official sources worldwide.
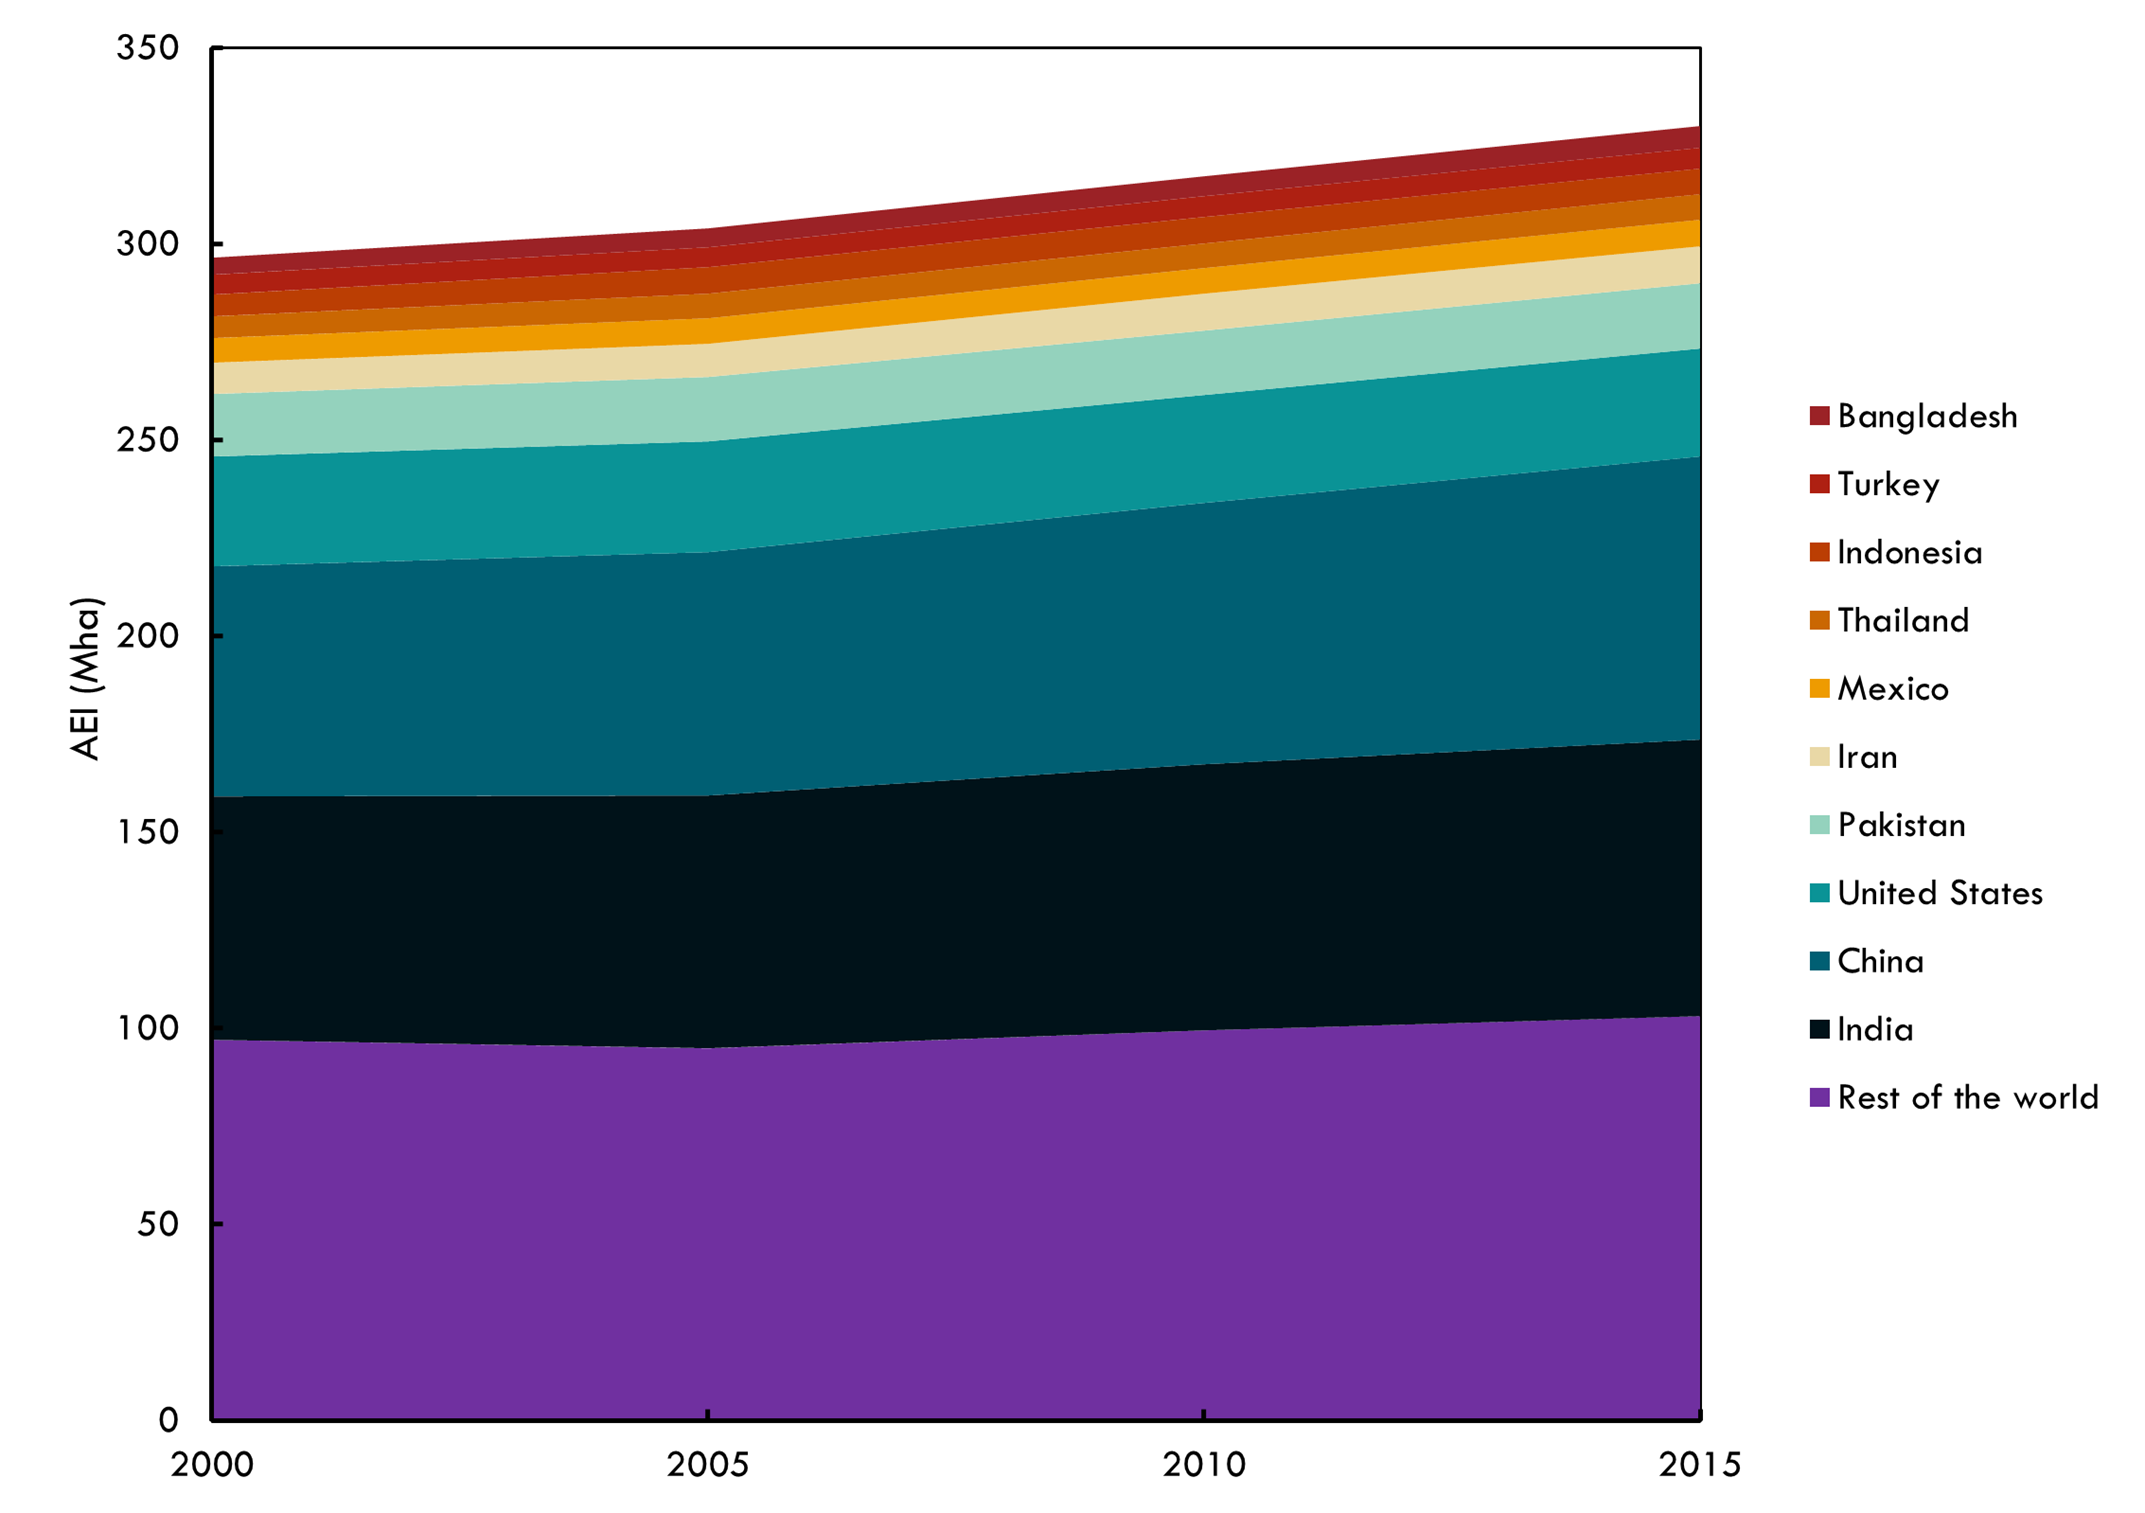
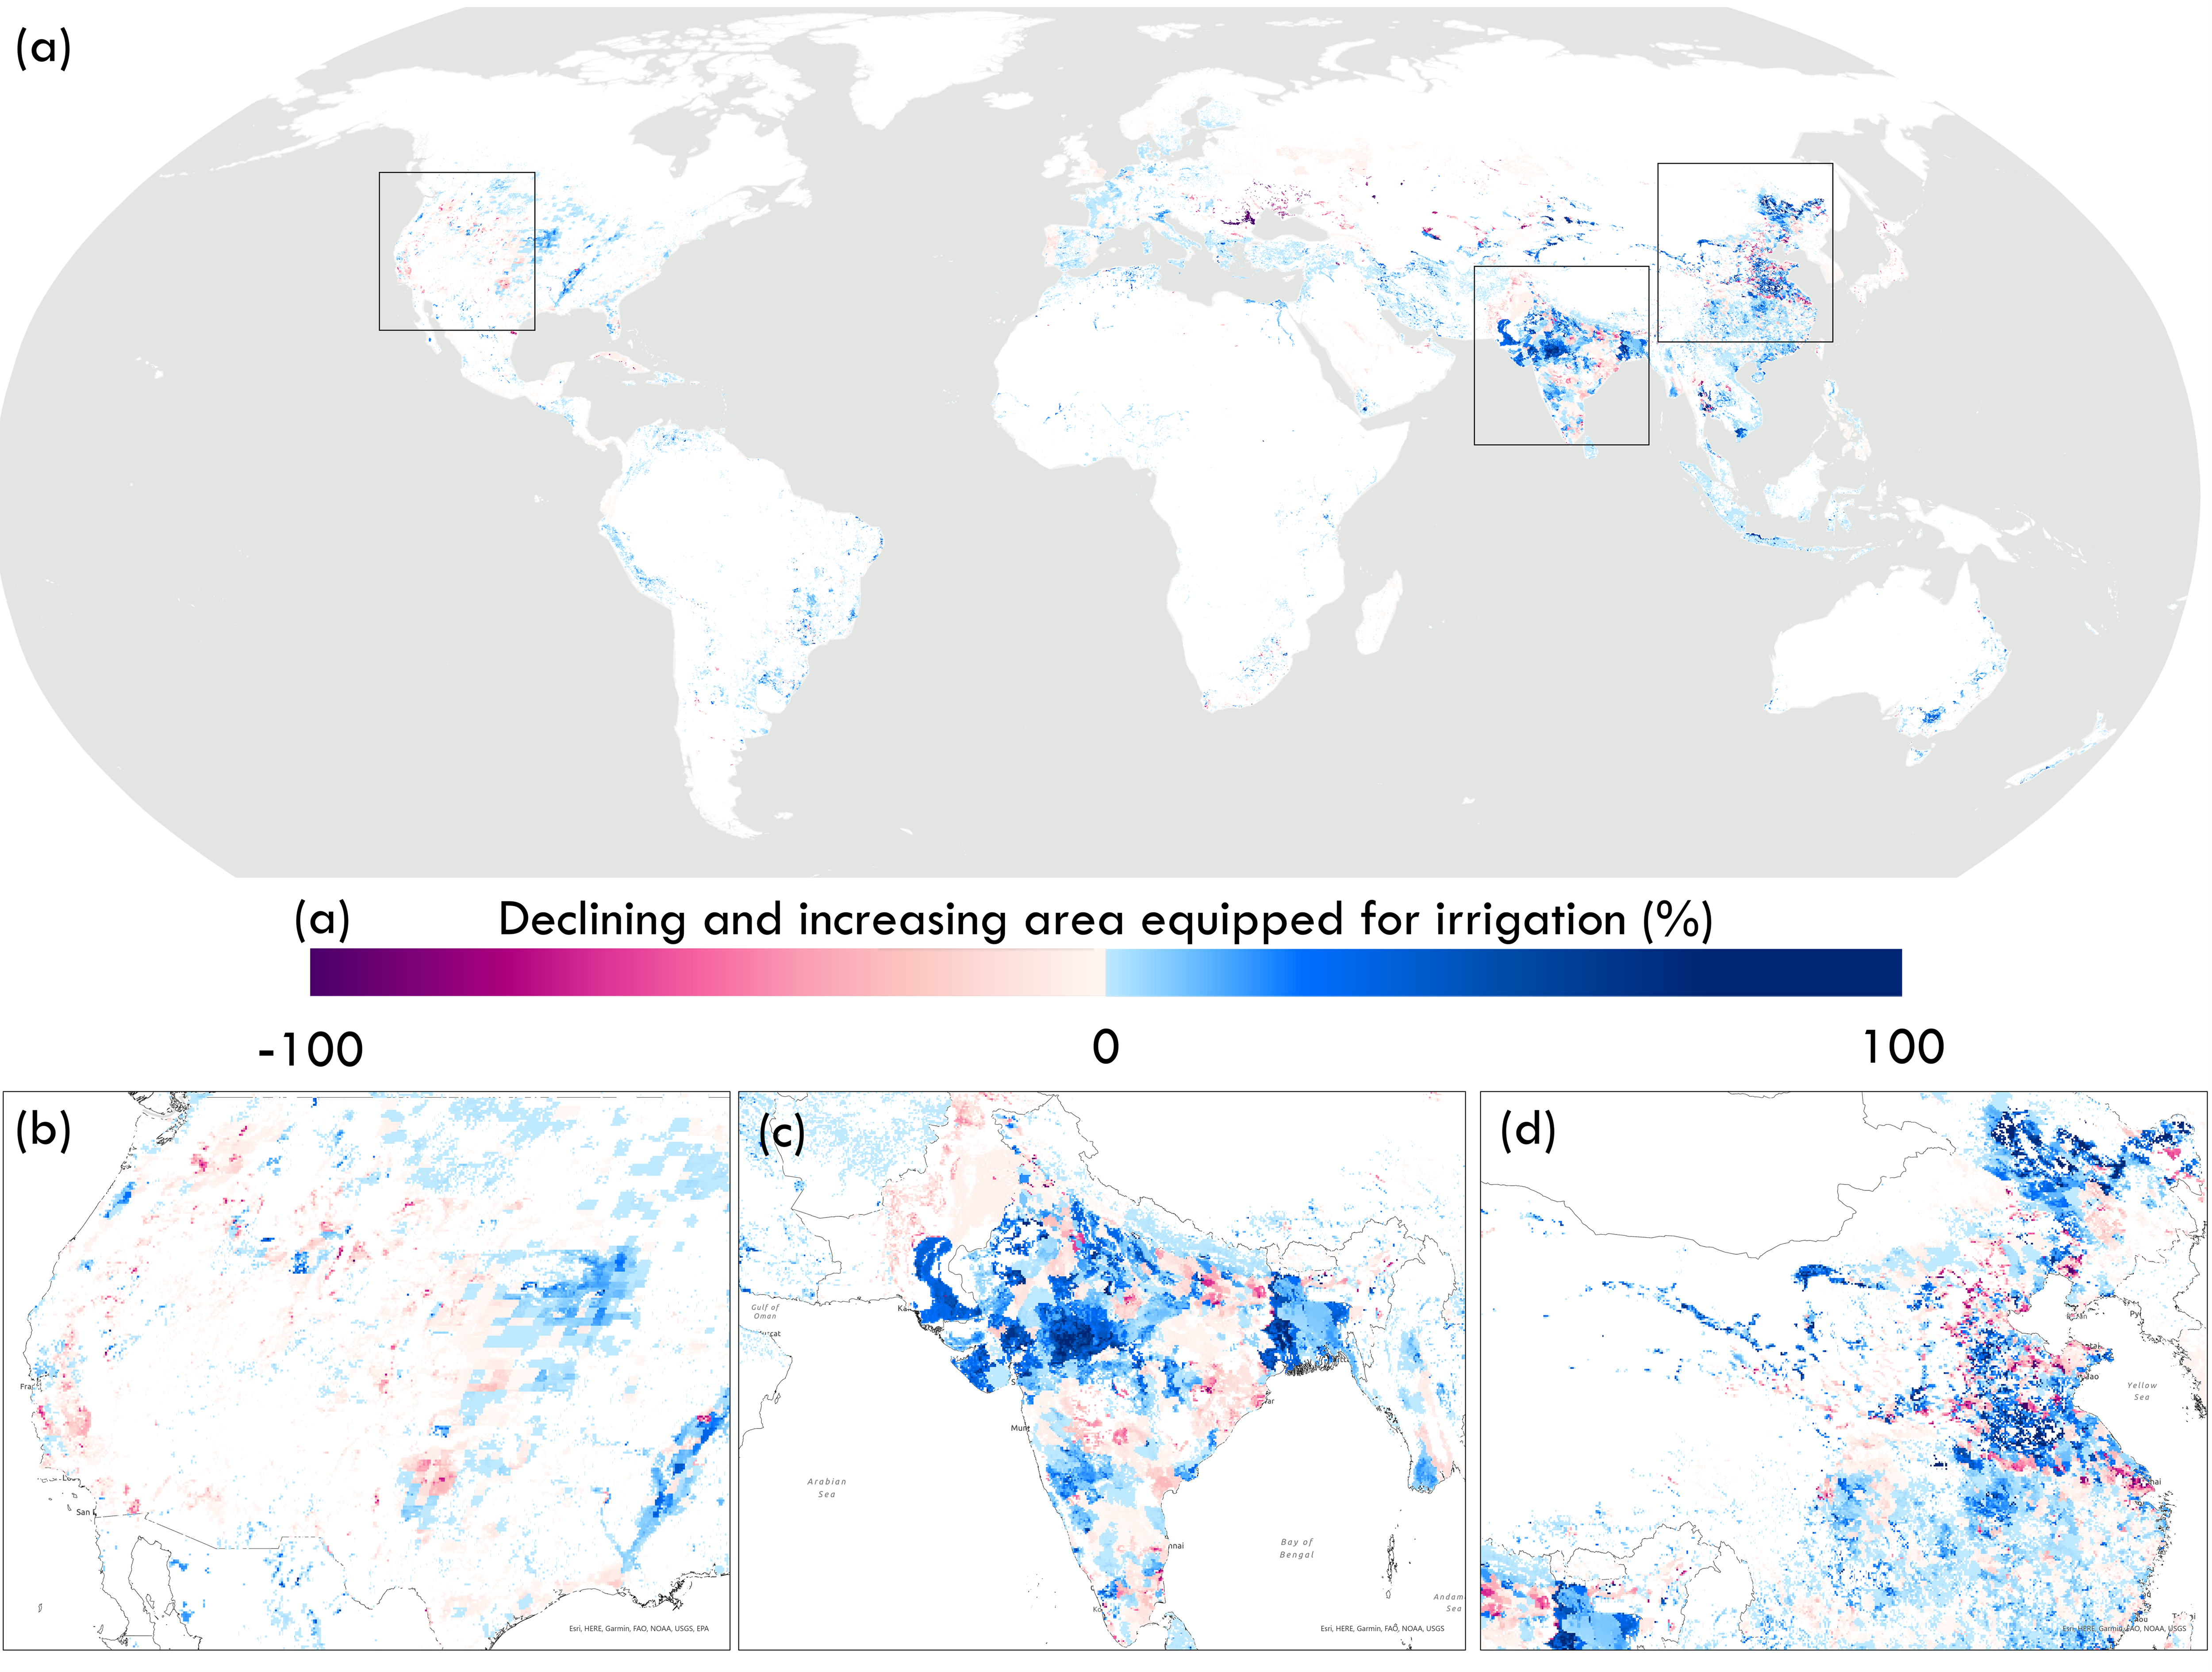
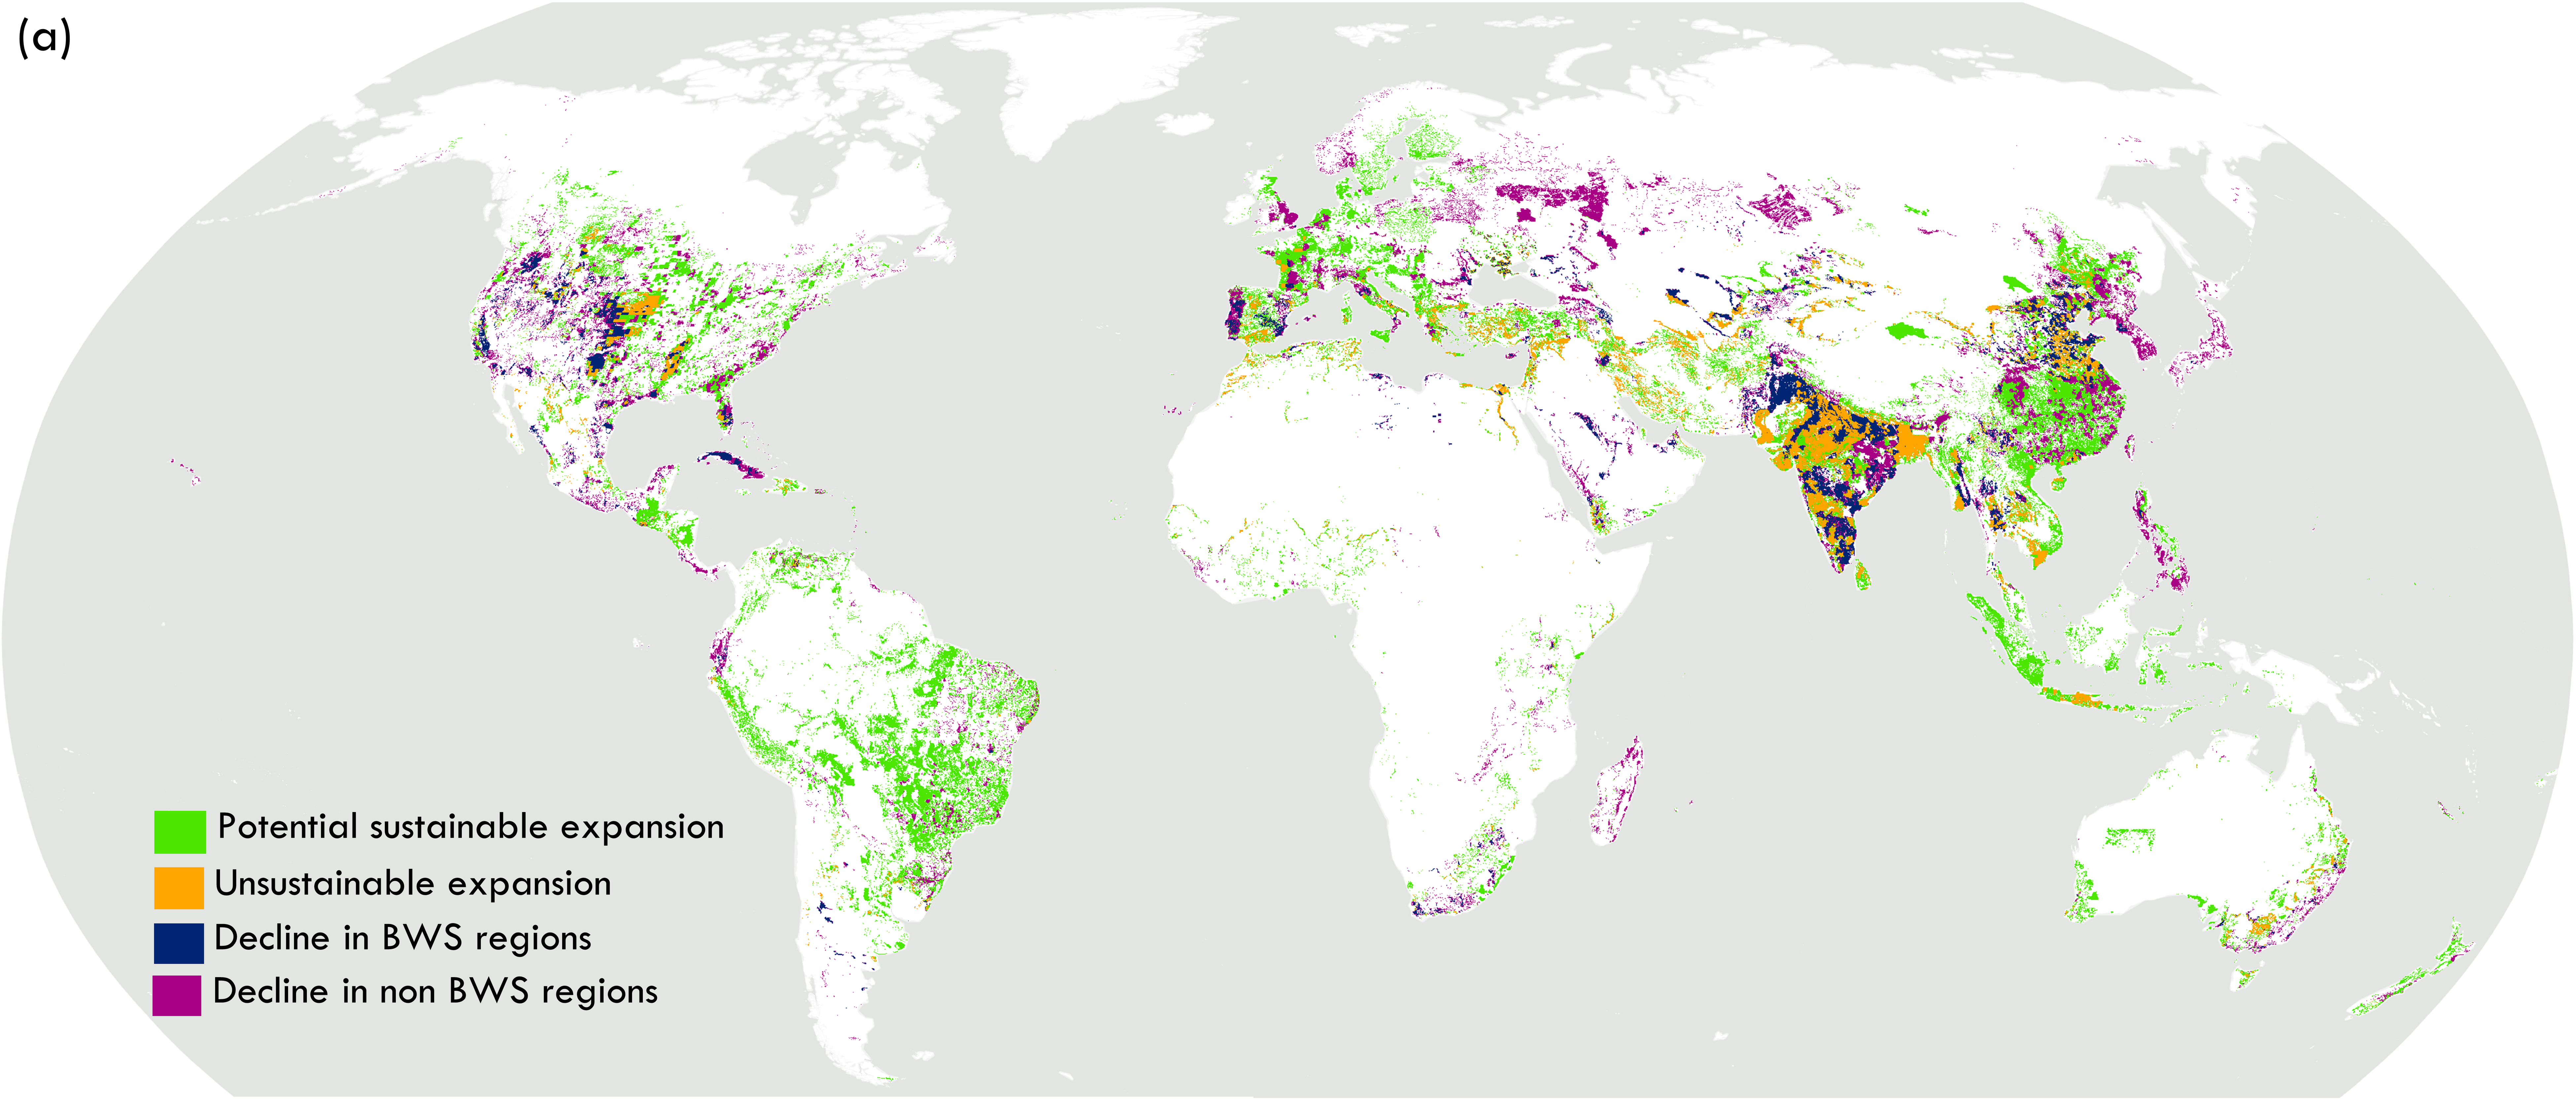
The analysis reveals that AEI increased by 11% from 2000 (297 Mha) to 2015 (330 Mha). This growth includes major expansions in regions like northwest India and northeast China, as well as declines in countries such as Russia. Combining these outputs with information on green (that is, rainfall) and blue (that is, surface and ground) water stress, the study also examined to what extent irrigation has expanded unsustainably in places already experiencing water stress. The results show that over half (52%) of the irrigation expansion has taken place in areas that were already water-stressed in the year 2000, with India alone accounting for 36% of global unsustainable expansion. These findings provide new insights into the evolving patterns of global irrigation with important implications for global water sustainability and food security.
Using Area Equipped for Irrigation (AEI) in your Maps
Beyond visualization, the layer allows you to explore the patterns of water stress over time, and alongside other datasets within your projects.
Compare
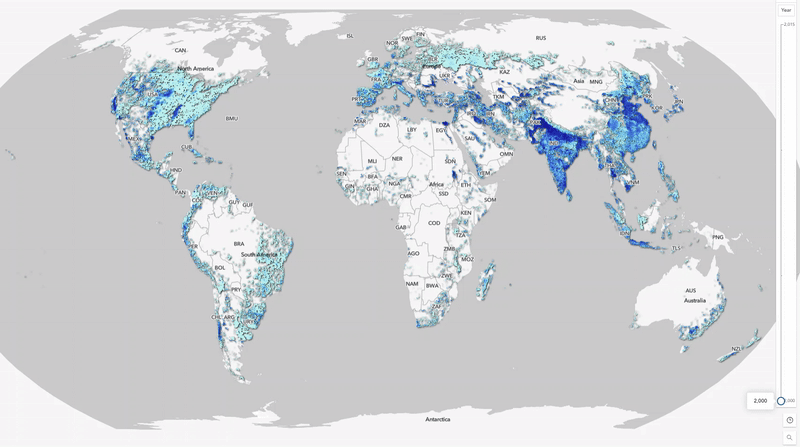
Using the multidimensional slices, compare how the patterns change between 2000, 2005, 2010, and 2015 within ArcGIS Pro or ArcGIS Online:
Overlay
Utilize Effects in ArcGIS Online and related datasets such as the Crops processing template of Sentinel-2 Land Cover from Living Atlas to show where crops align with water usage:
Analyze
Use the Zonal Statistics tool in ArcGIS Pro or ArcGIS Online to summarize irrigation by administrative boundaries. This allows you to quantify the change in irrigated area between 2000 and 2015 for each country.
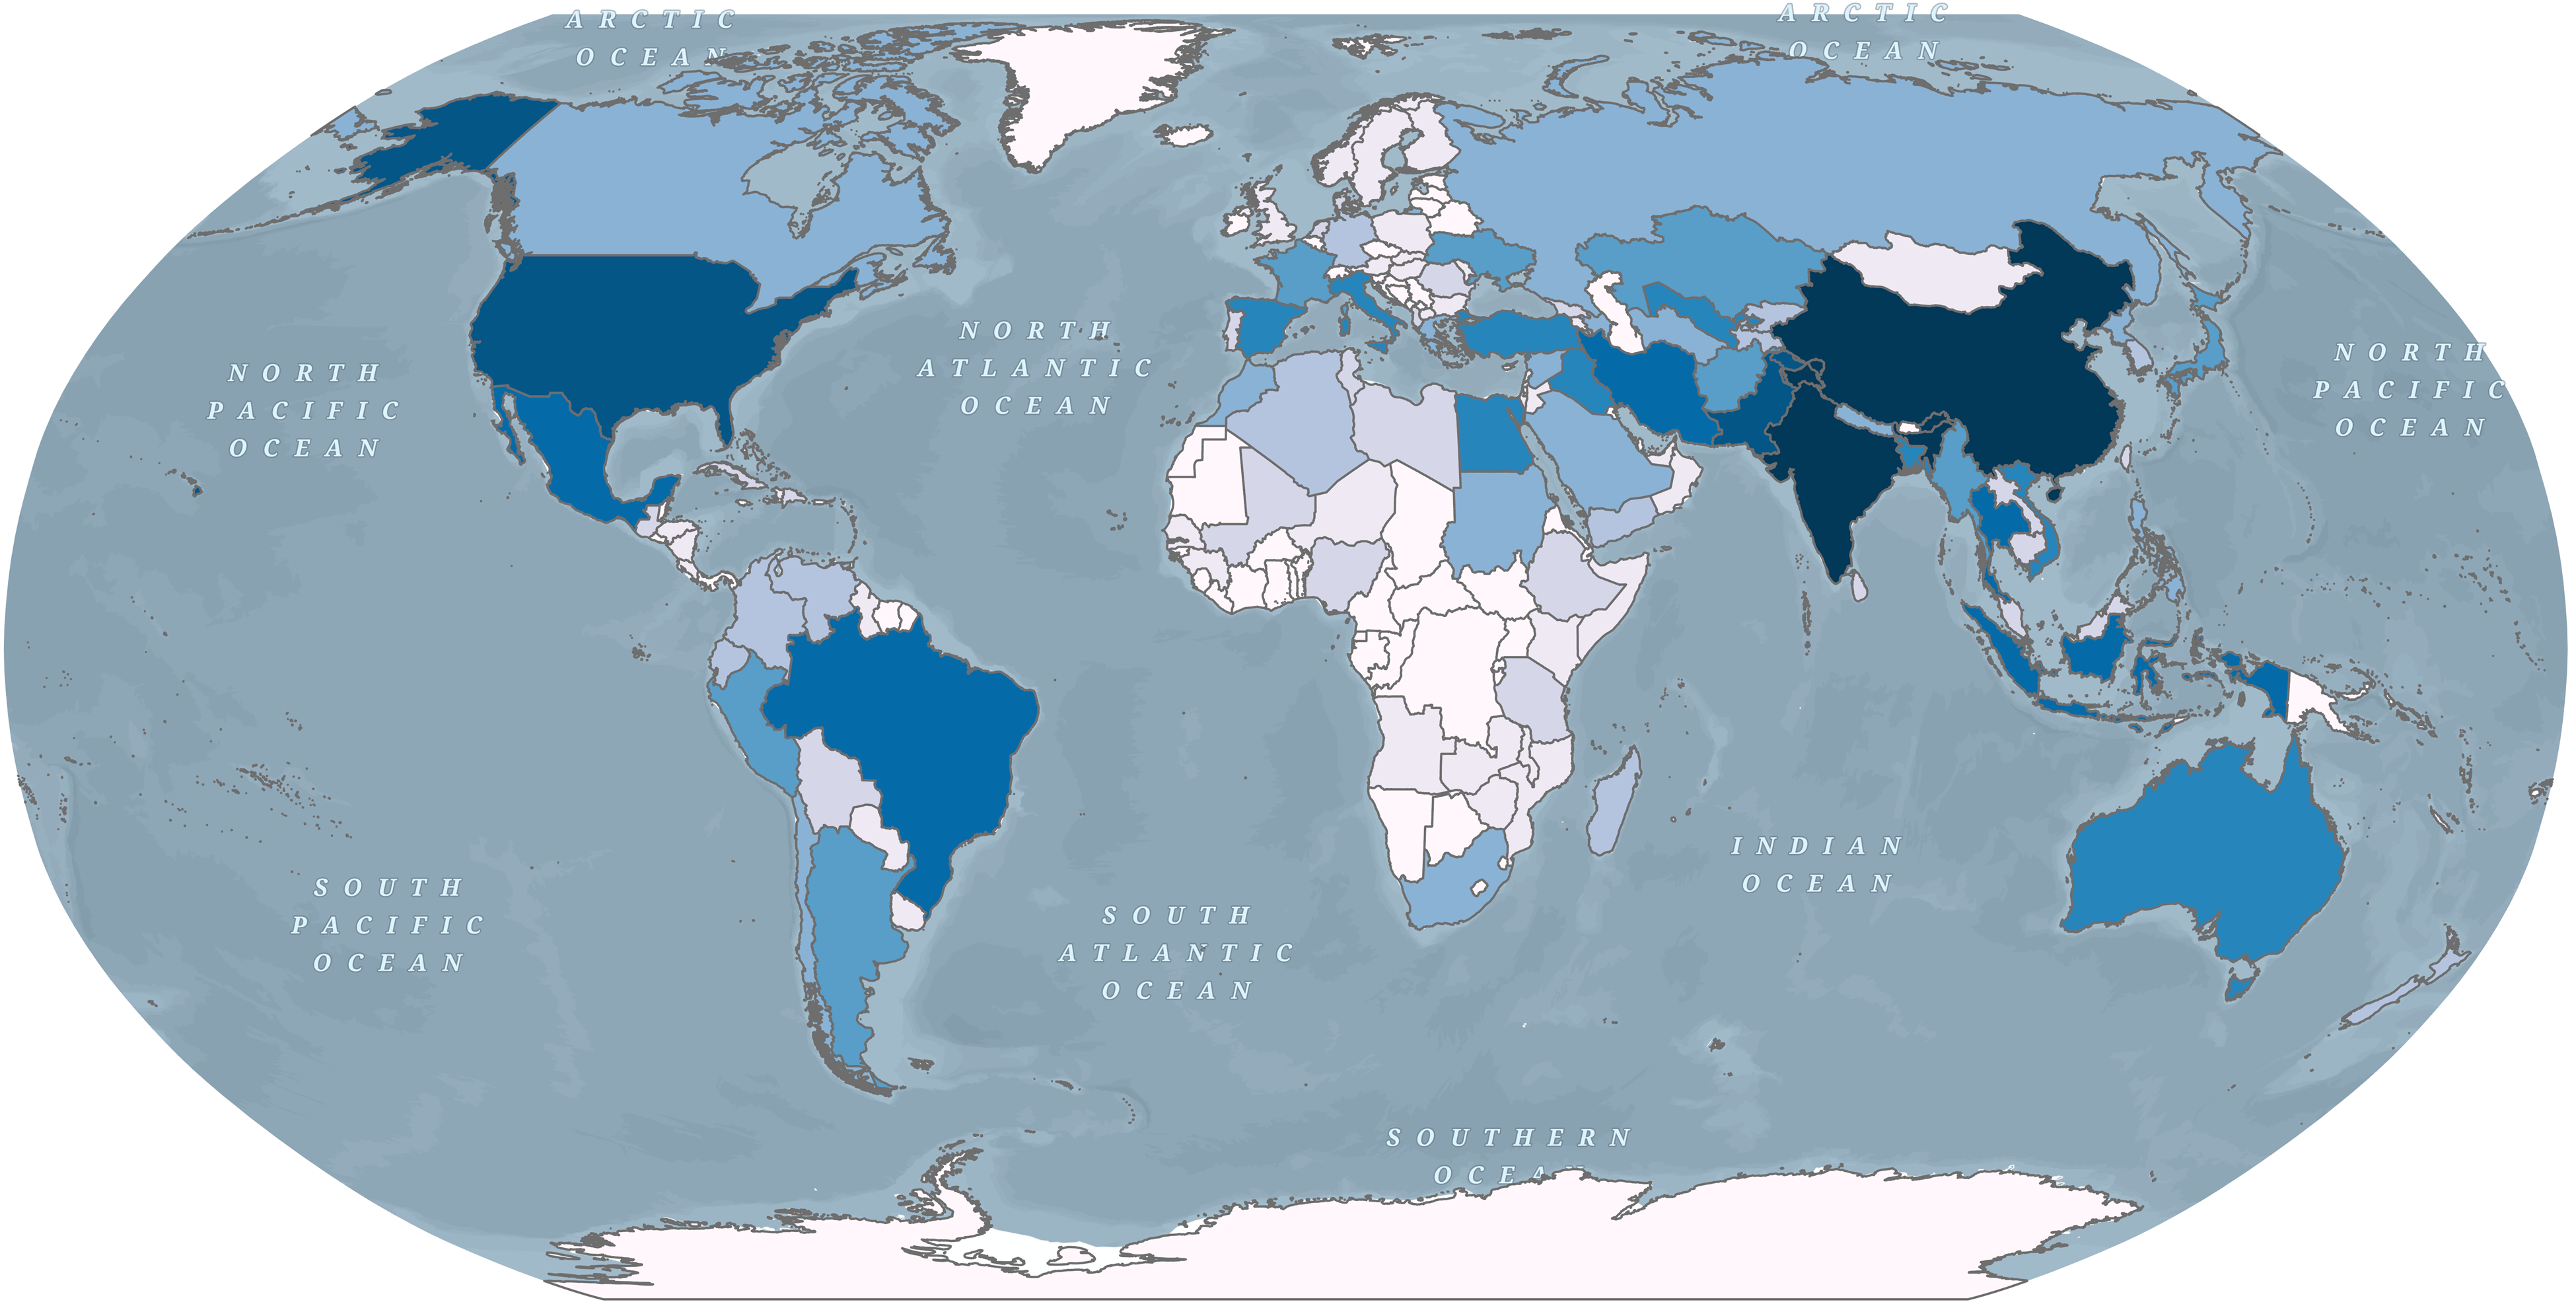
Combine this layer with global water scarcity datasets (like Blue Water Scarcity and Green Water Scarcity) to assess the sustainability of irrigation expansion and map potential sustainable and unsustainable irrigation areas. You can identify regions where irrigation has expanded into already water-stressed areas (see more on an upcoming blog).
Final Thoughts
Use this layer within your analysis today by easily accessing the layer throughout ArcGIS from Living Atlas. The item can be added into your new and existing maps within ArcGIS Pro, ArcGIS Online, among other places where layers can be added to your work.
_________________________________
Citation:
Mehta, P., Siebert, S., Kummu, M. et al. Half of twenty-first century global irrigation expansion has been in water-stressed regions. Nature Water 2, 254–261 (2024). https://doi.org/10.1038/s44221-024-00206-9
Source: Zenodo


Great read!
The Global Irrigated Area layer is incredibly helpful for visualizing how irrigation has evolved over time and its impact on freshwater stress. The ability to compare AEI changes from 2000–2015 and combine this layer with water scarcity datasets adds powerful context for sustainability analysis. It’s especially interesting (and concerning) that more than half of irrigation expansion occurred in already water-stressed regions.
I’m curious—do you see future versions of this layer incorporating predictive modeling to forecast where irrigation pressure may shift next? Also, could integrating socio-economic factors (like population growth or agricultural demand) improve sustainability assessments?
This resource will definitely support better planning in agriculture and water management. Thanks for sharing!