Around this time last year, ArcGIS Living Atlas introduced two new electricity demand and generation layers sourced from the U.S. Energy Information Administration (EIA). These layers provide near real-time insight into electricity activity across the United States using data reported by balancing authorities through EIA’s Hourly Electric Grid Monitor and Open Data API.
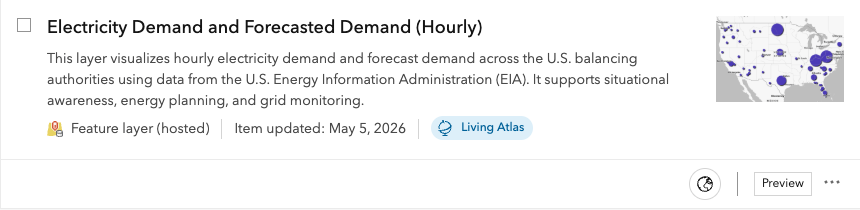
The Electricity Demand and Forecasted Demand layer updates hourly and provides near real-time visibility into electricity demand and forecasted demand across the nation. A companion view layer containing the most recent three hours of data makes it easy to support operational dashboards, monitoring applications, and short-term trend analysis.
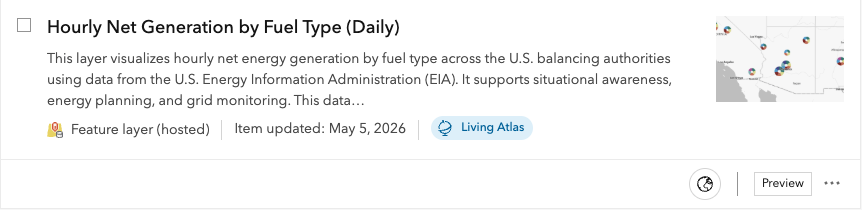
The Hourly Net Generation by Fuel Type layer provides hourly electricity generation by fuel source, including natural gas, coal, hydroelectric, wind, solar, and other reported resources. This dataset is updated daily and is also available as a view containing the most recent three days of observations.
New Energy Summary Layers
Two new summary layers are now available in ArcGIS Living Atlas:
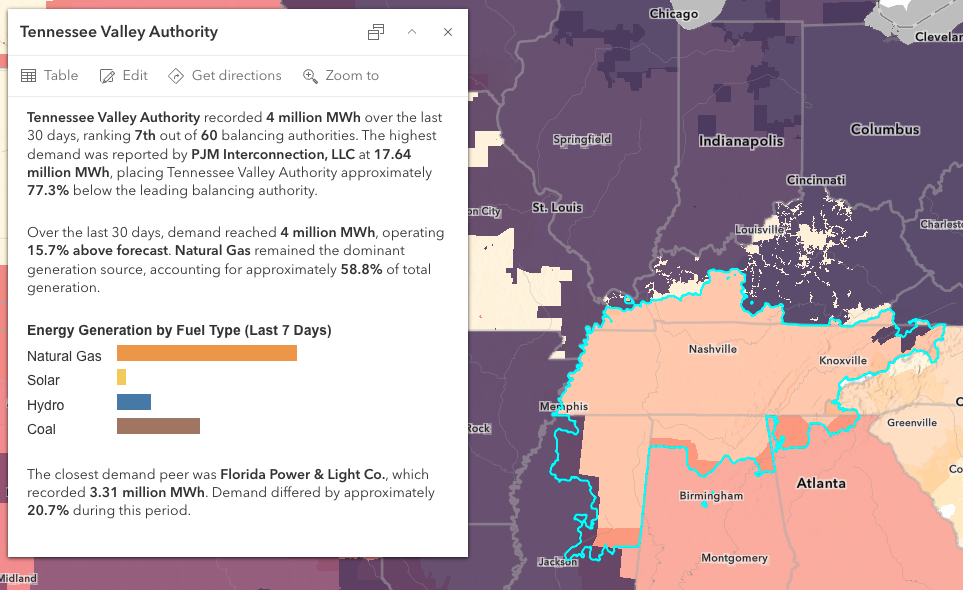
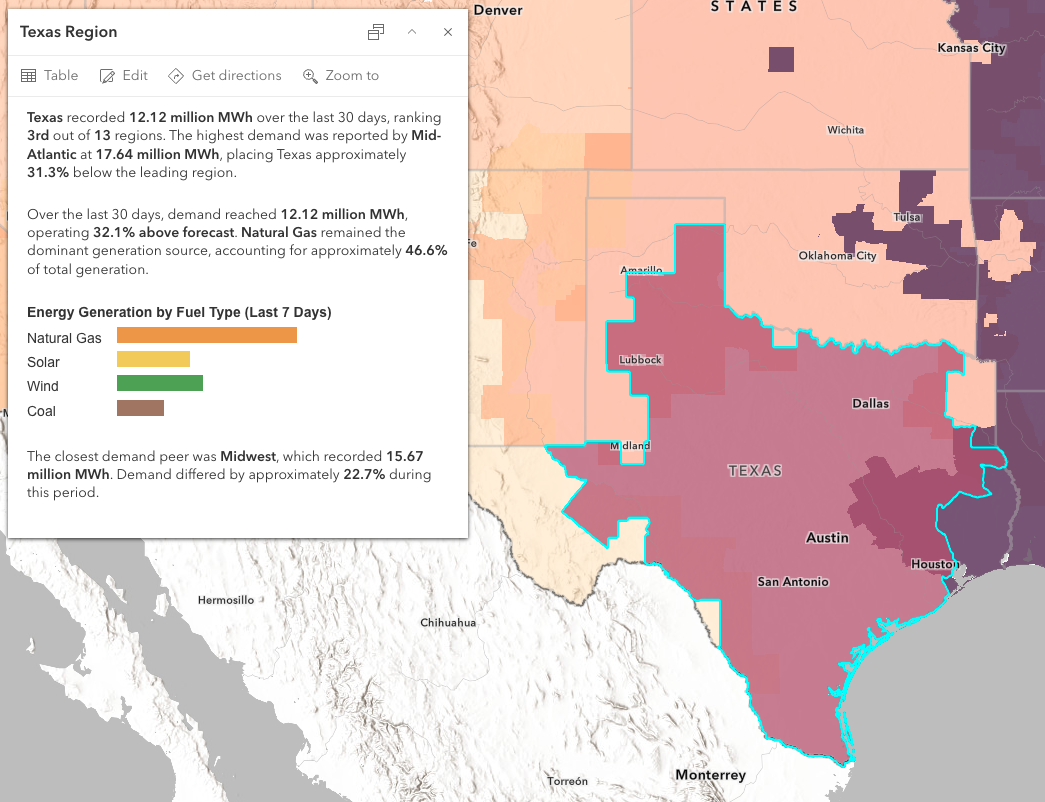
Instead of working directly with hourly observations, users can immediately explore rolling demand, forecast demand, and fuel-specific generation summaries at both the balancing authority and regional scale.
These layers are derived from the existing Electricity Demand and Forecasted Demand and Hourly Net Generation by Fuel Type layers already available in ArcGIS Living Atlas. Rather than pulling additional records from EIA, the summary layers aggregate values from those layers into rolling 7-, 30-, 90-, and 180-day periods, making it easier to compare recent and longer-term energy patterns.
The layers contain the same demand, forecast, and generation summaries but are available at two geographic levels. The Balancing Authority Energy Summary layer supports analysis of individual balancing authorities, while the Regional Energy Summary layer aggregates those values into larger EIA reporting regions for broader comparisons across the United States.
Questions that can be explored include:
- Which areas reported the highest electricity demand?
- How did actual demand compare to forecasted demand?
- Which fuel sources supplied the largest share of electricity generation?
- How do demand and generation patterns vary across different parts of the country?
- Which balancing authorities or regions share similar demand characteristics?
Multi-Scale Energy Analysis
Together, the hourly, daily, and summary layers provide a multi-scale view of electricity activity across the United States. Users can move from individual demand and generation observations to broader trends across balancing authorities and EIA regions.
For example, users can:
- Monitor recent changes in demand using the hourly demand layer.
- Examine hourly generation patterns by fuel type.
- Review recent demand and generation trends using balancing authority summaries.
- Compare broader patterns across EIA regions using the regional summary layer.
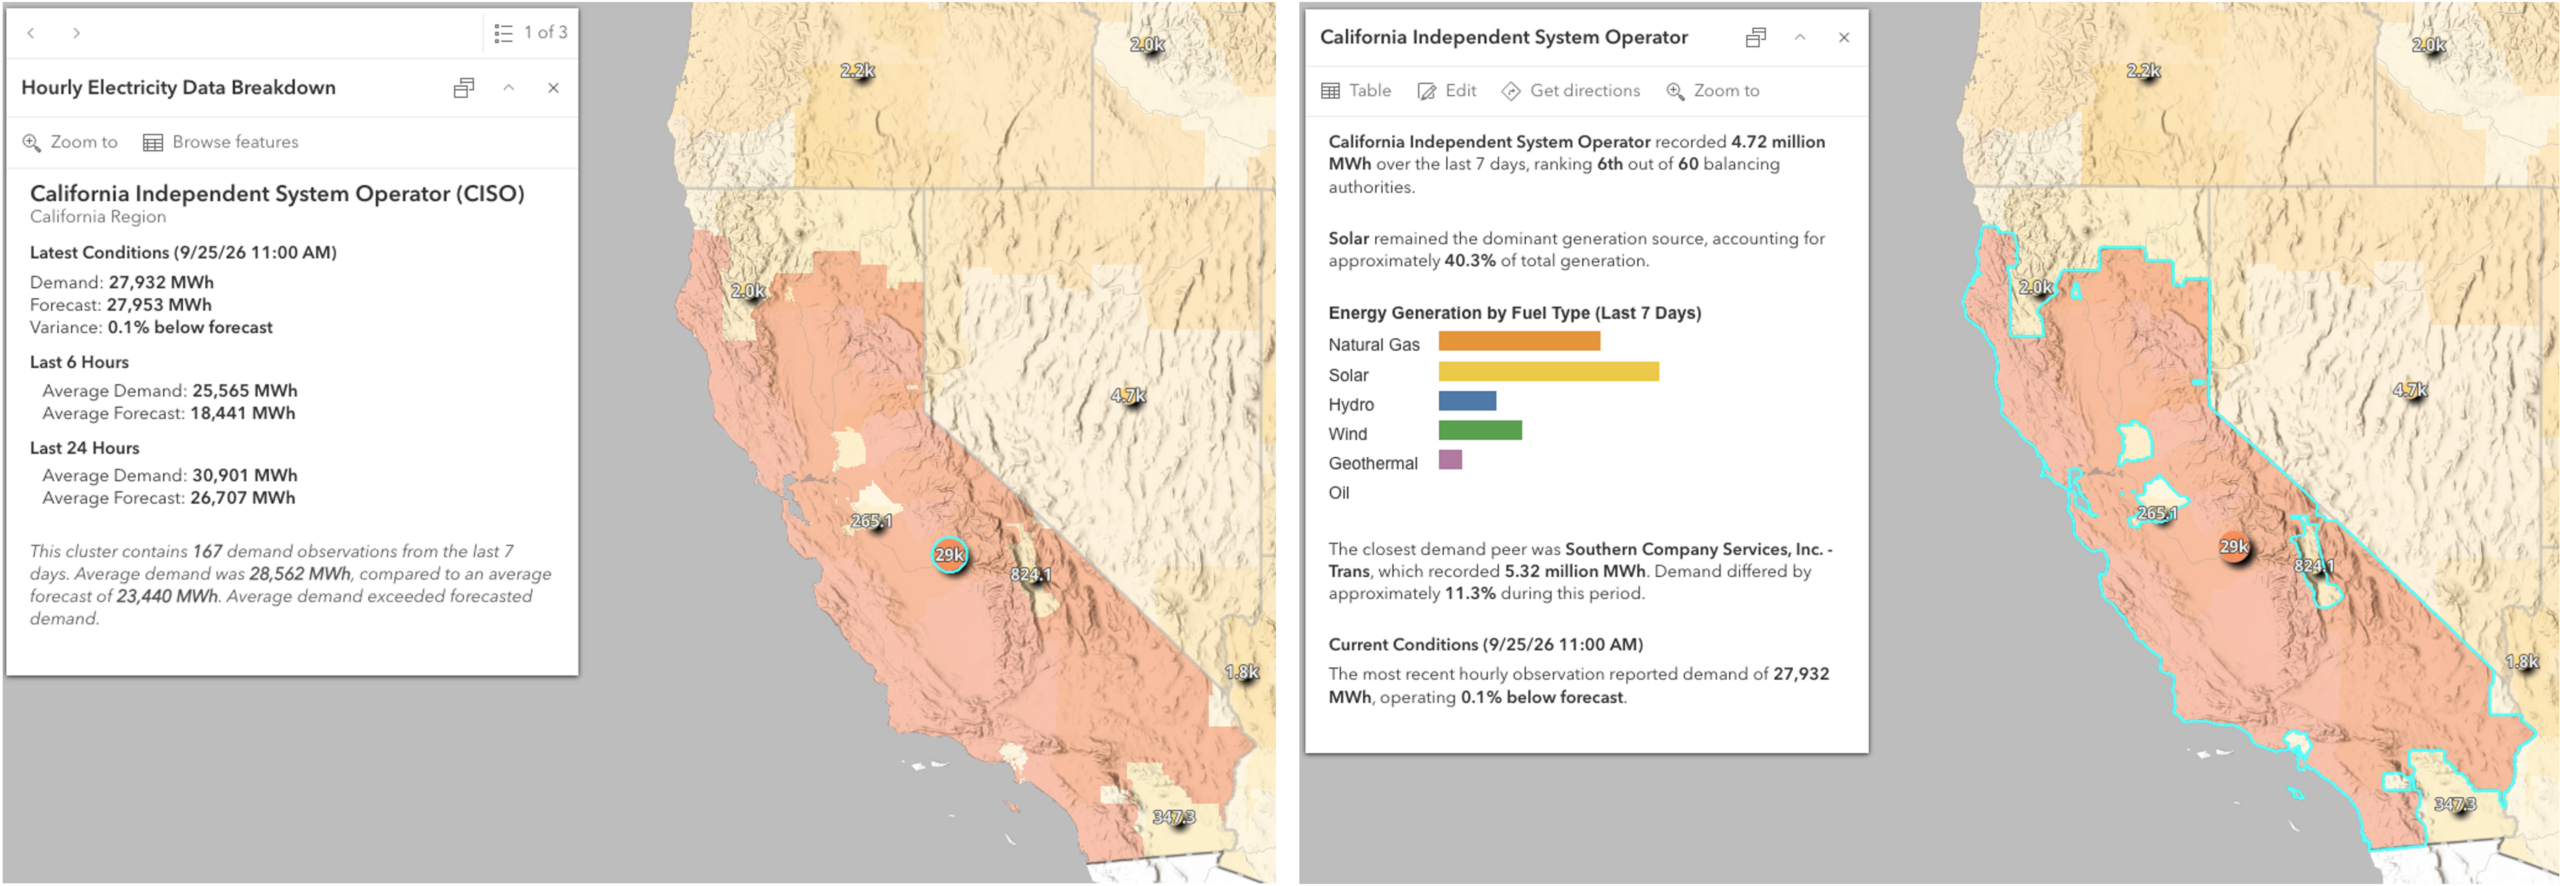
The map below is an example of combining the hourly electricity demand for each balancing authority with the summary layer, visualized to show the last 7 days worth of demand and generation by fuel type.
Explore U.S. Energy Patterns
Understanding how electricity is generated, distributed, and consumed is essential for modern energy planning. Balancing authorities play a critical role in managing electricity supply and demand across the grid, while regional summaries help reveal broader geographic patterns in energy use and generation.
Whether you’re monitoring recent grid activity, comparing regional generation portfolios, evaluating demand trends, or supporting planning initiatives, these new summary layers provide an accessible way to work with EIA-930 data in a spatial context.
When combined with infrastructure, renewable energy resources, weather information, demographics, and other spatial datasets, these layers can help analysts better understand how the electric grid is changing and where opportunities may exist to improve reliability, resilience, and efficiency.
Add these layers to your maps, dashboards, and applications and start exploring electricity demand and generation trends across the U.S. electric grid. For more energy-related content, visit ArcGIS Living Atlas.

Article Discussion: