We are pleased to announce that a new collection of selected demographic variables from WorldPop.org’s Global2 release is now available in the Living Atlas of the World as global extent imagery layers. WorldPop develops peer-reviewed methods and compiles open high-resolution geospatial global demographic data on population characteristics, demographics, and dynamics. Please refer to WorldPop.org blog introducing the Global2 dataset to learn more about the improvements in the Global2 datasets; also see WorldPop.org’s complete technical documentation.
Worldpop’s Global2 collection includes 100-meter and 1-kilometer resolution estimates and projections for global population for the years 2015 through 2030, segmented by 5-year age-and-sex cohorts. At Esri, we have derived the following collection of commonly used demographic variables from WorldPop’s 1-km resolution data for the years 2015, 2020, 2025, and 2030:
- Births (Ages 0-1)
- Children Under Age 5
- Children Under Age 15
- Females Ages 15 to 49
- Males Ages 15 to 49
- Population Ages 50 to 64
- Population Ages 65 and Older
- Total Male Population
- Total Female Population
- Total Population
For the years 2015 and 2020, the layers are based on modeled statistical data, such as national censuses, while for 2025 and 2030 are projections of future populations.
How to Access these Layers
We have shared these layers in an ArcGIS Online Group: WorldPop Global2 – Selected Demographic Variables. Anyone can join this group, which will make it easier to browse and add any of the 40 layers to your maps.
Example
To provide some idea of the value of having these layers in available in the Living Atlas of the World, we performed an analysis that used all forty layers to produce this table of summaries.

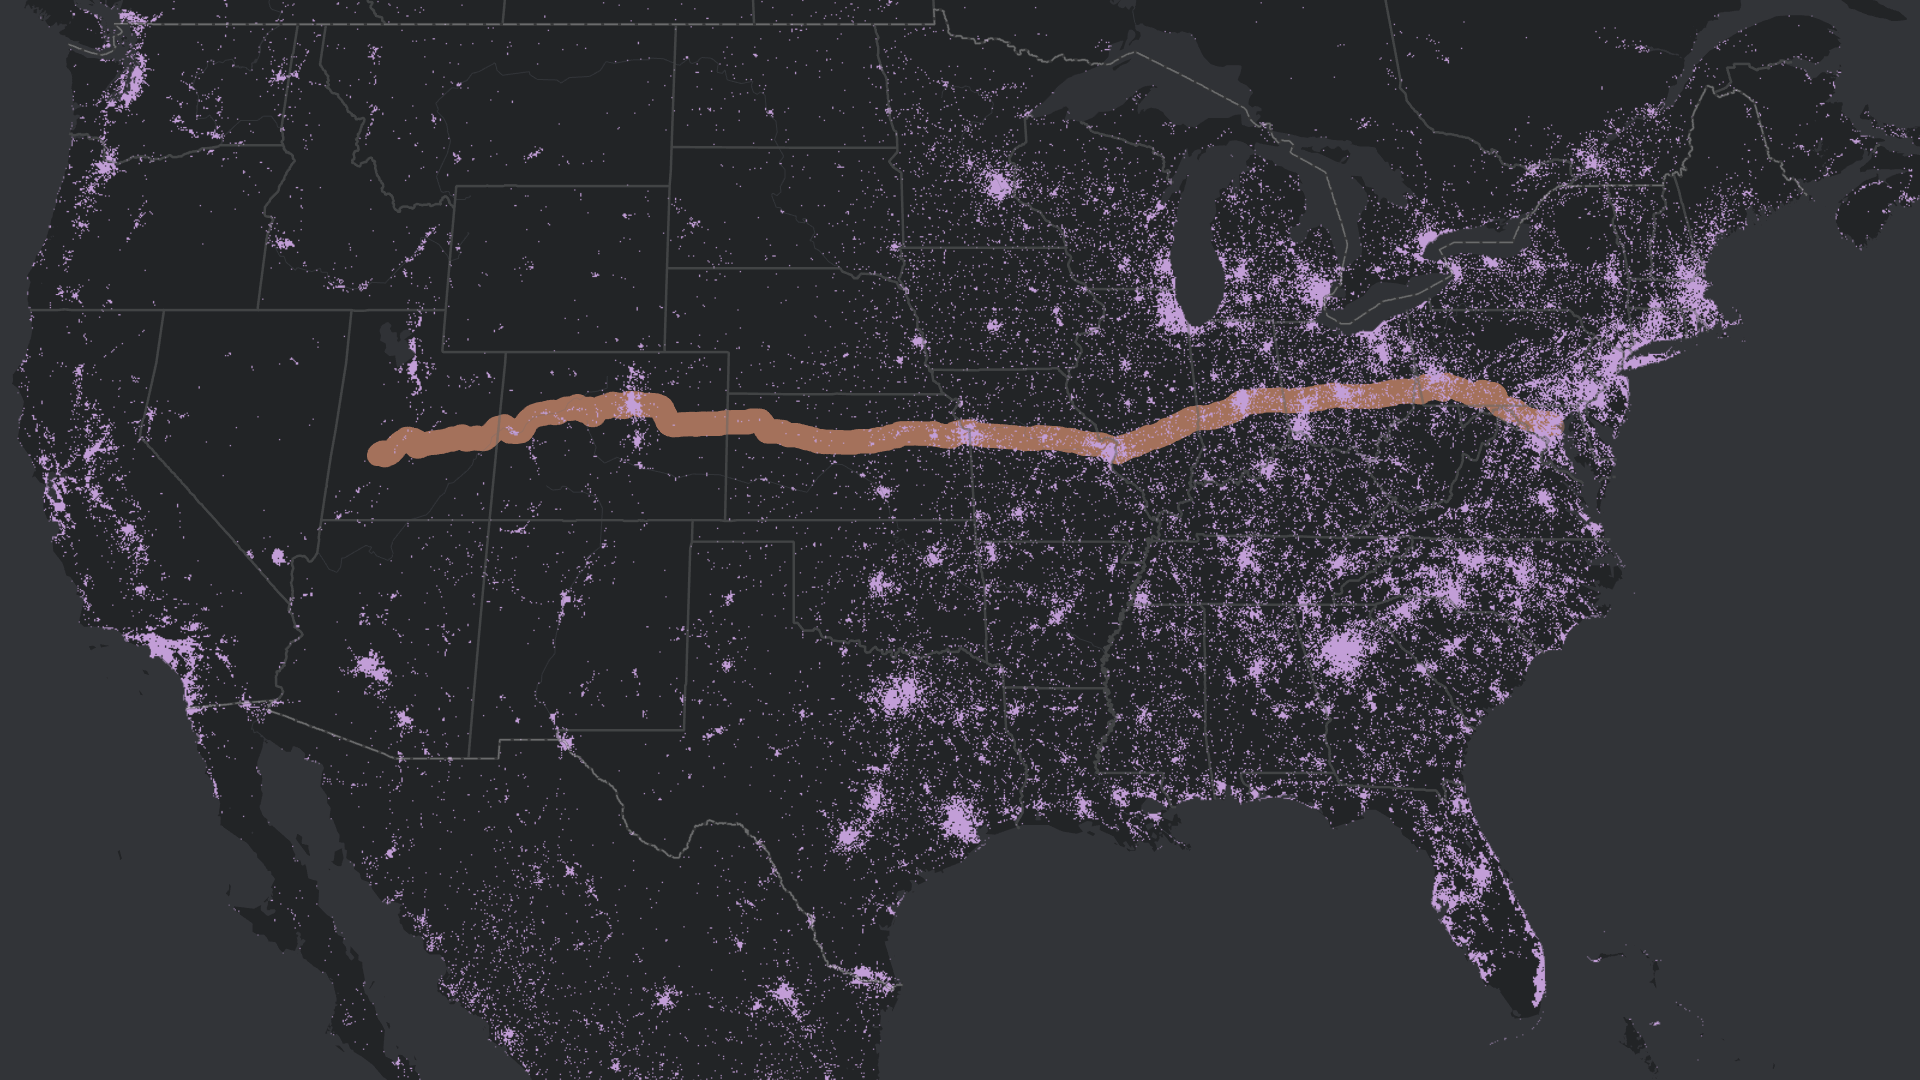
For those not familiar with Interstate 70, it is a highway that runs 2,153 miles (3,465, km) from Baltimore, Maryland to southwestern Utah. The results are interesting, showing a general trends of a lowering rate of natural increase, in-migration of adults, and people living longer past the age of 65.
We produced these summaries in just under 25 minutes using the following steps in ArcGIS Pro:
- Added the Transportation (Roads and Railroads) layer from the Living Atlas, and from the Primary_Roads_Interstates_5M_scale sub-layer selected by attribute NAME = ‘I- 70’.
- Used the Buffer tool with the selected roads to create a 20-mile buffer.
- Next, we added all forty of the New WorldPop layers to our map. To make that easier, we first joined the WorldPop Global2 – Selected Demographic Variables ArcGIS Online group, which allowed us to browse directly to these layers and select all of them in one step.
- Used the new Zonal Characterization tool with our Interstate 70 buffer as the Input Raster or Feature Zones; selected all of the WorldPop layers in the Table of Contents and dragged them into the Input Value Rasters section, and set the Statistics type to Sum. This produces a table with fields containing the sums of all forty variables.
- Copied the output table cells into a spreadsheet and formatted the results to appear as they do in the above image.
When doing this type of analysis, we recommend using zones of at least 50 kilometers in size to reduce the potential for each 1-km cell’s margin of error to skew results. It is also important to perform the analysis in the coordinate system of the WorldPop Global2 layers, which is WGS 1984.

Article Discussion: