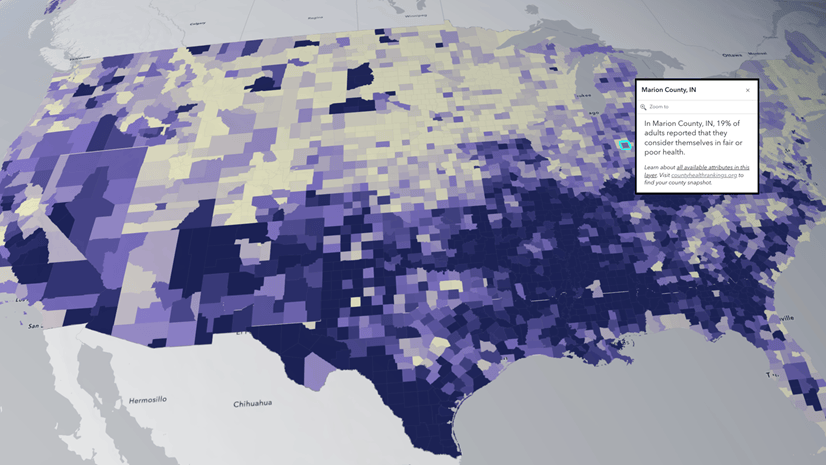
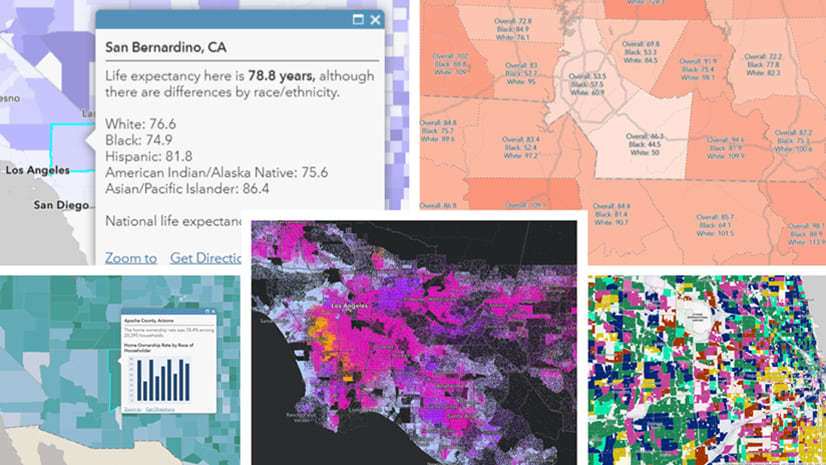
The big “Why?” for many GIS analysts is that maps can inform how to make our communities better and healthier. A dataset often used to understand community health is the County Health Rankings & Roadmaps Annual Data Release. The County Health Rankings and Roadmaps (CHR&R), a program of the University of Wisconsin Population Health Institute, measures the health of individuals and communities for nearly all counties in the nation. Their annual dataset is compiled using county-level measures from many national and state data sources.
We are happy to announce that the 2025 feature layer is now available in ArcGIS Living Atlas. This multi-scale layer contains data for counties, states, and the nation.
New Measures in the 2025 Annual Data Release
This year’s data release comes with many new measures.
- % Disability: Functional Limitations
- Feelings of Loneliness
- Lack of Social and Emotional Support
- Library Access
- Access to Parks
- Adverse Climate Events
For more details, see the layer’s Description, as well as the field aliases and long field descriptions for each attribute. This brings the incredible documentation from CHR&R right to GIS analysts where they’re working in the Map Viewer.
For example, click on the “i” information button and you can see how library access is measured and quantified:
: 2022.")
Other Changes for 2025
- CHR&R introduced a new model of health, which broadens our understanding of the forces shaping community conditions like income, safe housing, and well-resourced schools.
- All CHR&R measures are mapped to the new model and counties are assigned to Health Groups, which are calculated for Population Health & Well-being and Community Conditions using weights applied to the new model. Visit the Explore health topics page on the CHR&R website to explore the new model.
- Data for the nine new planning regions in Connecticut are provided in this dataset as available. Snapshots for both the former Connecticut counties and the new Connecticut planning regions are available on the CHR&R website. To read more about CHR&R methods for Connecticut data visit the Changes to county-equivalents for Connecticut page on the CHR&R website.
To learn more about the 2025 Data Release, read this blog on the CHR&R website. The 2025 County Health Rankings layer is the latest item that is part of a growing set of CHR&R content in Living Atlas.
Measure Change Over Time
This popular dataset has became a staple in Living Atlas over the years. A new vintage has been added every year since 2018. This means that GIS analysts now have seven years of data available in Living Atlas for use in their work, and even more years are available on the CHR&R website. CHR&R provides resources and guidance about measuring progress and change, and examples of how it can take time for interventions to move the needle and show up in the data.
The County Snapshots they provide have a red-yellow-and-green color system to show when counties are trending for the better. It’s gratifying to see when your county is trending for the better, as San Bernardino County is in some important Health Infrastructure measures:
, whereas primary care physicians, dentists, preventable hospital stays, and uninsured are trending \"for the better\" (shown by the green trendline symbol).")
The annual data release provides a revealing snapshot of how health is influenced by where we live, learn, work, and play. The snapshots provide communities a starting point to investigate where to make change.
Visualizing and Analyzing Change Over Time
There are many ways to visualize and analyze change over time in ArcGIS.
- A swipe experience using the Media Map Instant App is a great way to allow your audience to interact with your maps and compare two web maps of the same area. Use the same color ramps and the same breakpoints for the symbology in both maps to make the comparison effective.
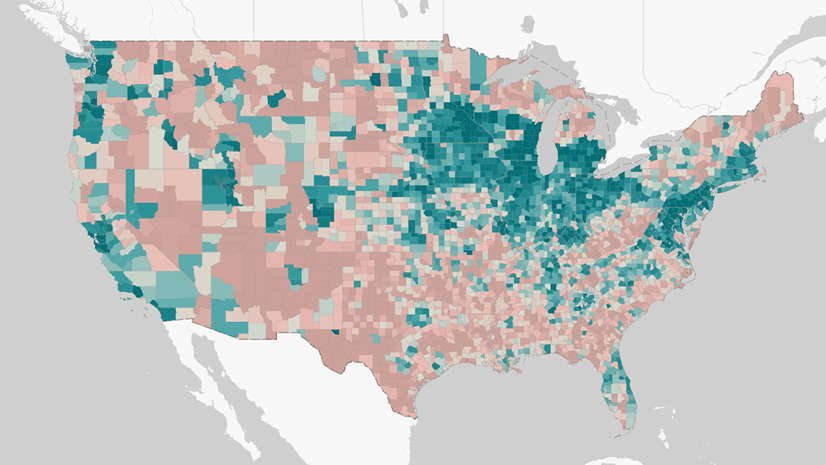
- Join two vintages together and calculate the change from one year to another, and symbolize on the change itself. Use the “above and below” theme centered on zero to visualize increases vs. decreases.
- Bring the full time series of data points into one layer, and configure line charts, either in the pop-up or in charts in Map Viewer. This can be a great way to show a trend line.
- Use ArcGIS Pro to create a space-time-cube layer using defined locations (counties). Choose a particular attribute of interest and visualize ten years of CHR&R data together. All years of CHR&R data are available for download on the Data & Documentation page.
- Determine statistical significance of change over time by adding in the confidence intervals available in the analytic file from CHR&R.
More Resources
CHR&R published their 2025 Report: Building Power for Health and Equity as an inspiring ArcGIS Story Map. It reminds us that it’s possible to build community power.
CHR&R offers so many useful reports, webinars, podcasts, and many other resources. My personal favorite is the Curated Strategy List that detail evidence-informed programs, policies, and systems changes that can help address the complex challenges that communities are facing. The Evidence & Policy Analysis team at CHR&R has classified more than 400 strategies into an Evidence Rating that ranges from Scientifically Supported, to Some Evidence, to even Evidence of Ineffectiveness. Peruse these strategies and their ratings to get ideas for ways to improve the health of your community.
County Health Rankings & Roadmaps Content is Here to Support Your GIS work
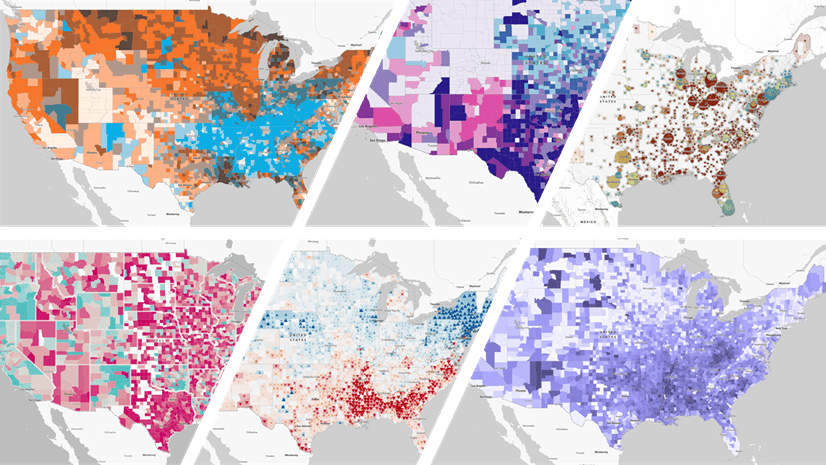
All these layers and maps are available to the ArcGIS community. As with all feature layers in Living Atlas, you can add this year’s layer to a new map and create a map that meets your needs. Smoking, flu vaccinations, mammogram screenings, low birth weight, and physical inactivity are just a few of the many attributes available for you to symbolize.
Once you’ve configured your map, add it into an Instant App, Dashboard, or Story Map to create an informative mapping product that is presented with your organization’s desired additional context.
Or, open this layer in your ArcGIS Pro Project. You can include it into your spatial analysis using the many geoprocessing tools available, or create a professional map layout for your organization.
Post in Esri Community’s ArcGIS Living Atlas space to ask other GIS practitioners questions, and share your work. If you will be attending this year’s User Conference in San Diego, register for the Equity and Social Justice SIG (Special Interest Group) session on Wednesday.
Maps are a compelling, visual way to use data to answer questions about communities. What insights will you uncover to make your community a better and healthier place?
Call to Action: Share How You Use CHR&R Data
Take a short survey to document your use-cases for this comprehensive dataset. Sharing your work can help secure funding for this valuable program of the University of Wisconsin Population Health Institute.

Article Discussion: