Floods are among the world’s most destructive natural hazards, making timely and reliable flood mapping essential for emergency response, damage assessment, and recovery planning. Because severe weather often limits the availability of cloud-free optical imagery, Synthetic Aperture Radar (SAR) has become a key technology for operational flood monitoring. Unlike optical sensors, SAR can acquire imagery day or night and through clouds, making Sentinel-1 SAR imagery an important data source for monitoring flood events.
Building an operational flood-monitoring workflow involves more than comparing two SAR images. Analysts must identify compatible pre- and post-flood acquisitions, account for acquisition geometry, manage multiple scenes covering the Area of Interest (AOI), and balance processing efficiency with cloud computing costs. These design decisions directly influence the reliability, reproducibility, and scalability of the final flood products.
This Python notebook, Automated Flood Monitoring with Sentinel-1 RTC Imagery, demonstrates how to implement an automated flood-monitoring workflow using ready-to-use Sentinel-1 Radiometrically Terrain Corrected (RTC) analysis-optimized imagery layer from ArcGIS Living Atlas, ArcGIS API for Python, and raster analytics. This article focuses on the reasoning behind the key design decisions for the notebook, discusses the trade-offs involved, and highlights the practices that make the workflow dependable, scalable, and reusable for operational flood monitoring.
Using flooding associated with Tropical Cyclone Idai near Beira, Mozambique, as an example, the notebook automatically identifies compatible Sentinel-1 image pairs, generates SAR change products, derives flood thresholds, refines flood masks and publishes the results as hosted imagery layers in ArcGIS Online. The workflow is designed to be reusable. By updating the flood event name, monitoring period, and AOI, the same methodology can be applied to any flood event where and whenever Sentinel-1 imagery is available.
Table of Contents
- Step 1: Configure the Flood Event
- Step 2: Identify Compatible Image Pairs
- Step 3: Generate SAR Change Products
- Step 4: Detect Flooded Areas
- Step 5: Publish Flood Products
- Step 6: Review Results
- Extending the Workflow

Step 1: Configure the Flood Event
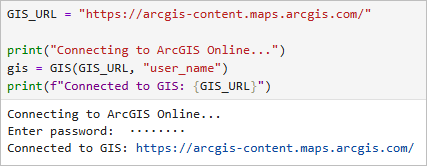
One design objective of this notebook is reusability. Rather than embedding event-specific values throughout the analysis, all configurable parameters are user-defined at the beginning of the workflow. This separation of configuration from processing logic makes it easy to apply the same methodology to different flood events without modifying the underlying code.
Connect to ArcGIS Online
Using analysis-ready imagery eliminates the need for local SAR preprocessing, allowing the notebook to focus on flood analysis rather than data preparation. Cloud-based processing also makes the workflow easier to scale from small study areas to larger operational analyses.
Define Flood Event Inputs and Processing Parameters
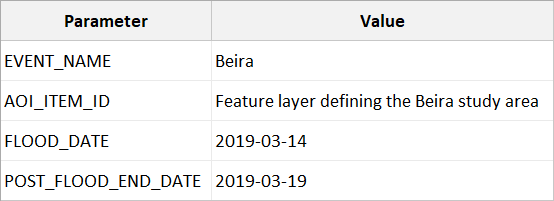
Every flood-monitoring workflow begins by defining the name, extent, and monitoring period for the flood event to be analyzed. Although this step requires only four user-defined inputs, those choices influence every subsequent stage of the workflow, including image selection, processing volume, and cloud computing costs. The notebook intentionally exposes only these high-level inputs so users can adapt the workflow to new flood events without modifying the processing logic. This design makes the workflow easier to maintain while encouraging consistent analyses across multiple events.
Flood event extent and monitoring period parameters involve practical trade-offs. Increasing the monitoring period may capture more of the flood’s evolution and a larger AOI provides broader geographic coverage. However, increasing the AOI extent or monitoring period increases the number of candidate images, which in turn increases processing time and ArcGIS Online credit consumption.
The example presented throughout this article uses flooding associated with Tropical Cyclone Idai near Beira, Mozambique, but these values simply configure the analysis. The underlying workflow remains unchanged.
Create a Project Folder
A dedicated ArcGIS Online project folder is created to organize intermediate and final outputs generated during the analysis. Keeping results grouped by flood event simplifies rerunning the workflow, comparing multiple events, and managing published imagery layers.
Load Sentinel-1 Imagery Layer and AOI
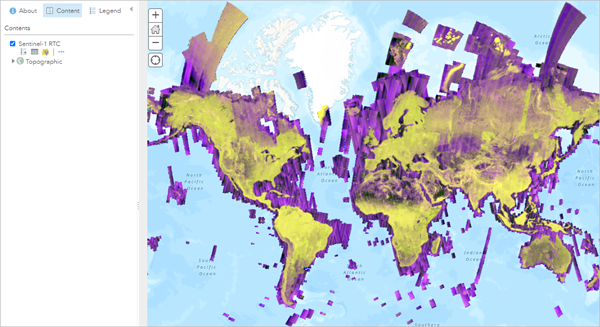
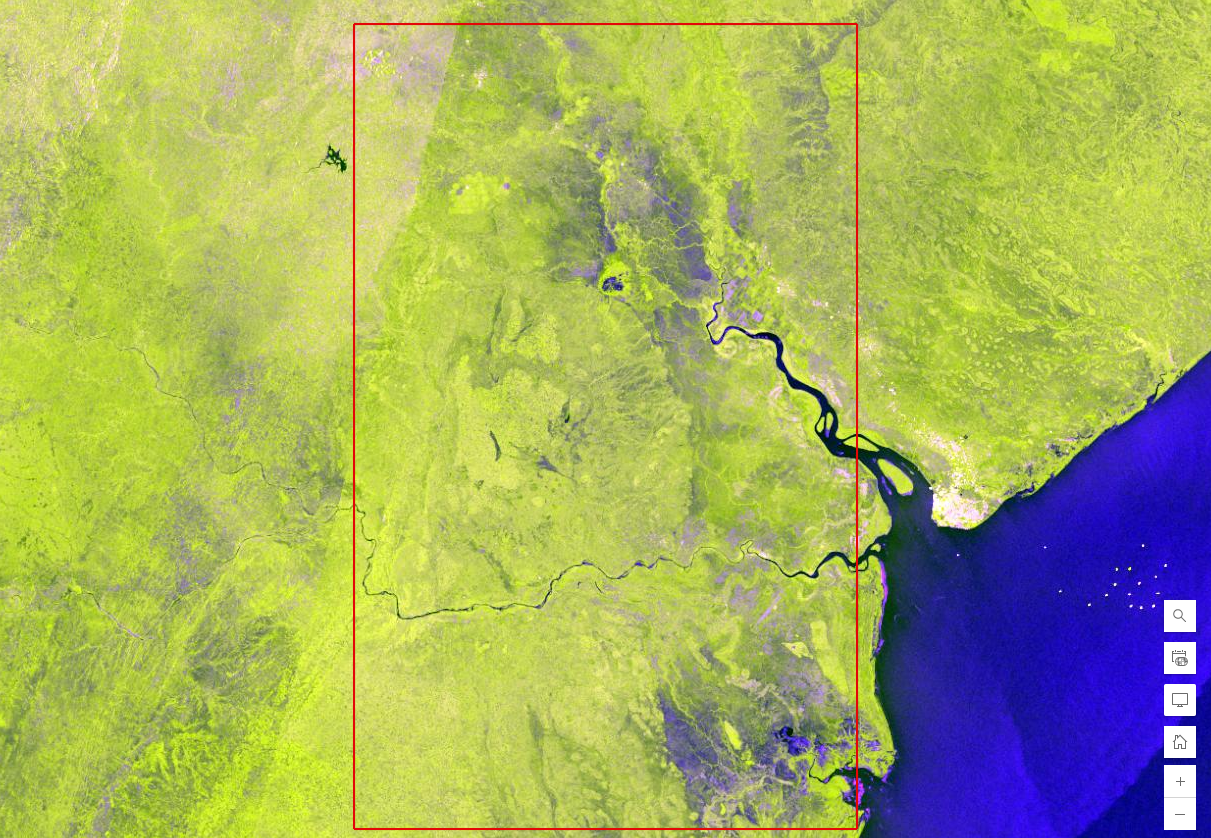
The Sentinel-1 RTC imagery provides analysis-ready SAR observations that require no additional preprocessing, while the AOI sets the processing bounds throughout the workflow, controlling credit usage and ensuring results share a consistent spatial extent.
Step 2: Identify Compatible Image Pairs
Reliable SAR change detection depends on comparing pre- and post-flood imagery acquired under similar viewing conditions. Differences in acquisition geometry can produce changes in radar backscatter that are unrelated to flooding, making image selection one of the most important factors affecting the quality of the final flood products.
Although selecting image pairs may seem straightforward, operational flood monitoring often involves dozens or hundreds of Sentinel-1 scenes acquired on different dates, relative orbits, orbit directions, and spatial footprints. Rather than relying on manual inspection, the workflow automatically applies a series of selection criteria to identify compatible image pairs. Automating this process improves reproducibility, reduces manual effort, and makes the workflow practical for repeated use across different flood events.
Query Sentinel-1 Scenes Intersecting the AOI
The workflow begins by retrieving Sentinel-1 scenes that intersect the AOI within the specified monitoring period. Building this pool of candidate observations automatically eliminates the need for manual image selection and provides a consistent starting point for selecting compatible image pairs.
The search window balances image availability with temporal relevance. A one-year lookback period typically provides sufficient pre-flood observations while reducing the likelihood of introducing long-term seasonal or land-cover changes. The user-defined monitoring period determines how long the workflow continues searching for post-flood imagery, making the same workflow suitable for both rapid flood response and longer-term monitoring.
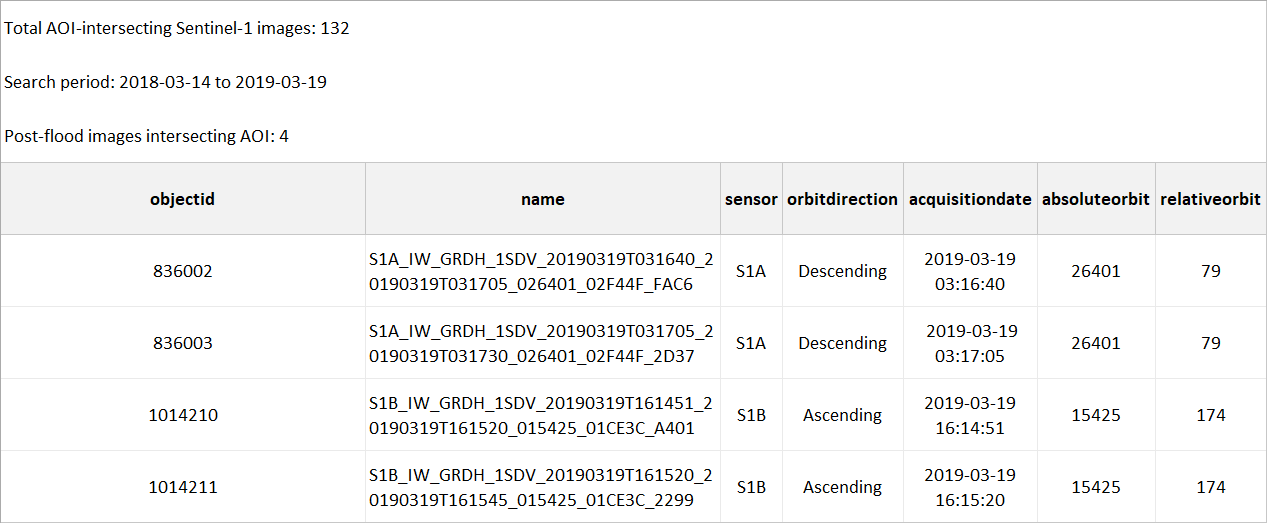
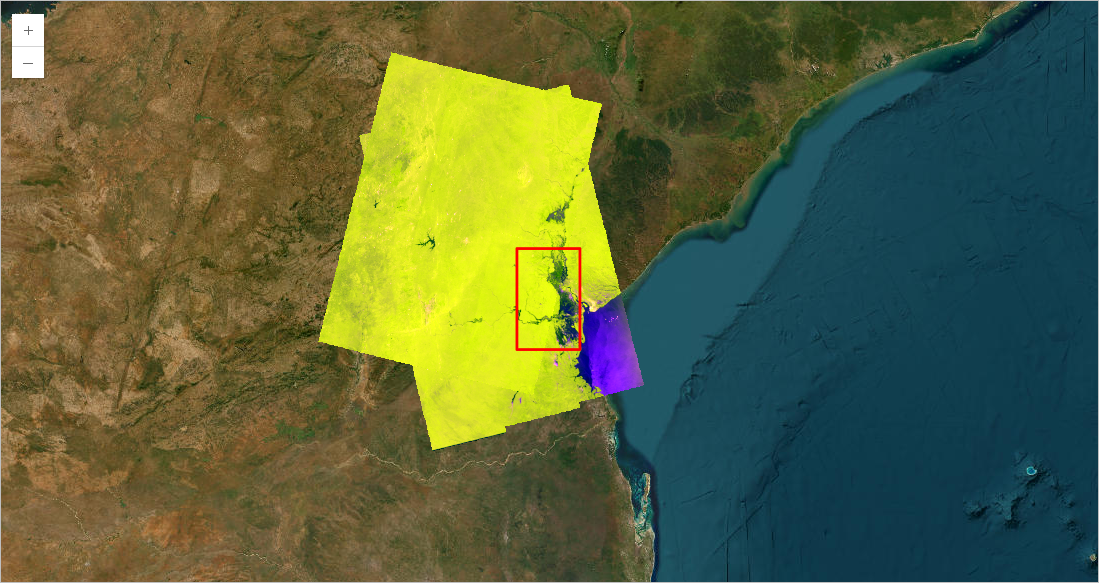
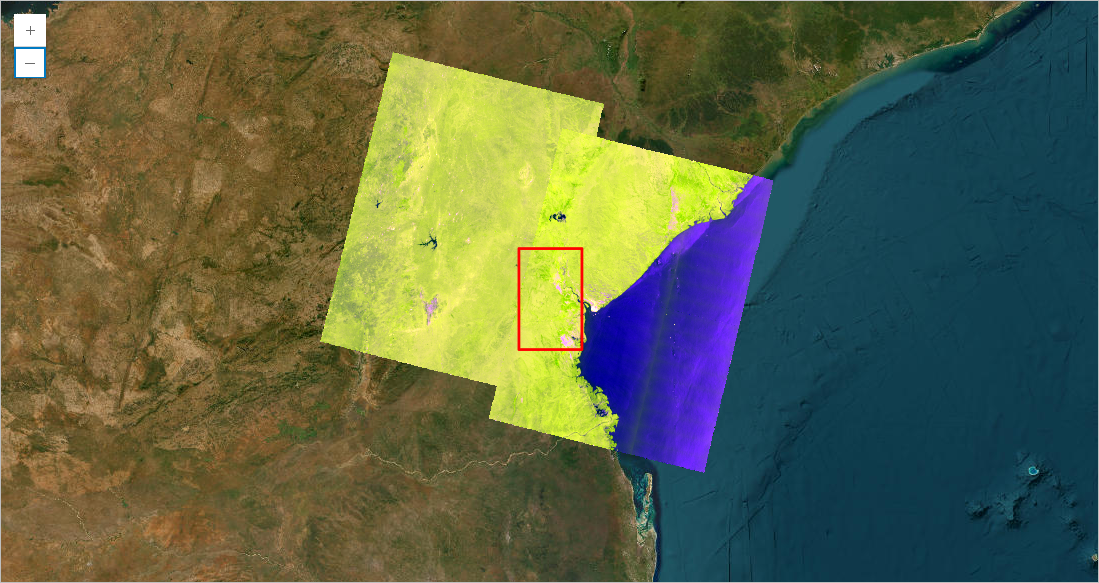
Review Pre-Flood and Post-Flood Candidate Scenes
Although scene retrieval is fully automated, the workflow includes a brief visual review before cloud-based processing begins. This quality assurance step allows analysts to confirm that the AOI is adequately covered and that suitable observations exist for the analysis.
Performing this review early can identify missing coverage or unexpected acquisition gaps before raster analytics are executed, avoiding unnecessary cloud processing and ArcGIS Online credit consumption.
Group Post-Flood Scenes into Acquisition Sets
Large AOIs are often covered by multiple scenes acquired during the same satellite pass. Rather than treating these scenes independently, the workflow groups observations that share the same acquisition date, relative orbit, and orbit direction into a single acquisition set. This creates a more consistent basis for comparing pre- and post-flood observations while simplifying the matching process.

Select Matching Pre-Flood Acquisition Sets
Selecting an appropriate pre-flood reference involves more than choosing the closest acquisition date. For SAR change detection, maintaining consistent acquisition geometry is more important than minimizing temporal separation, since differences in viewing geometry can produce backscatter changes unrelated to flooding.
For each post-flood acquisition set, the workflow searches the previous year for observations acquired from the same relative orbit and orbit direction. When multiple candidates satisfy these criteria, the workflow evaluates their AOI coverage and selects the acquisition that provides the closest spatial match to the corresponding post-flood observation.
This approach prioritizes consistent viewing geometry while maximizing overlap between the pre- and post-flood observations, improving the reliability of the resulting change products. If no ideal match exists, the workflow automatically selects the best available alternative instead of requiring manual intervention, allowing processing to continue while making the selection criteria transparent.

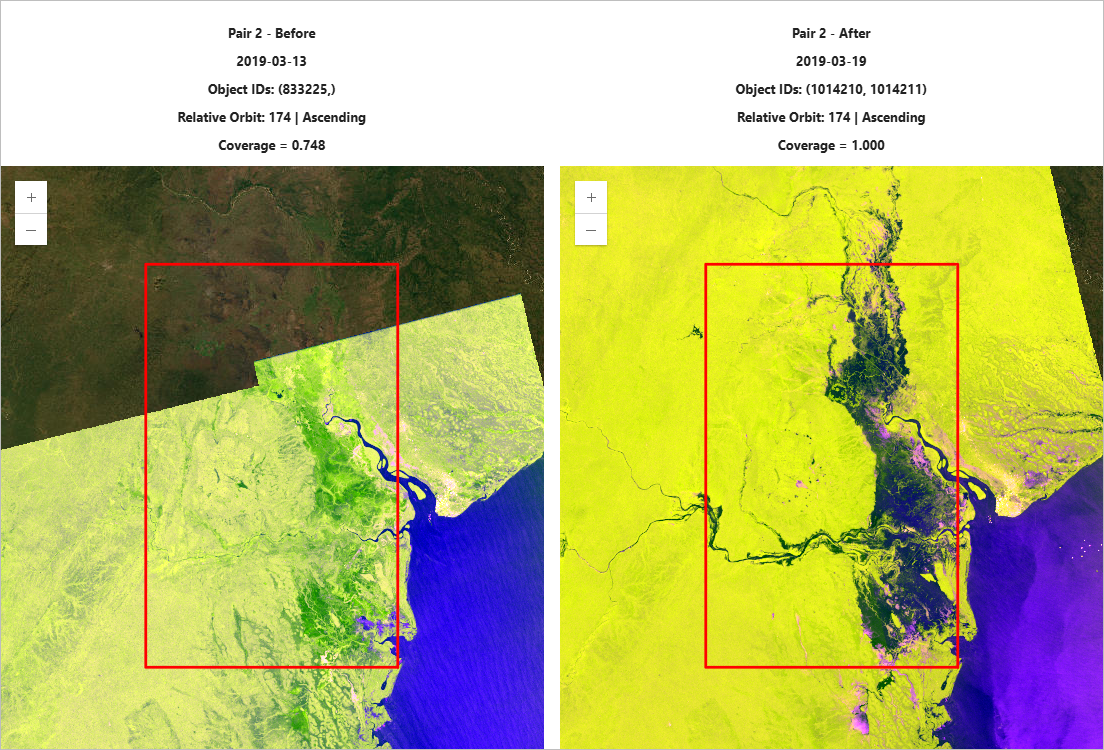
Prepare Image Pairs and Review Pair Maps
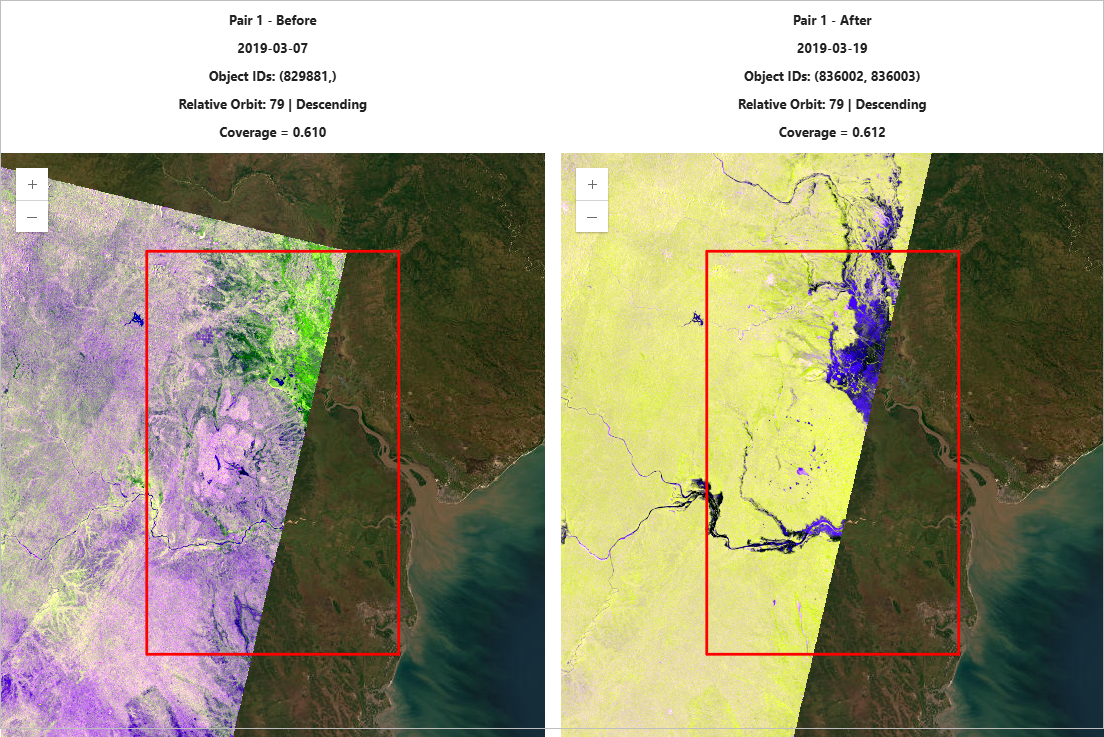
Once suitable image pairs are identified, they are retained throughout the remainder of the workflow to ensure that all subsequent raster processing uses the same observations. Locking the selected image pairs at this stage improves reproducibility and allows every downstream product to be traced back to a specific image pair.
The workflow concludes this step with a visual review of the image pairs. Although the selection process is automated, this final check provides an opportunity to verify that the selected observations adequately cover the AOI before computationally intensive raster analytics begin.
Step 3: Generate SAR Change Products
With compatible image pairs identified, the workflow converts the selected SAR observations into quantitative measures of surface change. Separating change detection from flood classification is an intentional design decision that makes the workflow more flexible. By first generating reusable change products, different thresholding or classification methods can be evaluated later without repeating the most computationally intensive raster processing.
Generate SAR Log-Difference Rasters
Flooding often reduces SAR backscatter because smooth water surfaces reflect much of the radar signal away from the sensor. To quantify these changes, the workflow generates a log-difference raster for each image pair. Values near zero indicate little or no measurable change, while negative values generally represent decreased backscatter associated with newly inundated areas. Positive values indicate increased backscatter that may result from vegetation changes, surface roughness, urban structures, or other land-surface changes.
Using a logarithmic change metric emphasizes relative changes while reducing the influence of SAR’s large dynamic range, providing a consistent representation of surface change across image pairs. These rasters are not flood maps themselves; instead, they serve as reusable intermediate products that separate change detection from flood classification. This design allows different thresholding or post-processing methods to be evaluated without repeating the computationally intensive raster analytics operations described in the notebook.
Clip Log-Difference Rasters to the AOI
Each log-difference raster is clipped to the AOI before further analysis. Processing only the required extent reduces the amount of data passed to subsequent raster analytics operations, improves efficiency, reduces ArcGIS Online credit consumption, and ensures that all subsequent outputs share a consistent spatial extent.
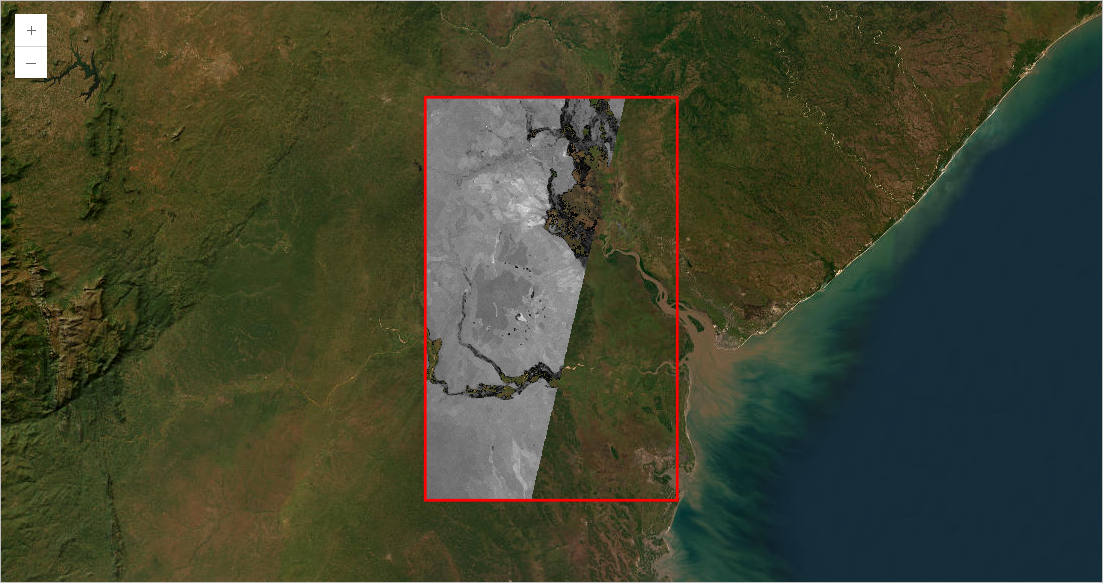
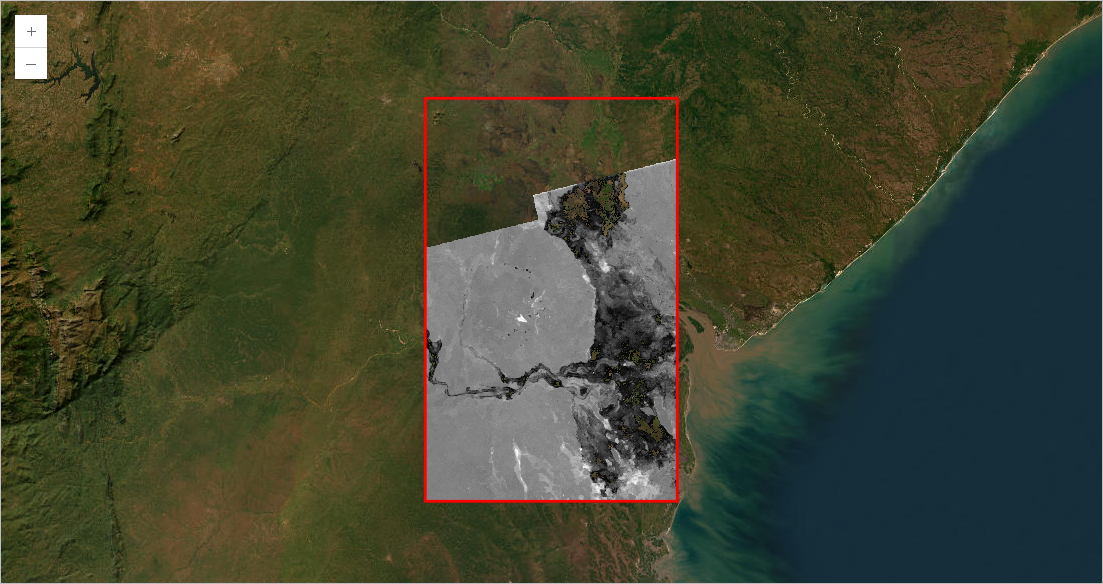
Review Log-Difference Rasters
Before proceeding to flood classification, the workflow includes a visual review of the generated SAR change products. Widespread flooding typically appears as coherent regions of decreased backscatter, while stable areas remain close to zero. This quality assurance step helps confirm that the selected image pairs produced meaningful backscatter changes and provides an opportunity to identify unexpected artifacts before additional cloud processing is performed.
Estimate Raster Analytics Credits for Log-Difference Outputs
Cloud-based raster analytics make large-scale processing practical, but they also consume ArcGIS Online credits. Estimating processing costs before creating hosted imagery layers helps users understand how factors such as AOI size, imagery extent, and the number of image pairs affect resource requirements. This allows users to adjust workflow parameters before launching computationally intensive analysis, making the workflow more predictable and easier to scale for operational use.

Save Log-Difference Rasters
The workflow publishes the clipped log-difference rasters as hosted imagery layers in ArcGIS Online. Preserving these intermediate products allows them to be reused for testing alternative thresholding methods, sharing with collaborators, or incorporating the outputs into additional workflows without rerunning the change-detection process.
Step 4: Detect Flooded Areas
The SAR change products quantify changes in radar backscatter, but not all changes are caused by flooding. Variations in vegetation, soil moisture, agricultural activity, urban surfaces, and inherent SAR speckle can all influence the radar backscatter, making flood detection more complex than simply identifying areas of change. To improve the reliability of flood detection, the workflow first identifies candidate flooded pixels using an adaptive threshold and then refines the result with neighborhood-based raster processing that suppresses isolated noise while preserving coherent flood patterns.
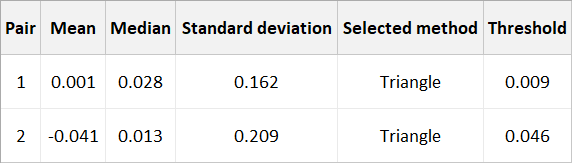
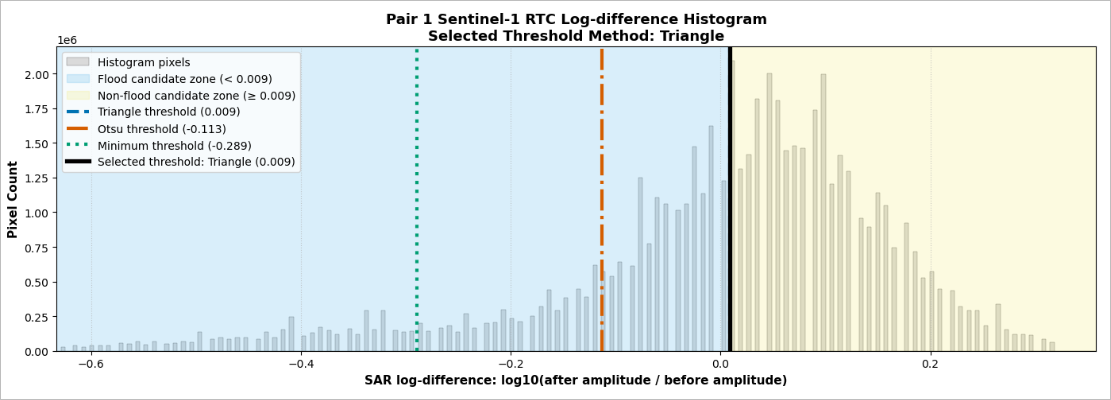
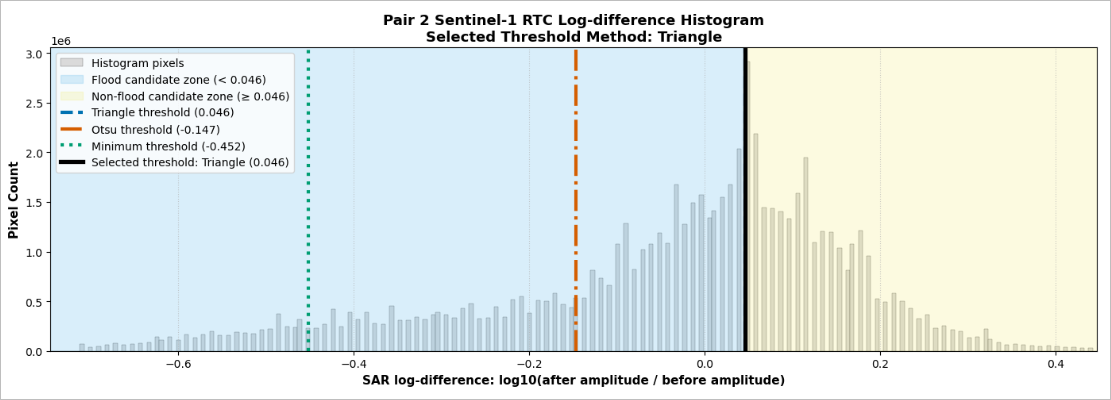
Determine Flood Thresholds from Log-Difference Histograms
Selecting an appropriate threshold is one of the most important decisions in SAR-based flood mapping because no single value performs well across all landscapes and flood events. Rather than using a predefined threshold, the workflow derives candidate thresholds directly from the histogram of each log-difference raster.
The notebook compares three commonly used methods:
- Triangle – Effective when flood pixels form a relatively small lower-value tail.
- Otsu – Maximizes the separation between two classes.
- Minimum – Identifies the valley between two peaks in bimodal histograms.
Evaluating multiple methods makes the workflow more adaptable to different flood events without requiring manual threshold selection.
Review Threshold Selection
Although threshold selection is automated, reviewing the histogram provides a simple quality assurance check. Displaying the selected threshold on the histogram allows users to confirm that it reasonably separates potential flood pixels from the larger population of relatively unchanged pixels before classification proceeds.
This review also helps identify situations where unusual histogram shapes or local landscape characteristics may influence the automated threshold selection before additional processing is performed.
Generate the Final Flood Mask
After a threshold has been selected, the workflow converts the SAR change raster into a binary flood mask and refines it using neighborhood-based raster operations. This refinement reduces isolated detections caused by SAR speckle while preserving larger, spatially coherent flood patterns.
An intentional design choice is to represent flooded pixels with a value of 1 while preserving all non-flood areas as NoData. This allows the published flood masks to overlay cleanly on basemaps, Sentinel-1 imagery, and other operational datasets without obscuring the underlying information. This transparent representation also simplifies comparison with reference imagery, infrastructure, and other geospatial data during emergency response and post-event assessment.
Note: Like any automated SAR classification, the results should be interpreted alongside other available information. Permanent water bodies, smooth bare soil, radar shadow, and some agricultural surfaces can produce radar responses similar to flooding. Whenever possible, the flood masks should be validated using reference imagery, local knowledge, or ancillary datasets before being used for operational decision-making.
Step 5: Publish Flood Products
The workflow concludes by publishing the refined flood masks as hosted imagery layers in ArcGIS Online. Publishing transforms the analysis results into persistent data products that can be visualized, shared, and incorporated into other GIS applications without rerunning the workflow. Integrating publishing into the workflow also promotes consistency by automatically applying a standardized naming convention and preserving the relationship between the outputs and the corresponding image pairs.
Estimate Raster Analytics Credits for Final Flood Mask Outputs
Before publishing the final flood masks, the workflow estimates the ArcGIS Online credits required to create each hosted imagery layer. Reviewing these estimates helps users understand the resource requirements before processing begins and makes it easier to balance analysis objectives with available credits.

Tip: When adapting the workflow to a new flood event or testing workflow modifications, start with a smaller AOI or a shorter monitoring period. This reduces processing time and credit consumption while validating the workflow.
Save Final Flood Mask Layers
After reviewing the estimated processing costs, the workflow publishes each refined flood mask as a hosted imagery layer in ArcGIS Online. Publishing preserves the final products independently of the notebook, making them available for visualization, sharing, and use in downstream GIS workflows without repeating the analysis.
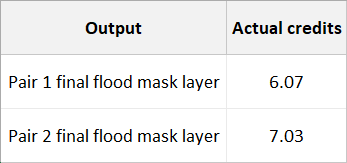
Report Raster Analytics Actual Credit Usage
Once processing is complete, the workflow reports the actual ArcGIS Online credits consumed by each raster analytics task. Comparing estimated and actual credit usage helps users better understand the computational cost of the workflow and provides useful guidance when planning future analyses.
Step 6: Review Results
Generating a flood map is not the end of the analysis. Before the results are shared or used for decision-making, they should be reviewed to verify that the mapped flood extent is consistent with the underlying SAR observations. This final step focuses on quality assurance by improving visualization, providing quick access to the published imagery layers, and supporting visual interpretation of the results.
Apply Flood Symbology
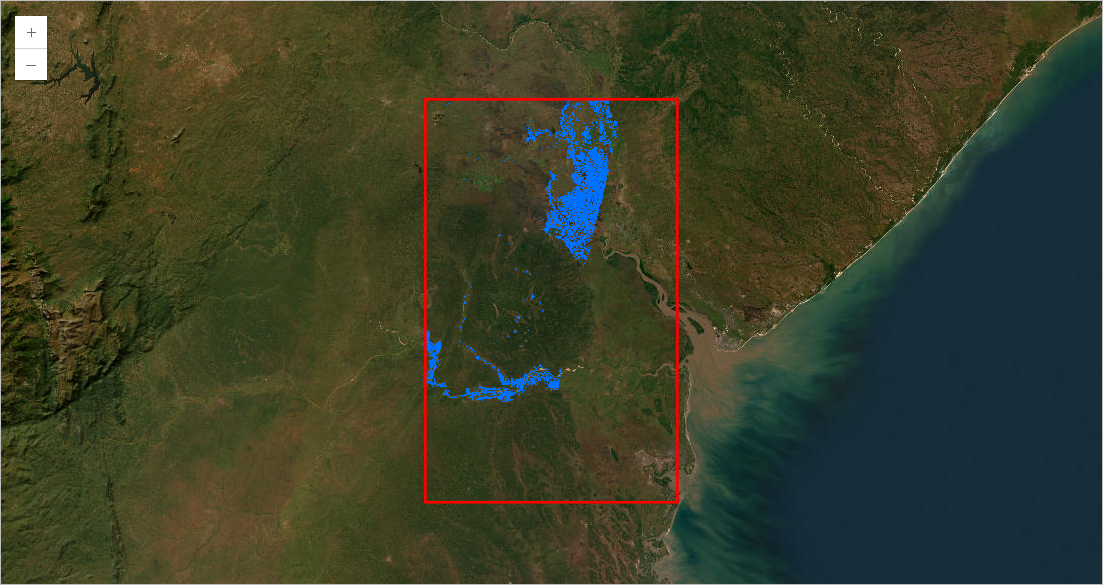
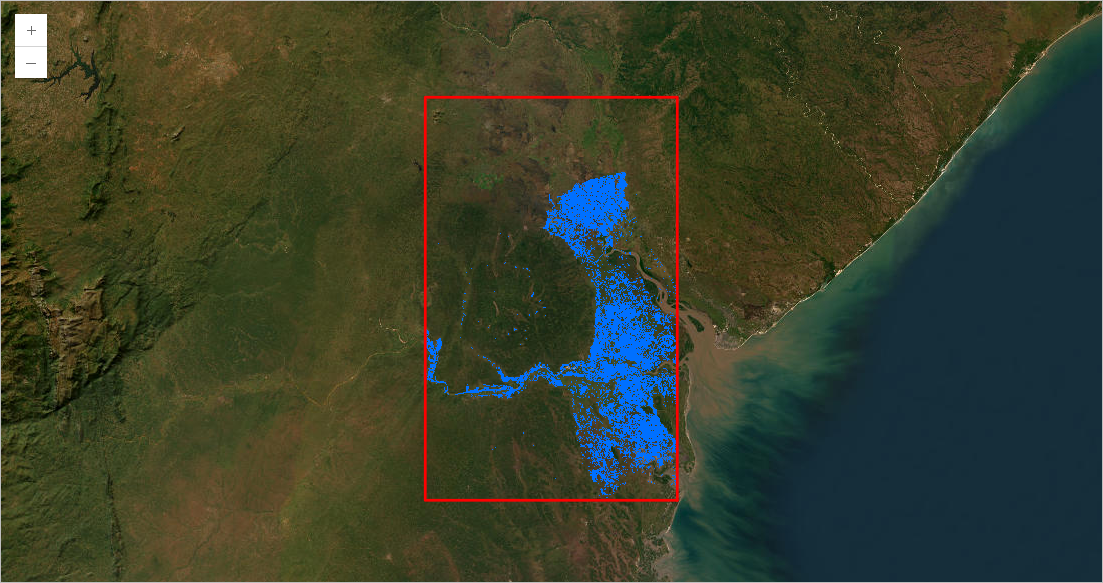
The workflow applies a consistent symbology that displays flooded pixels in blue while leaving non-flood areas transparent (NoData). Using the same visualization for every output makes flood extents easier to interpret and compare across image pairs and flood events, while allowing the results to be viewed over basemaps, Sentinel-1 imagery, or other operational datasets without obscuring the underlying information.
Display Output Item Links
The workflow provides direct links to each published imagery layer in ArcGIS Online, allowing users to quickly access the outputs, review metadata, configure sharing settings, or incorporate the layers into web maps, dashboards, and other GIS applications.
Review Final Flood Mask Outputs
The final flood masks should be interpreted alongside the SAR change products and, whenever possible, other reference information. Comparing these datasets helps confirm that mapped inundation is consistent with the observed changes in radar backscatter while providing an opportunity to identify unexpected artifacts before the results are used operationally.
When multiple compatible image pairs are available, the workflow can also support temporal monitoring by producing a consistent series of flood masks that capture how inundation evolves through time. As new Sentinel-1 observations become available, the workflow can be rerun using the same methodology to monitor flood progression or recession.
Note: Like any automated SAR-based classification, the results have limitations. Permanent water bodies, smooth bare soil, radar shadow, and some agricultural surfaces can produce radar responses similar to flooding. Depending on the application, the flood masks may be further refined using ancillary datasets such as permanent water layers, land-cover classifications, or digital elevation models.
This article introduced the design principles behind an automated flood-monitoring workflow built with Sentinel-1 imagery layer from Living Atlas, ArcGIS API for Python, and raster analytics. While the accompanying notebook demonstrates the implementation, this article focused on the design decisions that make the workflow dependable, reusable, and scalable for operational flood monitoring.
Although the workflow is demonstrated using the 2019 flooding associated with Tropical Cyclone Idai near Beira, Mozambique, it is designed as a reusable framework rather than an event-specific solution. By updating the flood event name, monitoring period, and AOI, the same methodology can be applied to any flood event where Sentinel-1 imagery is available to monitor flood progression and compare observations through time. Its modular design also makes it straightforward to incorporate additional datasets, alternative classification approaches, or application-specific refinements as operational requirements evolve.
Extending the Workflow
One of the strengths of this workflow is its modular design. Each stage—from image selection and change detection to thresholding and publishing—can be adapted without changing the overall framework. Potential extensions include:
- Permanent water masking – Incorporate datasets such as the Joint Research Centre (JRC) Global Surface Water dataset to reduce confusion between persistent water bodies and newly inundated areas.
- Slope filtering – Use a digital elevation model (DEM) to remove unlikely flood detections in steep terrain.
- Additional SAR information – Evaluate the combined use of VV and VH polarizations to determine how different polarization combinations influence flood mapping results.
- Alternative thresholding approaches – Compare additional histogram-based or locally adaptive thresholding methods.
- Alternative change-detection approaches – Extend the current log-difference methodology by incorporating direct thresholding of pre- or post-flood imagery, or by combining absolute SAR backscatter values with change-detection products to further refine flood classification.
- Application-specific customization – Adapt the image-selection logic, matching criteria, thresholding methods, flood-mask refinement, visualization, and output products to meet specific operational or research requirements.
These examples illustrate how the workflow can evolve while preserving its core design principles: automated image selection, reproducible processing, and scalable cloud-based analysis.
Additional resources
You can find more tutorials in the tutorial gallery.
Explore additional raster analysis blog tutorials using Living Atlas imagery content.
Learn more about SAR in Guide: Fundamentals of Synthetic Aperture Radar.
Learn more about the ArcGIS API for Python.
Explore the Deep Learning Libraries Installers for ArcGIS.
Acknowledgements
Sentinel-1 RTC layer: Copernicus Sentinel-1 data from European Space Agency, sourced from the Microsoft Planetary Computer and accessed via Living Atlas.

Article Discussion: