When disasters occur, timely and accessible imagery aids responders in accelerating humanitarian response and recovery.
Today we are happy to announce that Vantor imagery for disaster response and emergency management, made publicly available through their Open Data Program, is now available in ArcGIS Living Atlas. As new imagery becomes available in the open data repo, it is automatically added to a dynamic time enabled image service, streamlining the process and reducing the time it takes to get imagery into the hands of disaster responders. Availability of imagery is subject to Vantor’s activation of their Open Data Program. See their event activation protocol to learn more.
Powered by the Disaster Imagery layer in Living Atlas, and the ArcGIS Maps SDK for JavaScript, Disaster Imagery Explorer further improves the accessibility and discovery of imagery for disaster response and recovery efforts.
This article serves as a quick-start guide for anyone seeking additional context and guidance on using the app.

Table of Contents
Explore
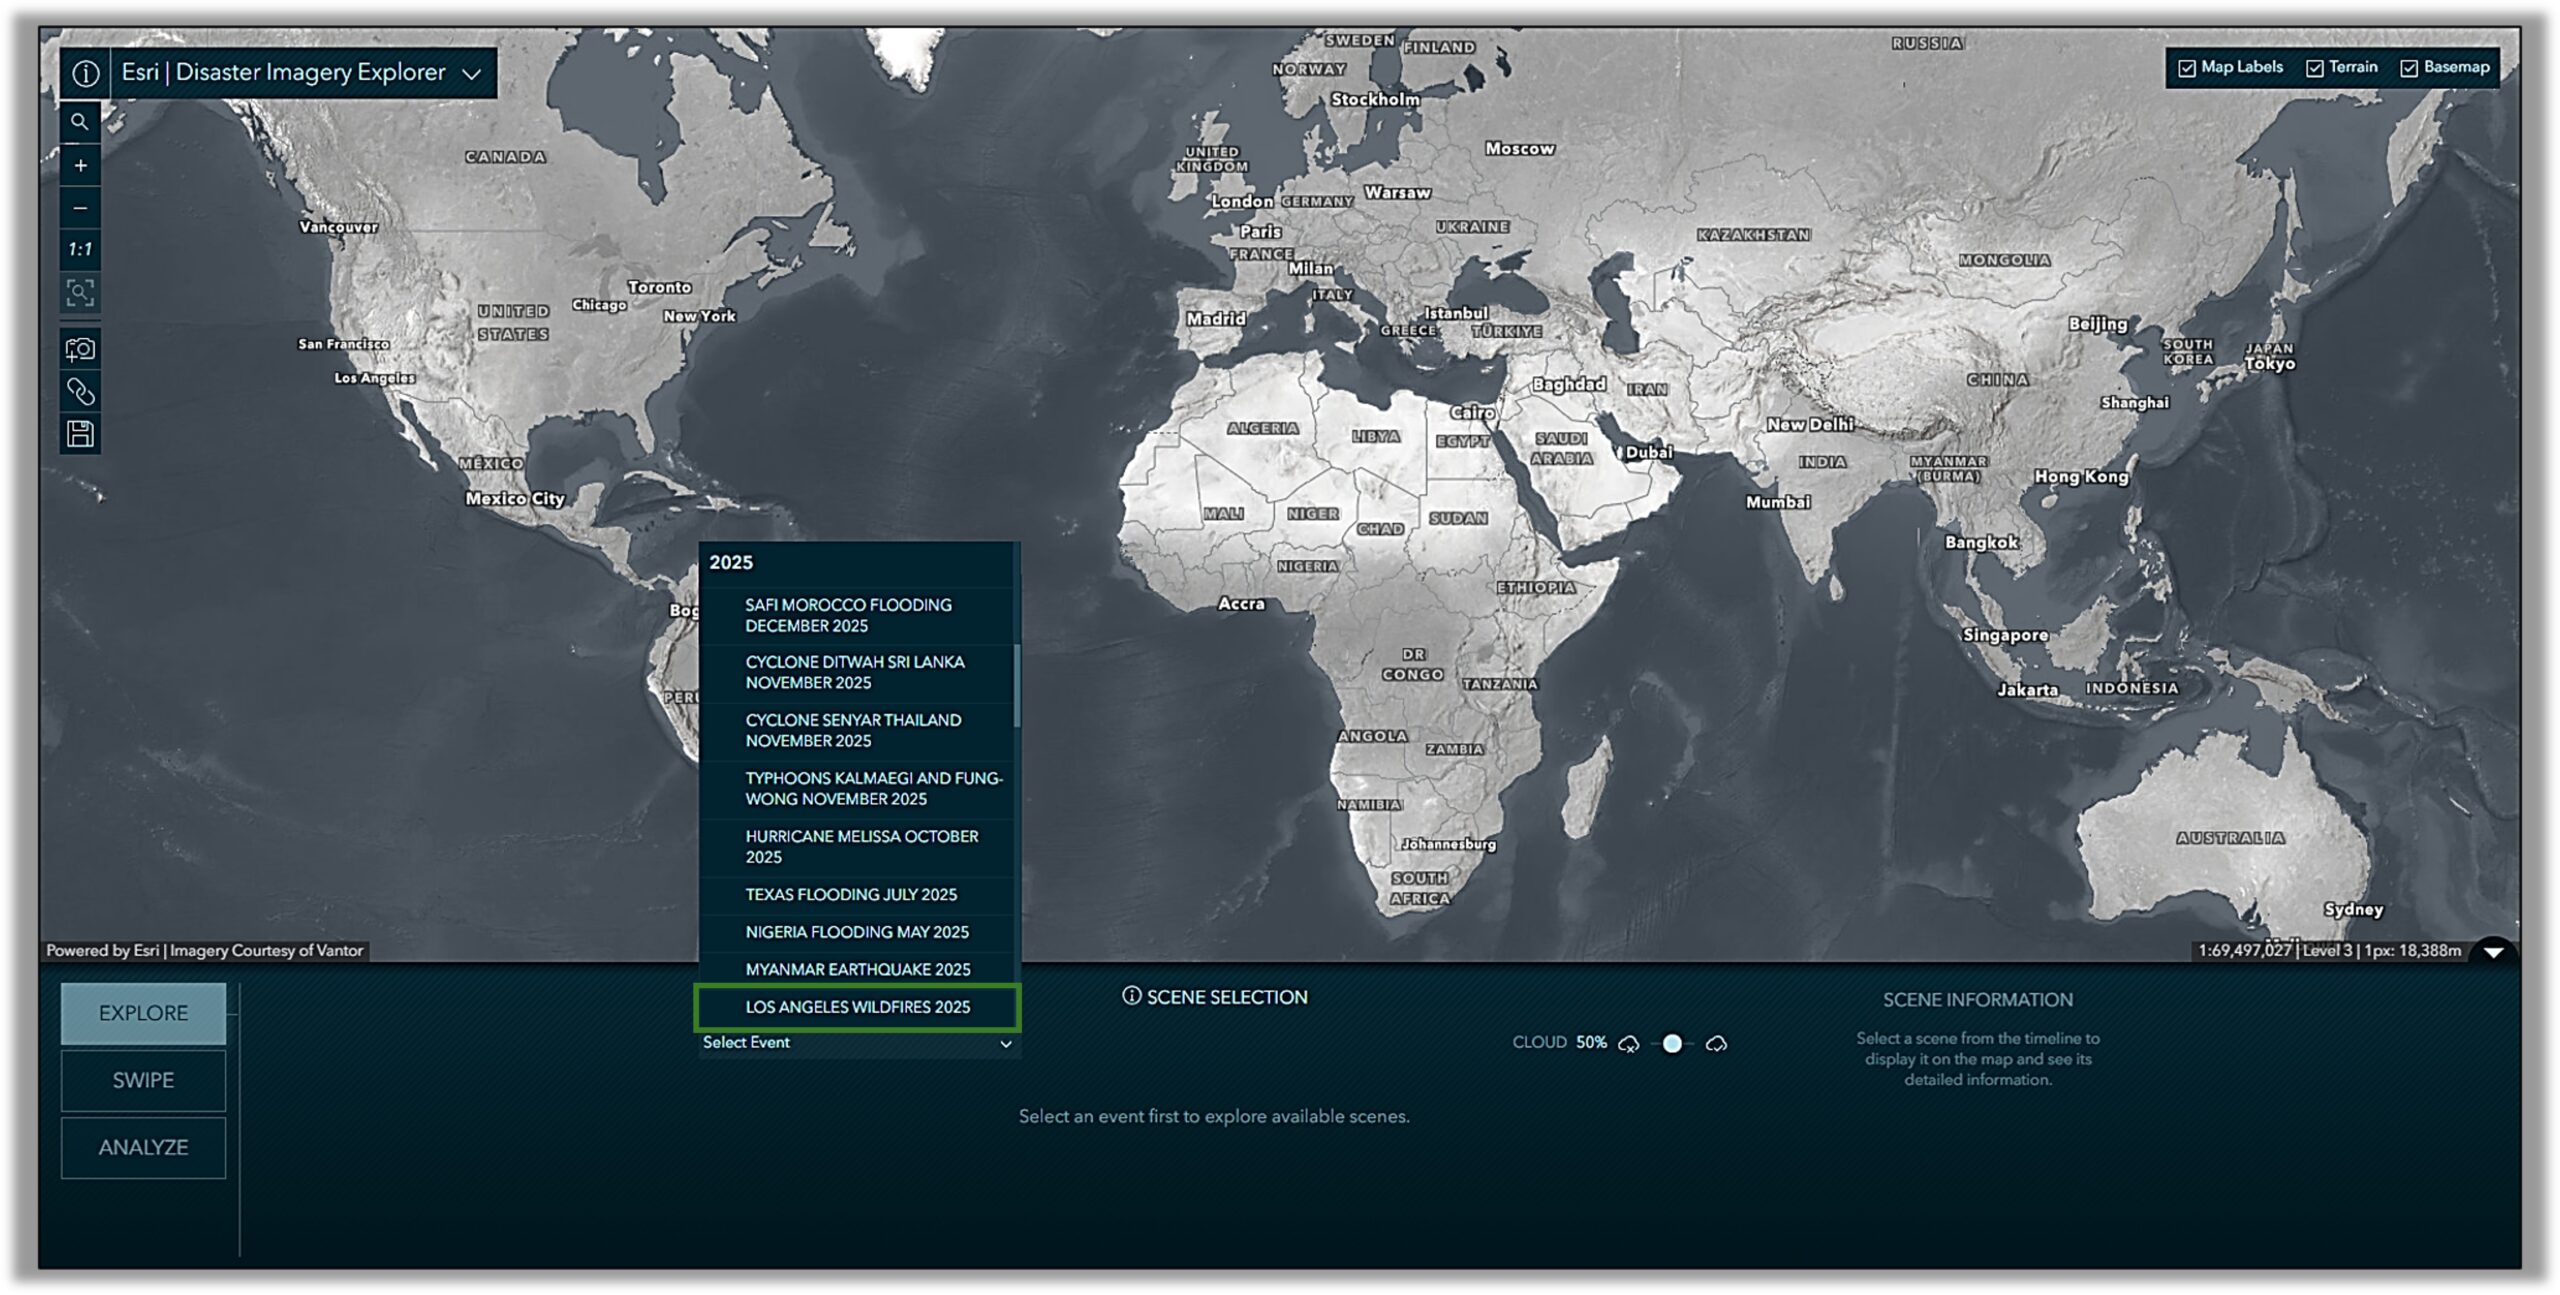
The app opens by default showing a greyscale basemap of the world. The first action is to select an event. Here we have selected the “LOS ANGELES WILDFIRES 2025” event.
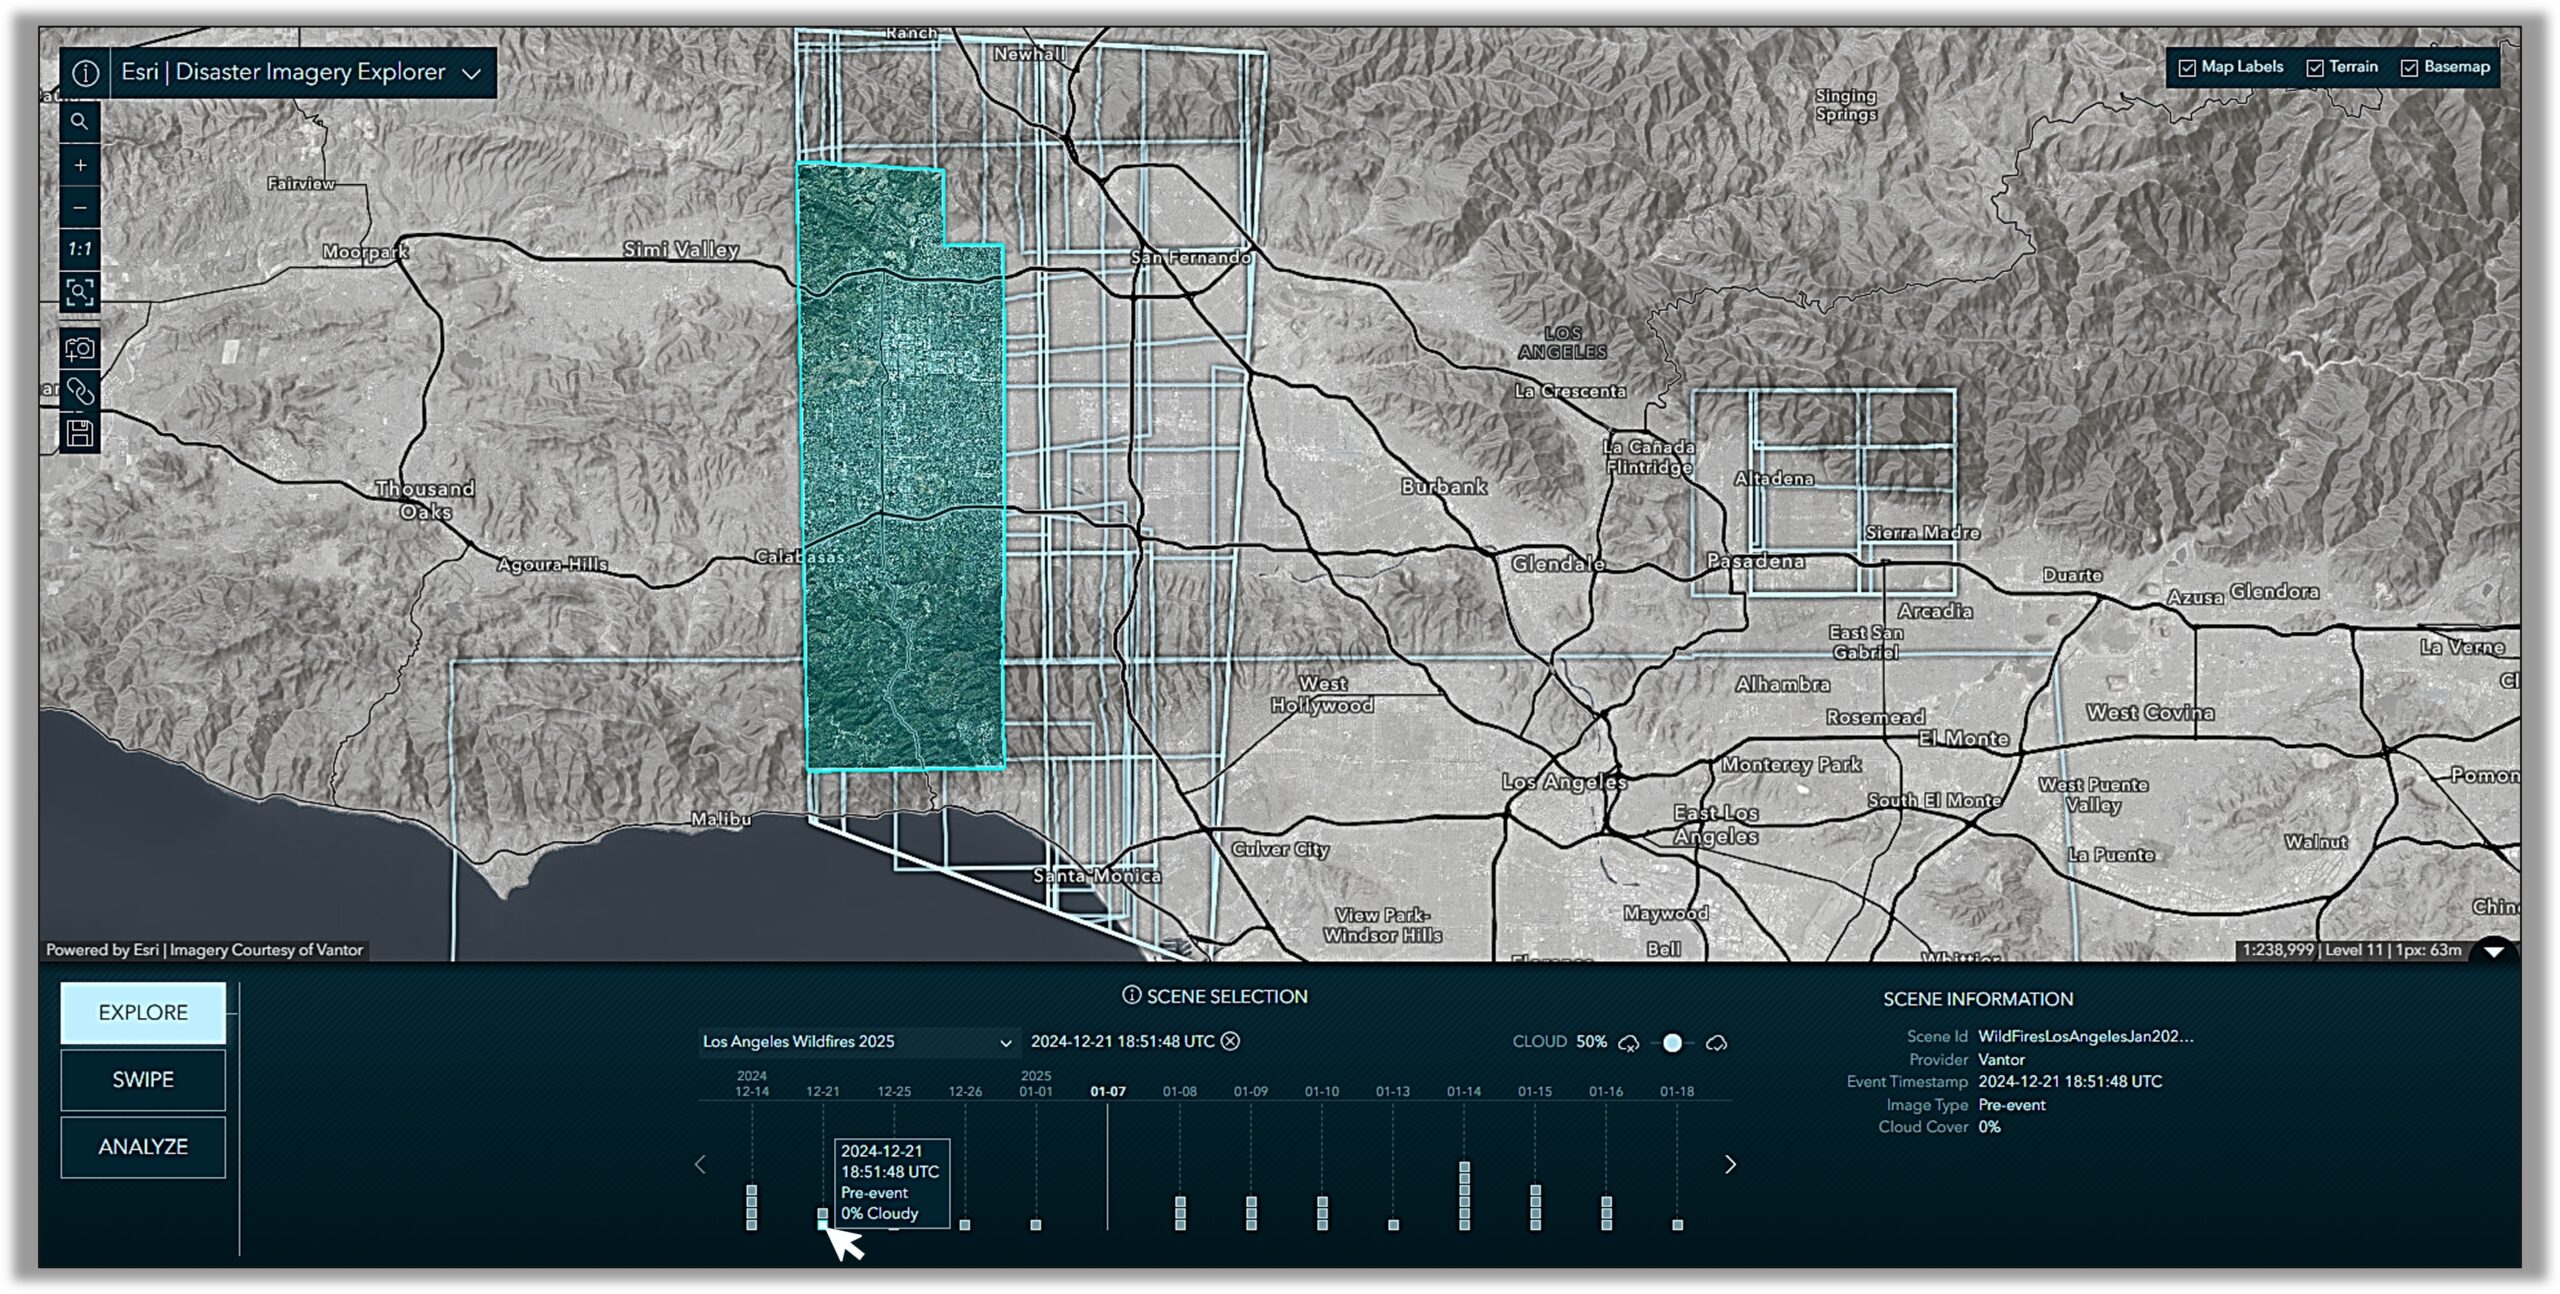
With the event selected, the map will zoom to the extent of all available scenes for that event. Scenes are represented as footprints on the map and boxes on a timeline. The timeline is where scenes are selected for display on the map. The event start date is bolded on the timeline to help distinguish pre-event from post-event imagery.
Only scenes within your current map view and selected event are displayed on the timeline. Dates and scenes available on the timeline dynamically update as the map extent changes. Using the slider, you can also filter scenes by percent cloud cover.
Hovering over an available scene on the timeline illuminates the footprint on the map. Selecting an option on the timeline will render the scene on the map. Click the example below to open Disaster Imagery Explorer with a pre-event scene already selected.
Swipe
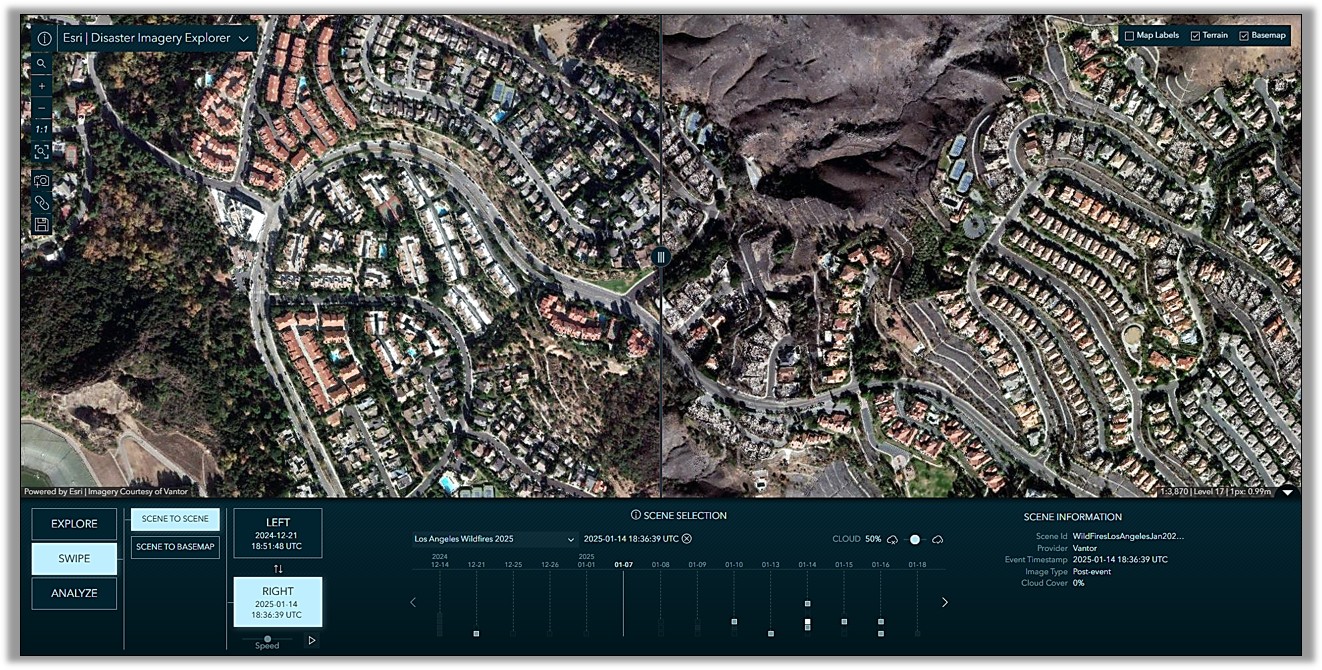
Swipe mode includes two different swipe experience options. Scene to Basemap uses the World Imagery basemap for comparison versus a single selected scene, and Scene to Scene requires two scene selections for comparison.
From the Explore mode example above, a pre-event image from December 2024 had already been selected. Switching from Explore to Swipe, you will now have the opportunity to select a second scene to compare against.
At times, there can be many scenes of varying shapes, sizes and locations to choose from, so Swipe mode helps to determine which scenes overlap with your current selection. A selection from one side of the swipe will filter and highlight available scenes for the other side based on their intersection/overlap. For cases where there may not be better options for comparison, you may choose to swipe a selected scene against the World Imagery basemap.
Click the graphic below to open Disaster Imagery Explorer with Scene to Scene Swipe as the active mode with pre and post-event scenes selected.
Change Detection
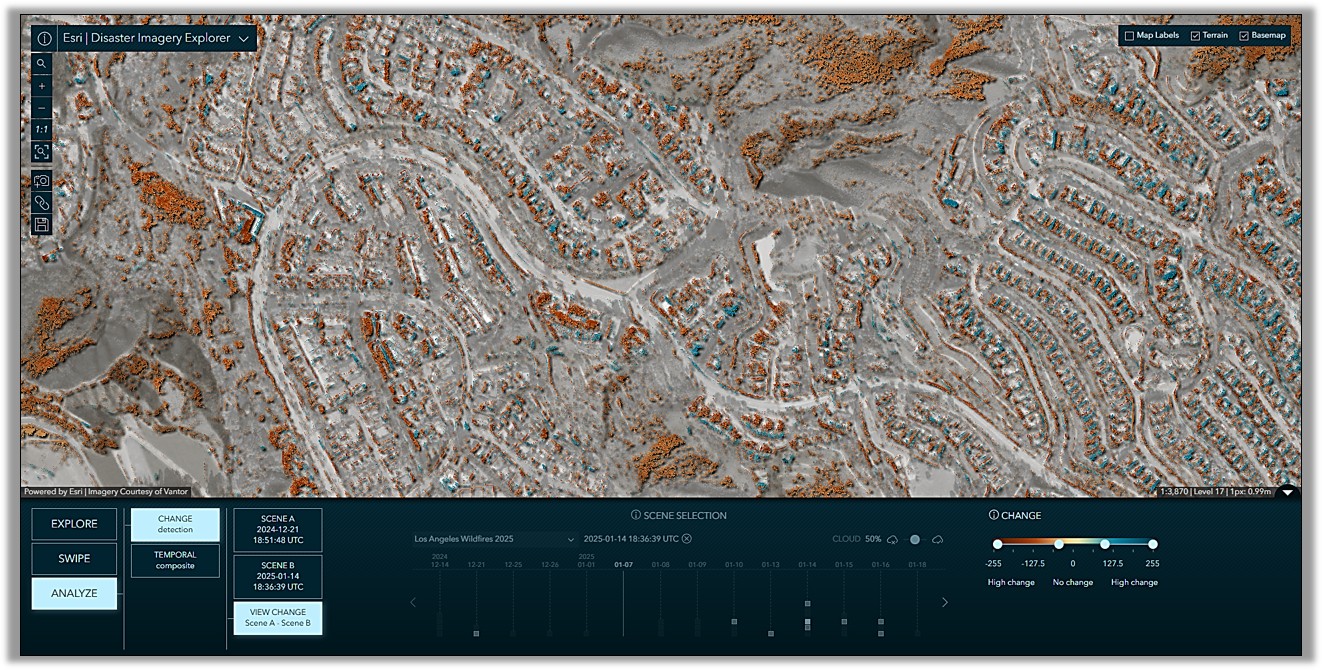
Change Detection converts two selected RGB images to single band 8-bit greyscale images using a luminosity method and then calculates the difference between them: SceneA – SceneB = Difference Image.
The resulting image reports differences in the brightness values of the two images with an output value range of -255 to 255.
The display of the output image can be filtered by output pixel value ranges with the four handled threshold slider.
It is important to note that observed changes can include false positives due to geometric and radiometric shifts between selected images. This includes, but is not limited to, spatial accuracy and variable displacement of above ground objects such as buildings, as well as environmental factors such as variable sun angles and shadows.
Switching from Swipe to Change Detection, with the same two images selected, you can now select View Change to calculate the difference between those two images and use the threshold slider to try to isolate the most significant and meaningful changes.
Temporal Composite
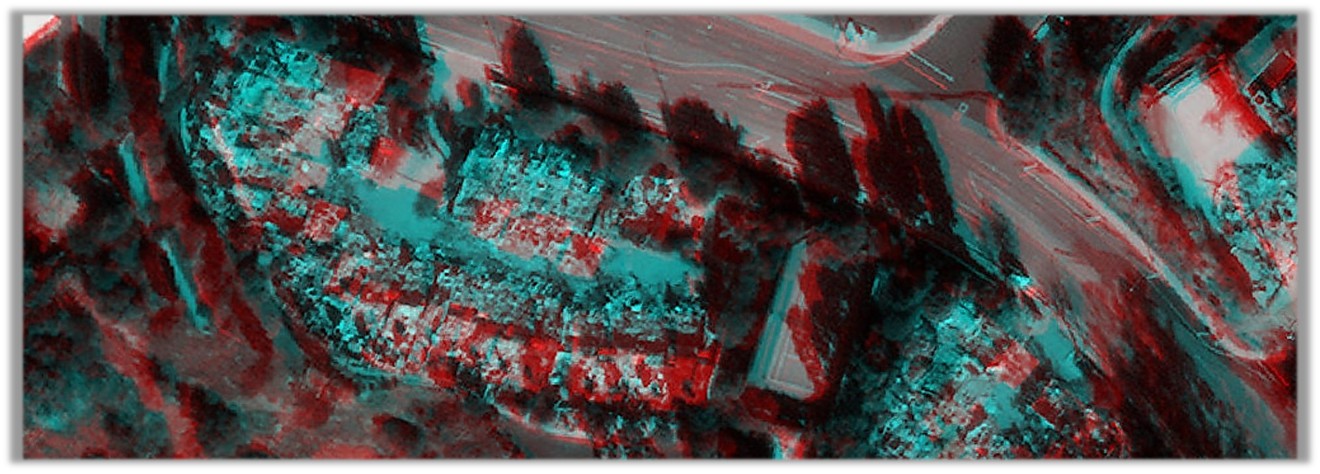
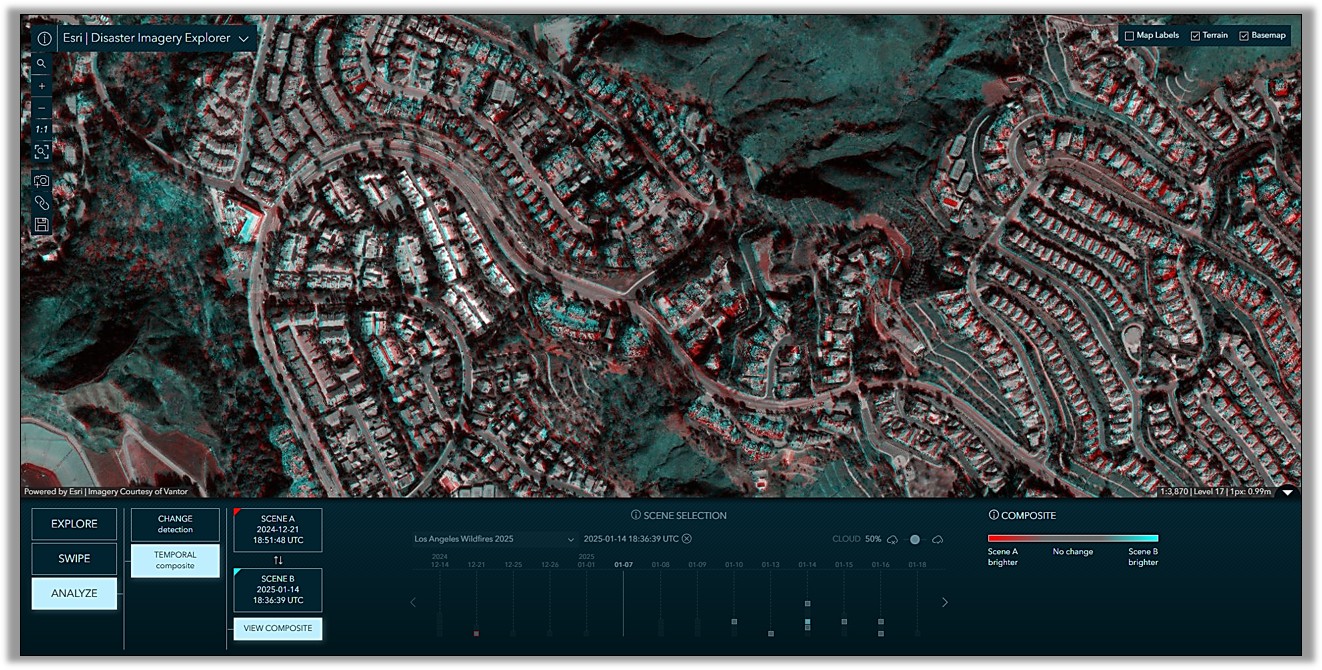
Temporal Composite converts two selected RGB images to single band 8-bit greyscale images using a luminosity method and then merges them together in an output RGB composite where Red = SceneA and Blue and Green = SceneB.
The output colored, multitemporal composite represents changes in brightness values that occurred over the intervening period. Both Cyan and Red indicate areas of more significant change with grey representing little to no change.
Once again, it is important to note that observed changes can include false positives due to geometric and radiometric shifts between selected images. This includes, but is not limited to, spatial accuracy and variable displacement of above ground objects such as buildings, as well as environmental factors such as variable sun angles and shadows.
Switching from Swipe to Temporal Composite, with the same two scenes selected, you can now select View Composite to combine the two scenes. See example below.
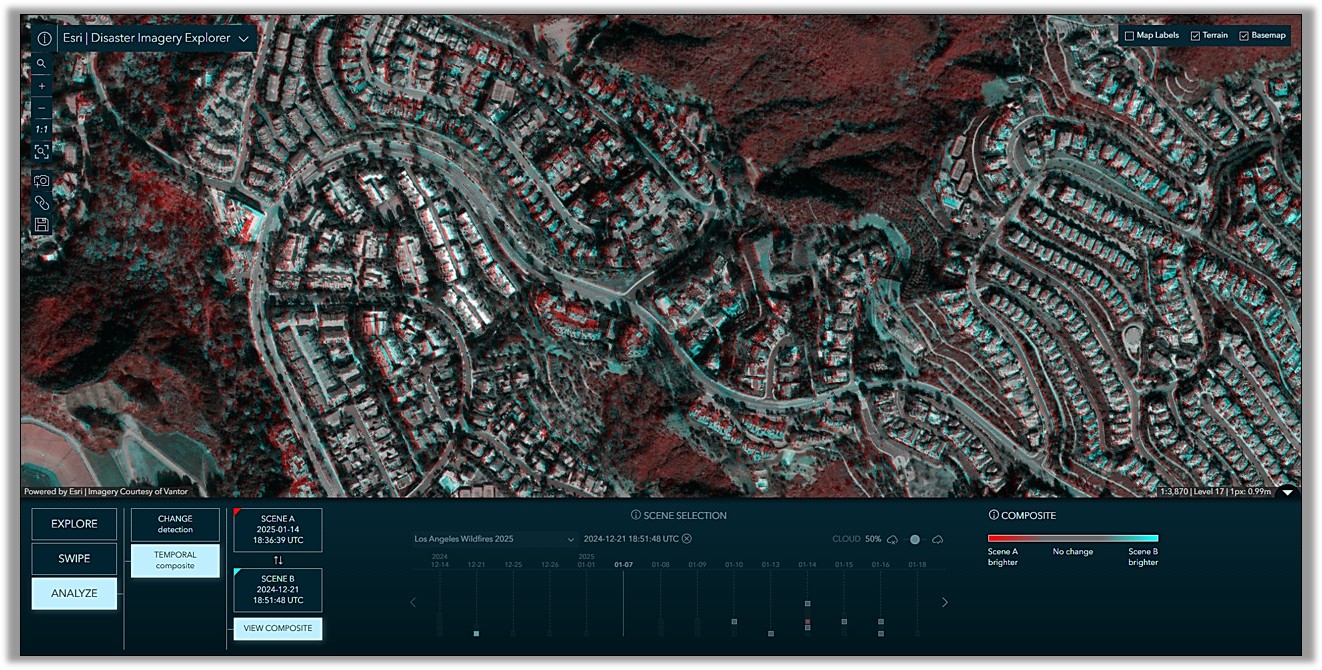
You can also click the arrows between Scene A and Scene B to swap their band position in the output composite.
Save Panel
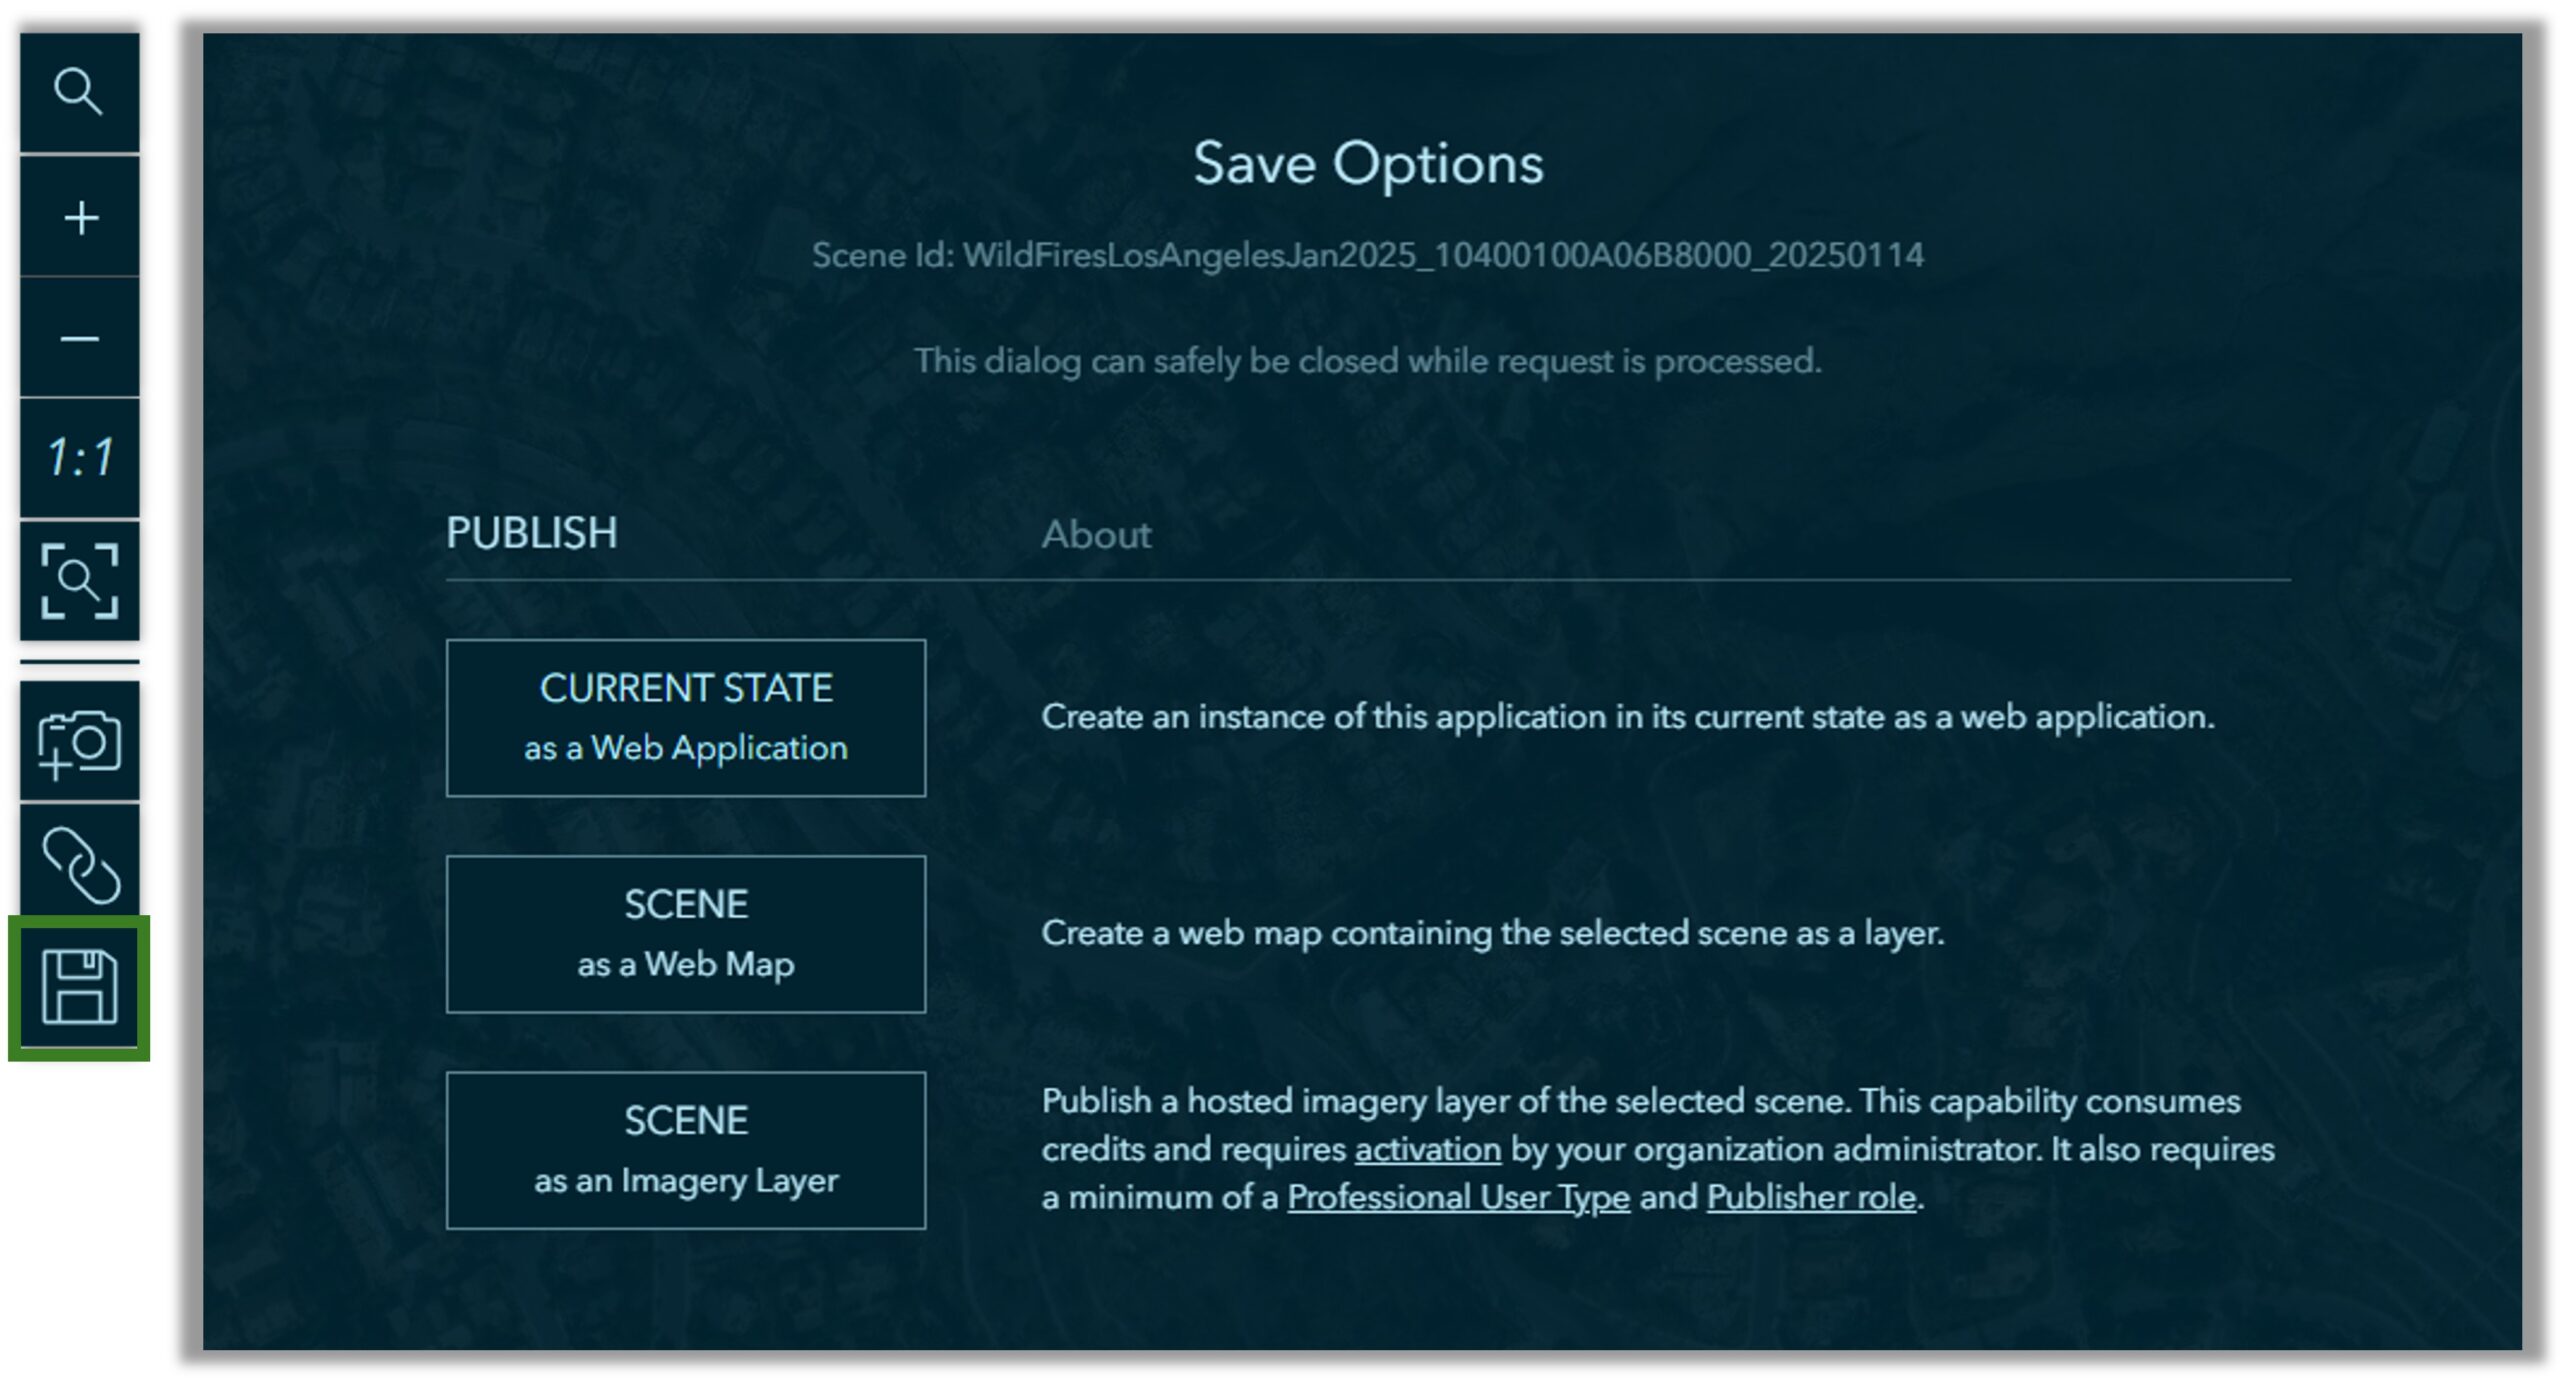
The save panel for Disaster Imagery Explorer provides three primary ways of persisting content from the app into your ArcGIS Online account.
- Current State as a Web Mapping Application – persisting the current state of the app (e.g. Swipe with pre/post-event image comparison) as an item in Online is a convenient way to capture and share with others important information and visuals discovered in the app.
- Scene(s) as a Web Map – persisting a scene(s) discovered in the app in a web map helps to jumpstart further analysis in Map Viewer or building your own custom app experience.
- Scene as an Imagery Layer – a good option if you need to host the imagery data within your own organization.
Many thanks to the team for bringing this together! Great work y’all!
App development: Jinnan Zhang
UX/UI and cartographic design: John Nelson
Image service development: Robbie Richard and James Sill

Kudos Living Atlas team!