As a pioneer in nocturnal remote sensing technology, the Earth Observations Group (EOG) has been producing Nighttime Lights maps since 1994. With the launch of the latest generation of earth observation satellites, significant advancements have been made with low light imaging. EOG has taken advantage of these technological advancements to provide users with superior quality Nighttime Lights products.
Now available in ArcGIS Living Atlas of the World, The VIIRS Nighttime Lights Monthly Cloud-Free Composite offers additional opportunity for monitoring human activities at both a regional and global scale. This data is useful for visualizing, measuring, monitoring, and analyzing human activity. You might use it in conjunction with other Living Atlas layers, such as the Global Human Settlement – Urban Centres Database, to pinpoint urbanized areas and begin to detect patterns of change related to urbanization, population growth, economic activity, access to electricity, and more.
This particular Nighttime Lights product is produced by computing average radiance across all DNB daily measurements for a particular month, while filtering out stray light, lightning, lunar illumination, and cloud-cover.
EOG notes that there are areas of the globe where it is impossible to get good quality data coverage for any given month. This can be due to cloud-cover, especially in the tropical regions, or due to solar illumination, as happens toward the poles in their respective summer months. Therefore, when used for analysis, users should not assume a value of zero in the average radiance image means that no lights were observed. To correctly interpret a value of zero, users also need to reference the cloud-free observations file. This imagery layer contains two bands: Band-1 includes the radiance values and Band-2 includes the cloud-free observations information.
Temporal Coverage and Updates
The open access data provided through this time enabled layer is published on a delayed release cycle with undefined latency. As EOG publishes updates, Esri will include them in this layer.
As of August 2021, monthly products are available from January 2014 through April 2021.
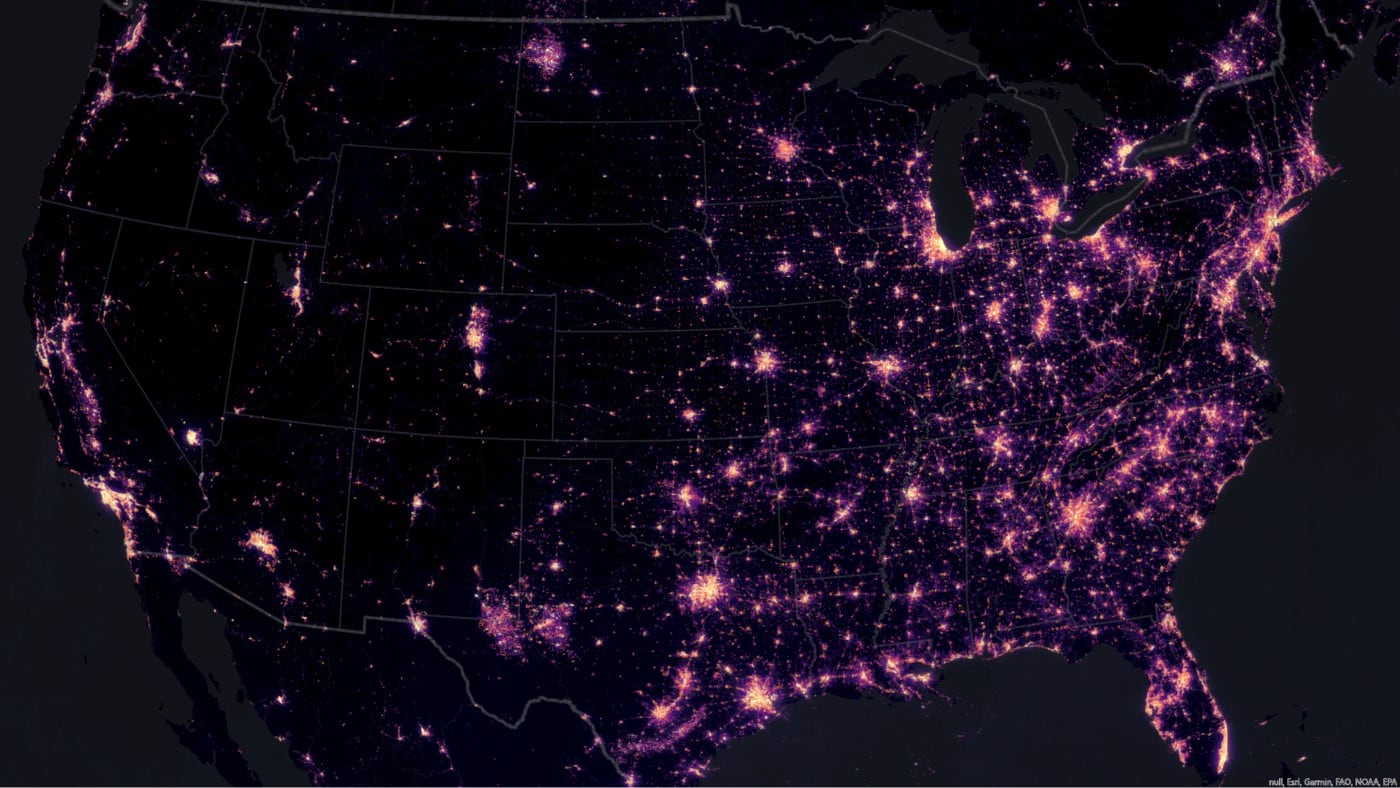
Some Additional Eye Candy
...
...
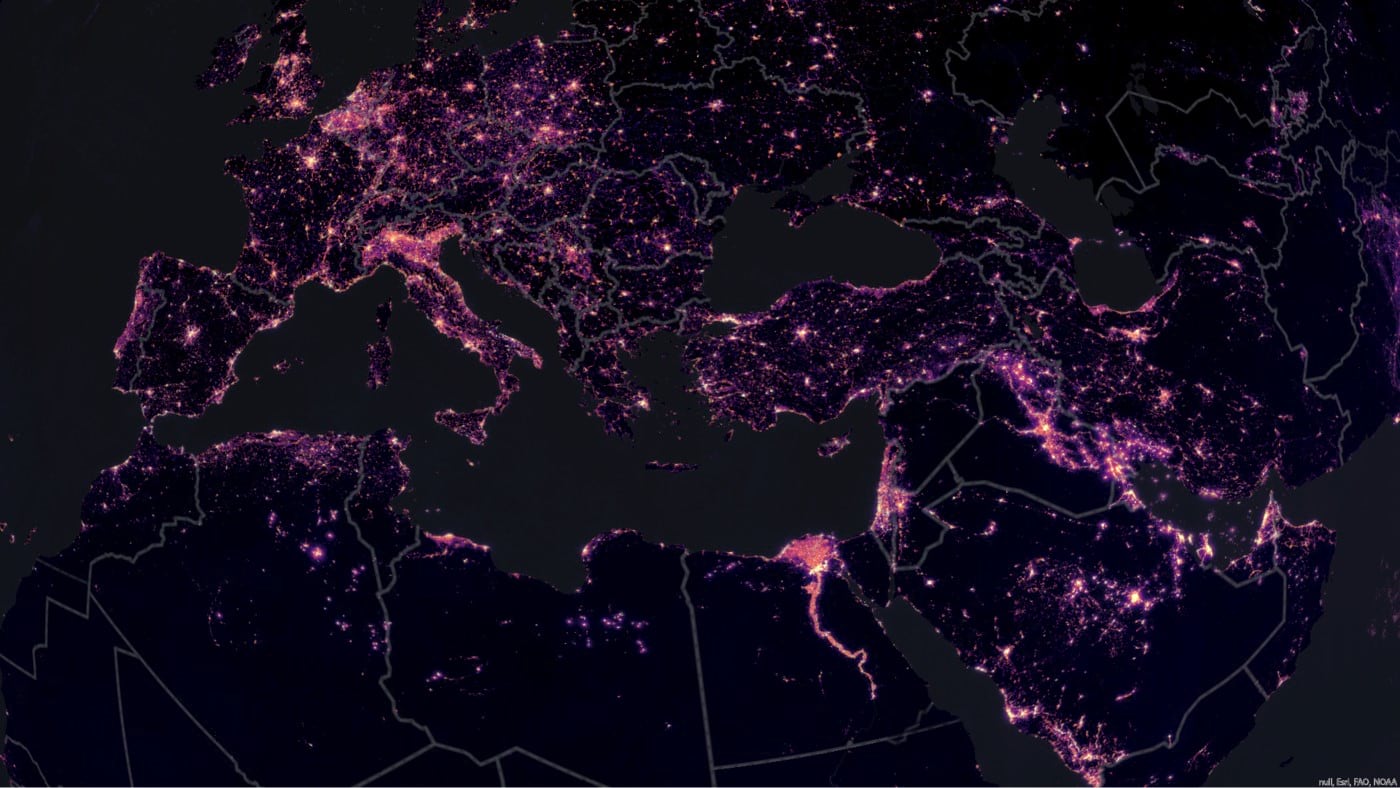
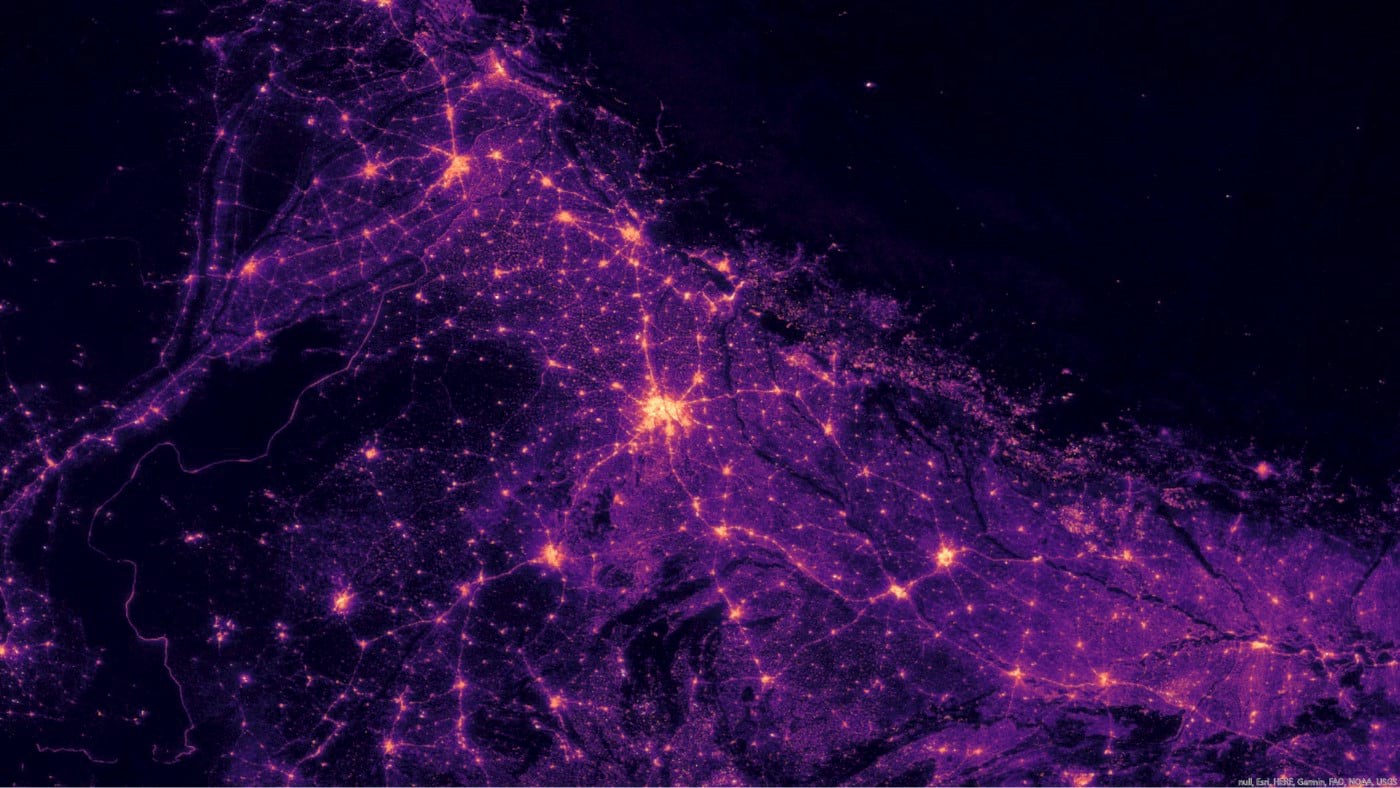
Nighttime Lights - Europe, North Africa, Middle East
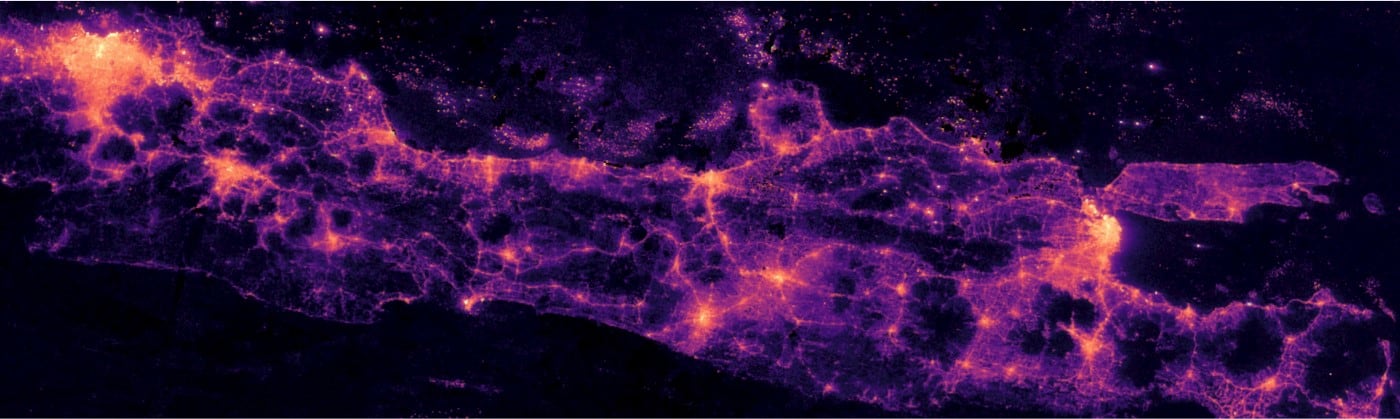
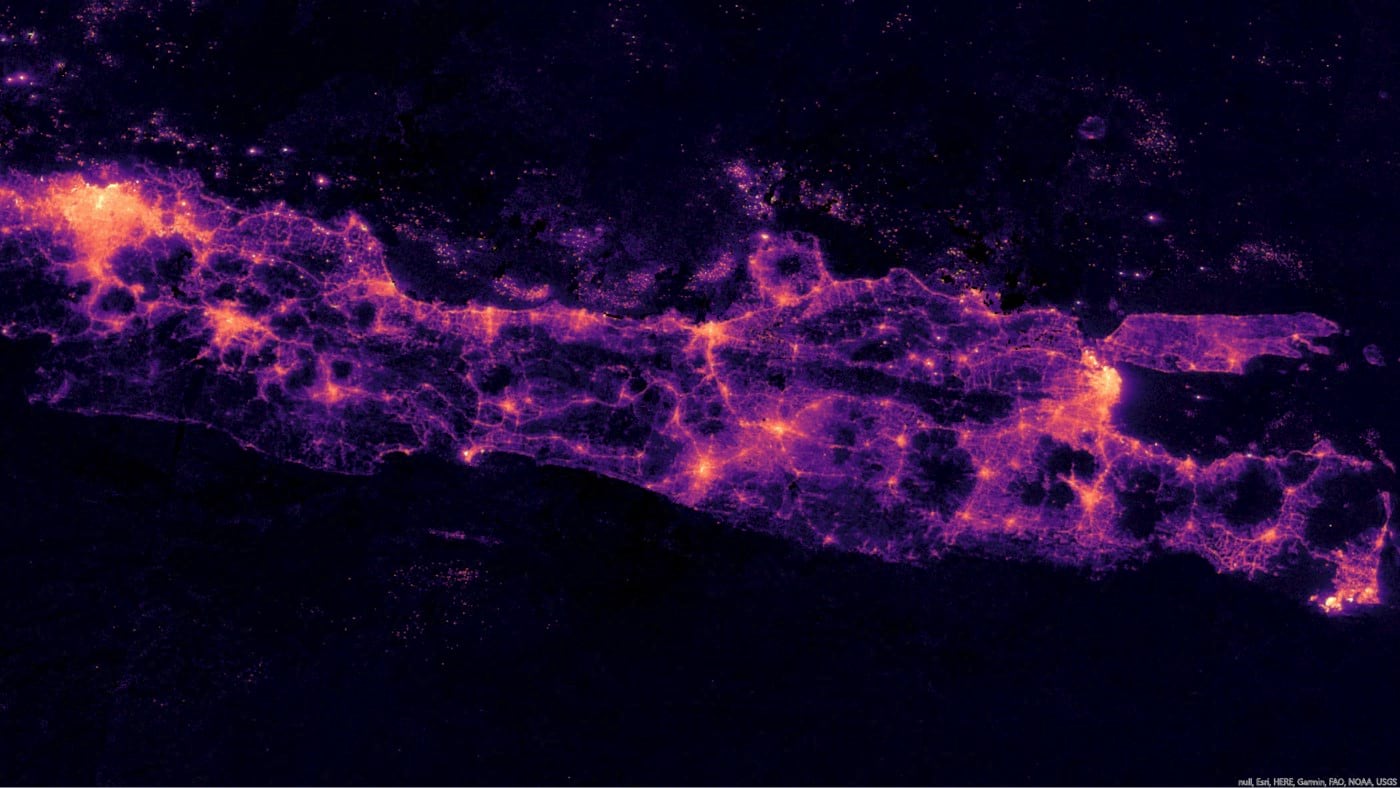
Nighttime Lights - Indonesia - Jakarta to Surabaya
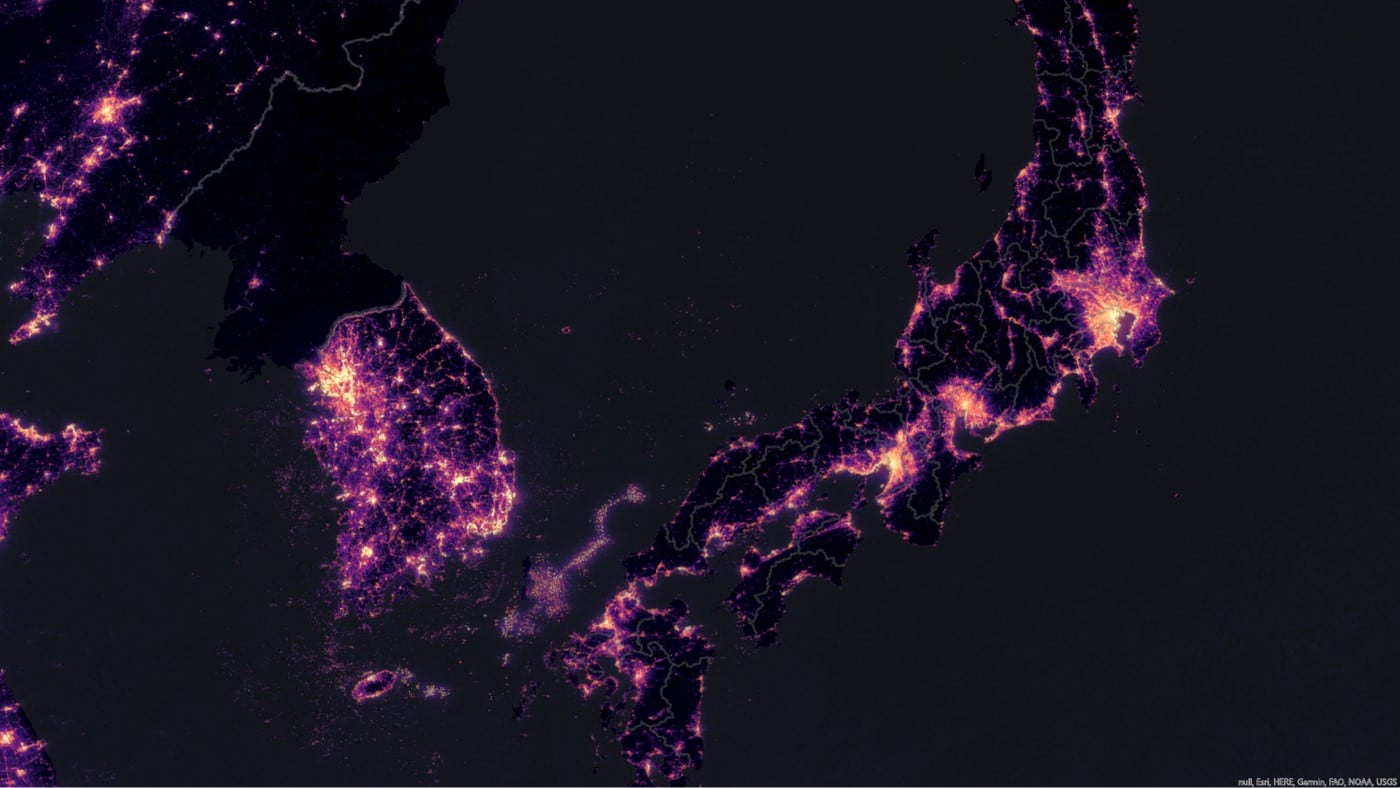
Nighttime Lights - Japan and South Korea
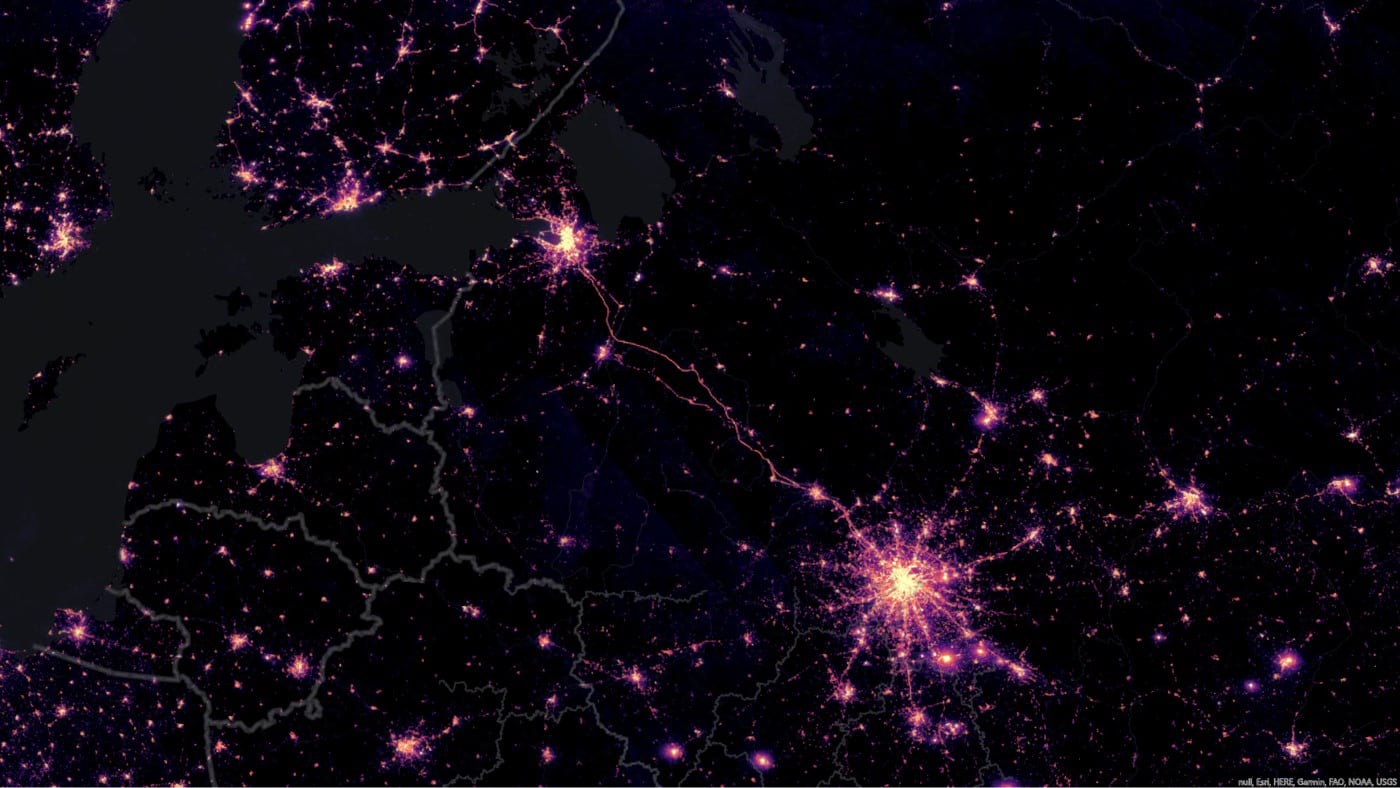
Nighttime Lights - Russia - Moscow to Saint Petersburg
Many thanks to our Living Atlas imagery content development team for making this data easily accessible for Esri users!
Share this article
imagery & remote sensing imagery population viirs arcgis living atlas
Robert Waterman
Robert Waterman leads the ArcGIS Living Atlas Imagery Team at Esri. Robert takes great pride in the work the team does in democratizing imagery and remote sensing, improving accessibility and helping others better understand our planet through Earth Observation with ready-to-use content and capabilities.
James Sill
James is Product Engineer for Imagery Analytics at Esri. James' work is focused on expanding Earth Observation data and analytics available in the Living Atlas. He has a passion for using modern remote sensing, machine learning, and cloud computing to help the scientific and conservation community to gain a better understanding of our planet.


Article Discussion: