Land use land cover (LULC) maps are an increasingly important tool for decision-makers in many industry sectors and developing nations around the world. The information provided by these maps helps inform policy and land management decisions by better understanding and quantifying the impacts of earth processes and human activity.
The National Land Cover Database (NLCD) has long been the standard for land cover mapping in the United States. This year, the USGS announced a major advancement in land cover mapping with the release of the Annual NLCD products. Harnessing the full Landsat data record, Annual NLCD provides a scientific suite of land cover data from 1985 to present. The data products are the result of a confluence of methodologies from past land cover projects together with modern innovations in geospatial deep learning technologies to create the next generation of land cover and land change information.
Esri and the ArcGIS Living Atlas team are providing accessibility to this data in the form of a ready-to-use imagery layer and a web mapping application, the NLCD Land Cover Explorer. Change analysis is essential to deriving information from a land cover time series. One of the foremost capabilities of this app is dynamic change analysis, providing dynamic visual and statistical change across annual slices of the NLCD Land Cover data archive.
This article will serve as a quick-start guide for anyone seeking some context and guidance before jumping into the app.

Table of Contents
Animate Mode
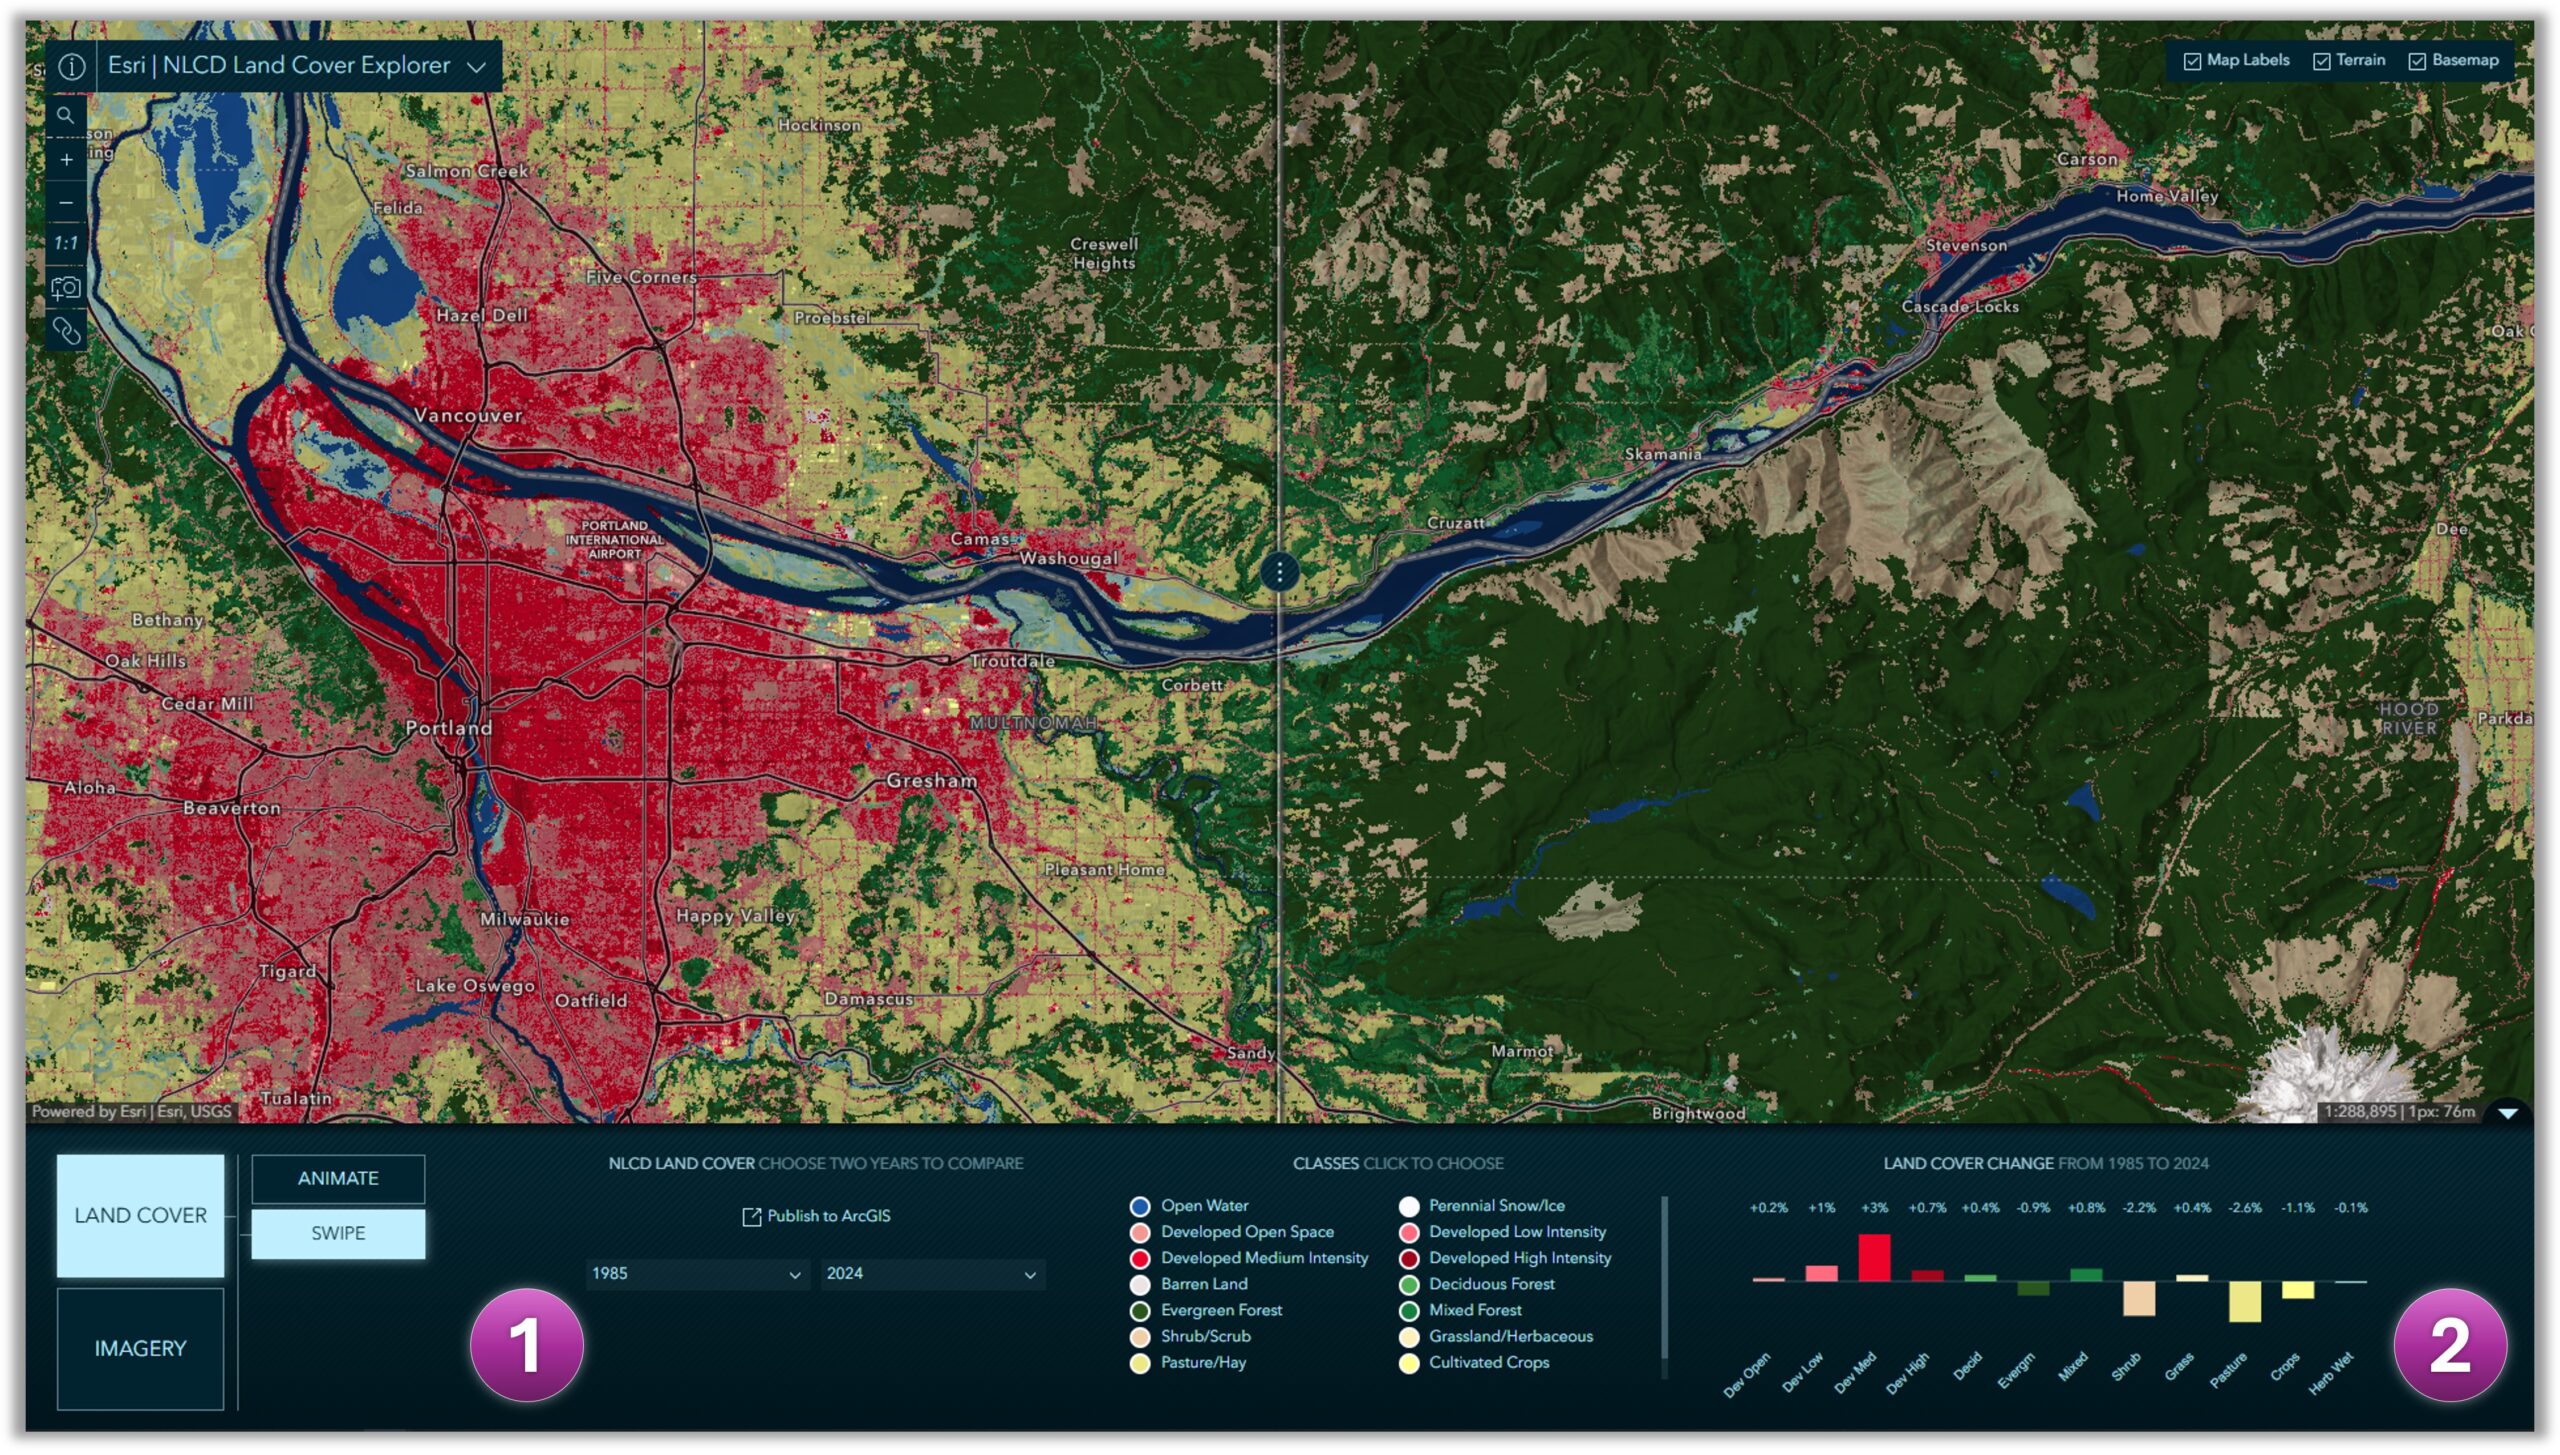
The app opens by default showing Land Cover in Animate mode. As the name implies, the featured functionality of this mode is the ability to create land cover animations to visualize change over time. However, before we get to the actual creation of a time animation, let’s do a quick overview of the app components on screen.
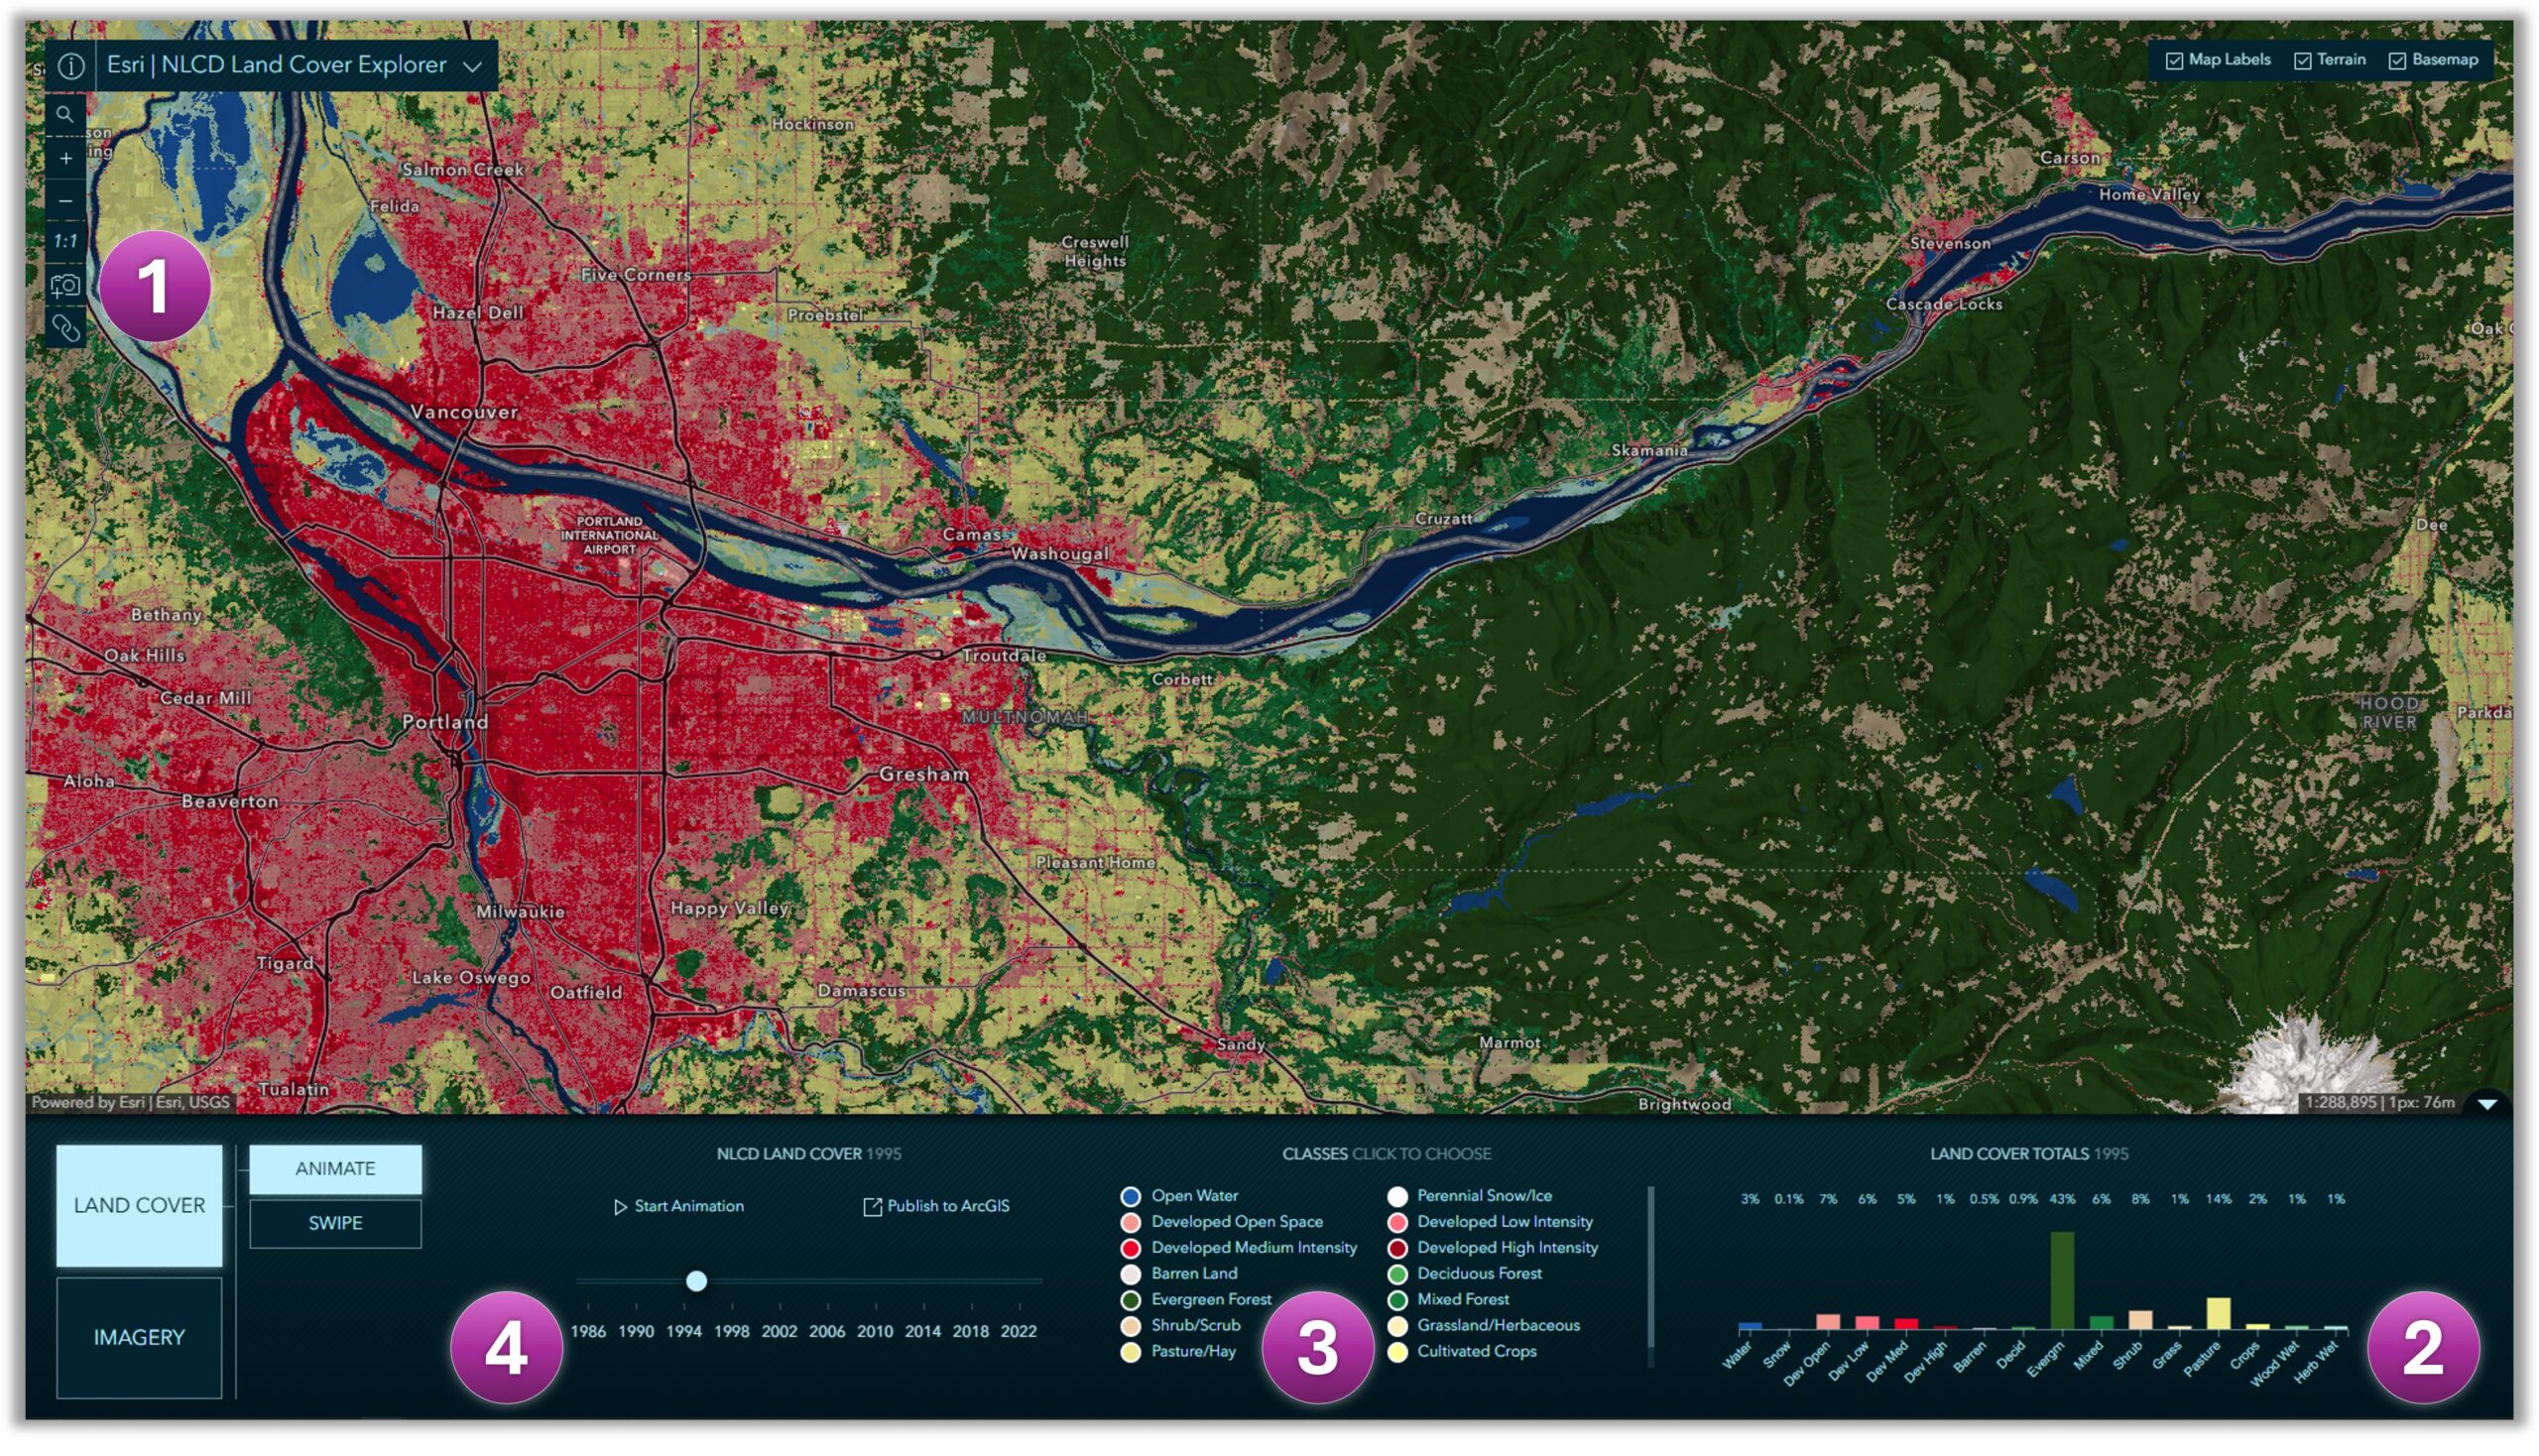
1. At any time, in any mode, this set of map controls here enable you to zoom to the source resolution of 30-m per pixel, to take a quick screenshot of you map display, or copy the URL to the current state of the app to capture and share the current state of the app with others.

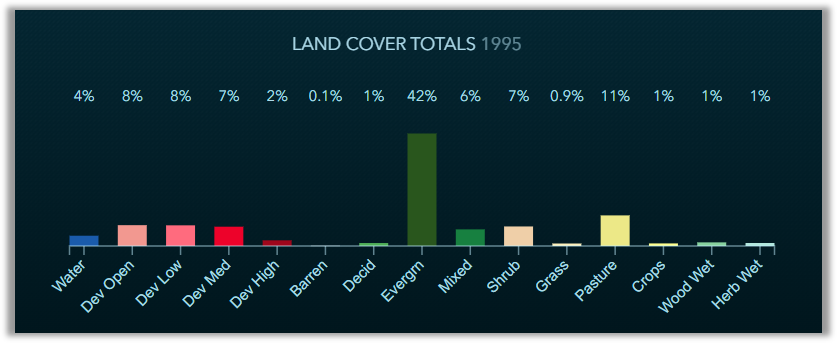
2. The chart displayed in the lower right corner reports the percent of coverage of each class in your current map view. Watch it dynamically adjust with each pan and zoom of the map.
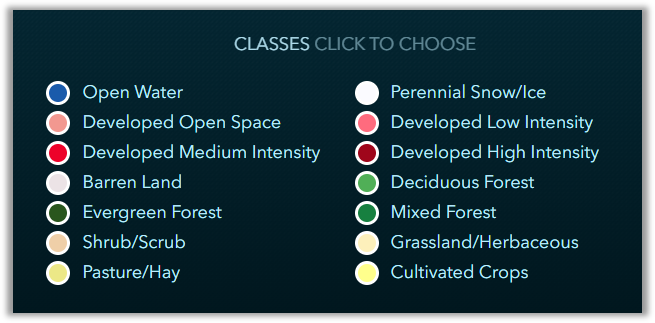
3. Clicking on an individual class within the list changes the map view to only display that selected class.
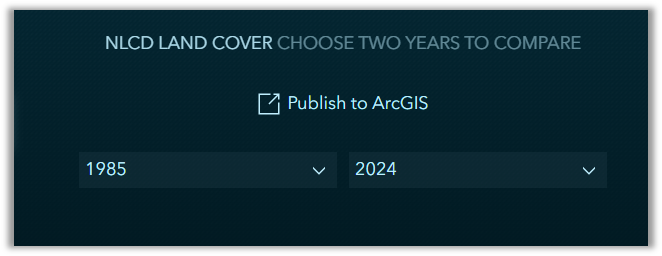
4. Here you can use the timeline to change the current year selection displayed in the map, you can create a web map in your ArcGIS Online organization, and of course you can create an animation.
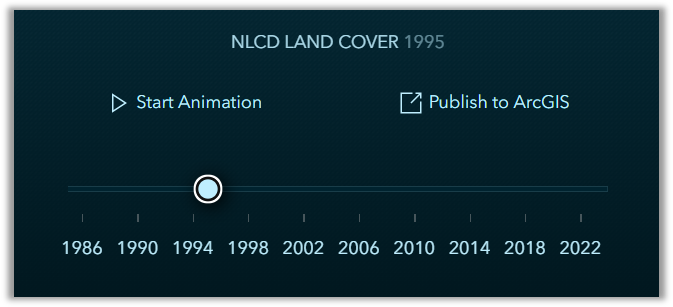
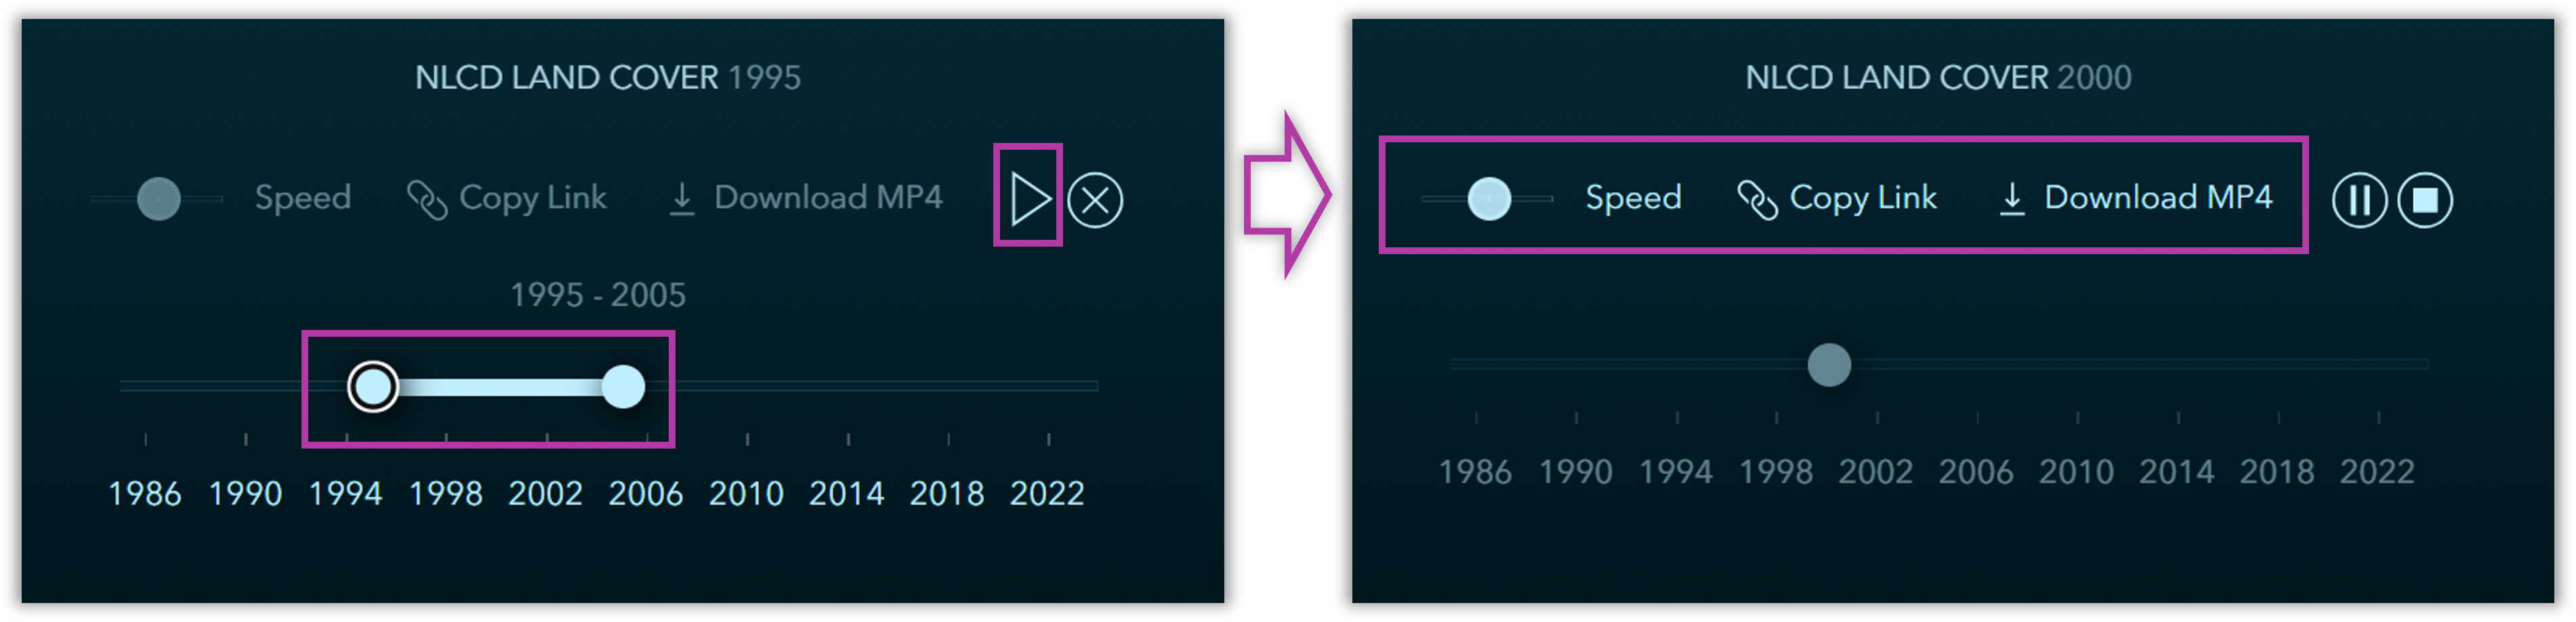
When you click ‘Start Animation’ you will see that your controls now look like the following. You can now use the time slider to define a time extent by selecting a start and end year. Once you have made your time selection you can then press play. When the requested frames have been generated they will begin to play in sequence within the map. You can then adjust the playback speed, share the URL, or download the animation as an MP4 file. The larger the time range, the more frames that need to be rendered.
Below is an animation showing 40 years of land cover change at and around Dulles International Airport, Virginia.
Swipe Mode
Swipe mode provides visual land cover change by swiping between two years. However, it also enables dynamic statistical change as you pan and zoom the map.
1. The controls here allow you to select two different years for swipe change comparison. You can also choose to save your selections to a web map in your organization.
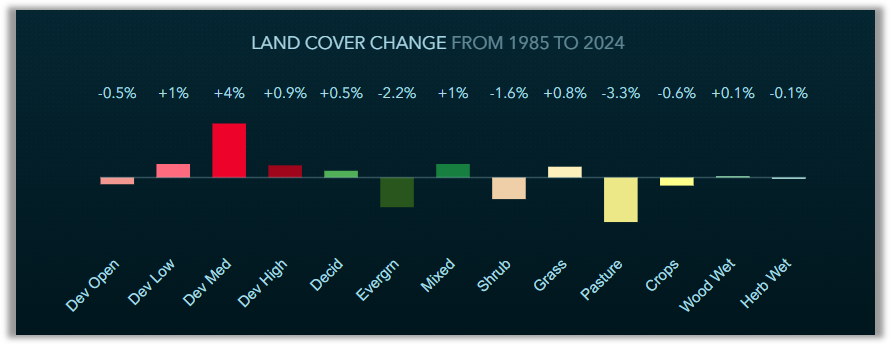
2. The chart in Swipe mode shows the change in percent coverage per class for the current map extent. Watch it dynamically change as the year selections change and as the map extent changes.
Imagery Validation
If you wish to visually validate the land cover classification and land cover change, you can switch from Land Cover to Imagery to display the Landsat Level-2 imagery from which the land cover was derived. With the imagery, you can leverage both Animate and Swipe modes. You can also choose from various multispectral renderings and indices depending on your inquiry. For example, choosing a renderer leveraging Near Infrared and/or Short Wave Infrared can be useful in differentiating vegetated land cover.
Shout out to the team for your diligence in geospatial data and information accessibility…
App development: Jinnan Zhang (aka Supreme Web Developer)
UX/UI and cartographic design: John Nelson
Annual NLCD Land Cover image service development: James Sill, Michael Dangermond, Hayden Hoffmeister

Article Discussion: