Did you know that you can add demographics to your existing geographical datasets? Whether you have points, tables, lines, or polygons, demographic data can add value to your analyses. The blog, “Make a Demographic Map in 5 Minutes”, introduced the basics for using the Enrich Layer tool in ArcGIS Online, and introduced the interface of the Data Browser. Now, we will see additional ways this technique can be applied, using the same underlying process, and still only taking minutes to complete. Each method produces a new layer within your “My Content” which can be used throughout the ArcGIS platform. To get started, publish your layer to ArcGIS Online using your organizational account.
Points
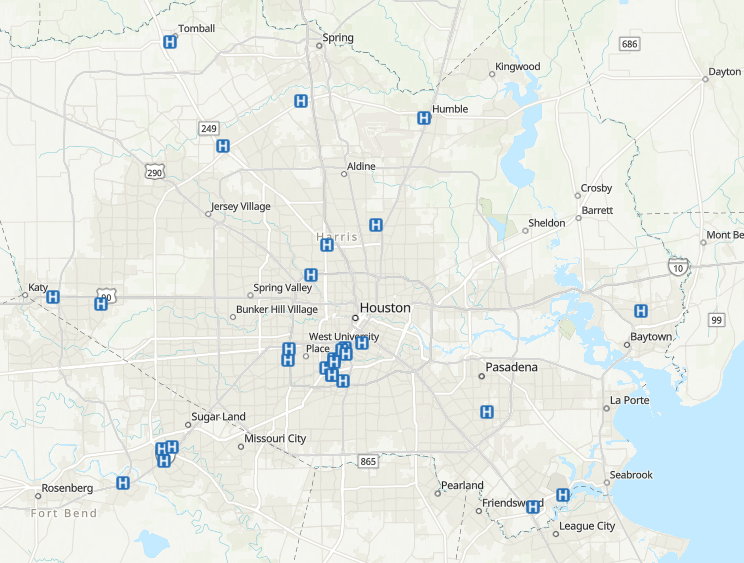
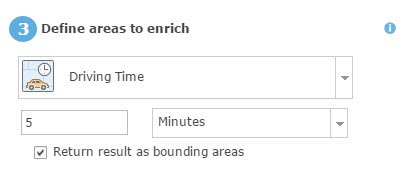
Scenario: You have point data for hospitals in your area. You need to know how many low-income households are within a 5-minute drive for each of these hospitals.
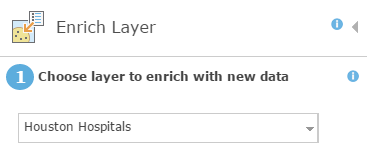
- Analysis >> Data Enrichment >> Enrich Layer >> Choose your point layer
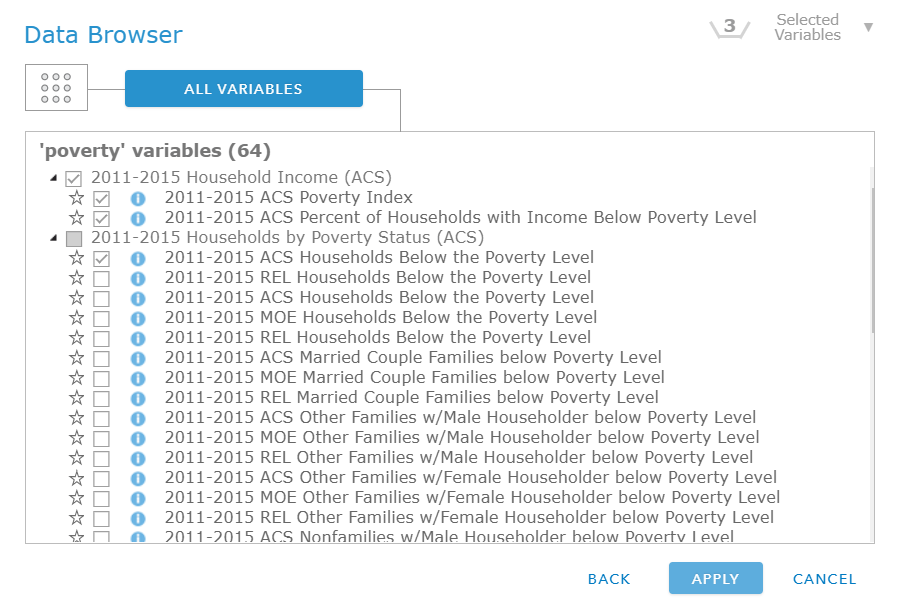
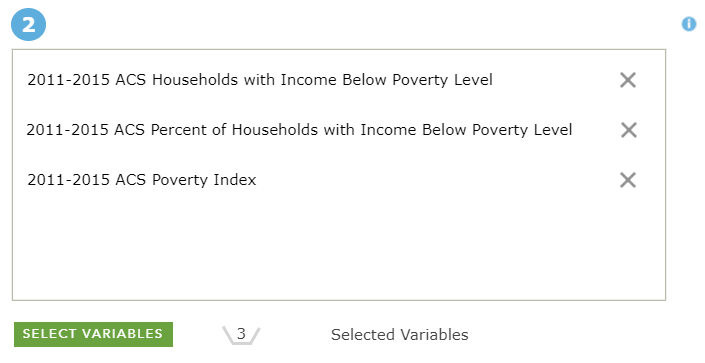
- Select Variables (try searching for ‘poverty’ to find variables related to low-income households. The ACS (American Community Survey) calculates poverty thresholds based on size of family and number of children)
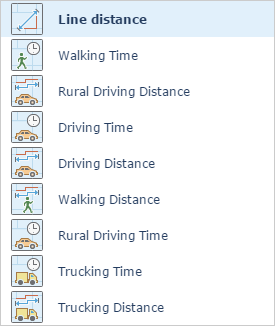
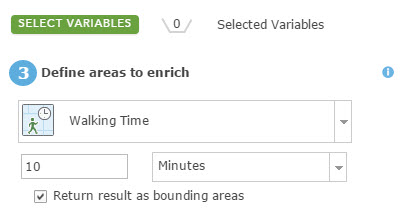
- Define an area to enrich. The options are:
For this scenario, Drive time >> 5 minutes >> Choose “Return result as bounding area”
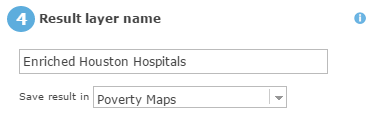
- Choose a layer name and folder >>> Run Analysis
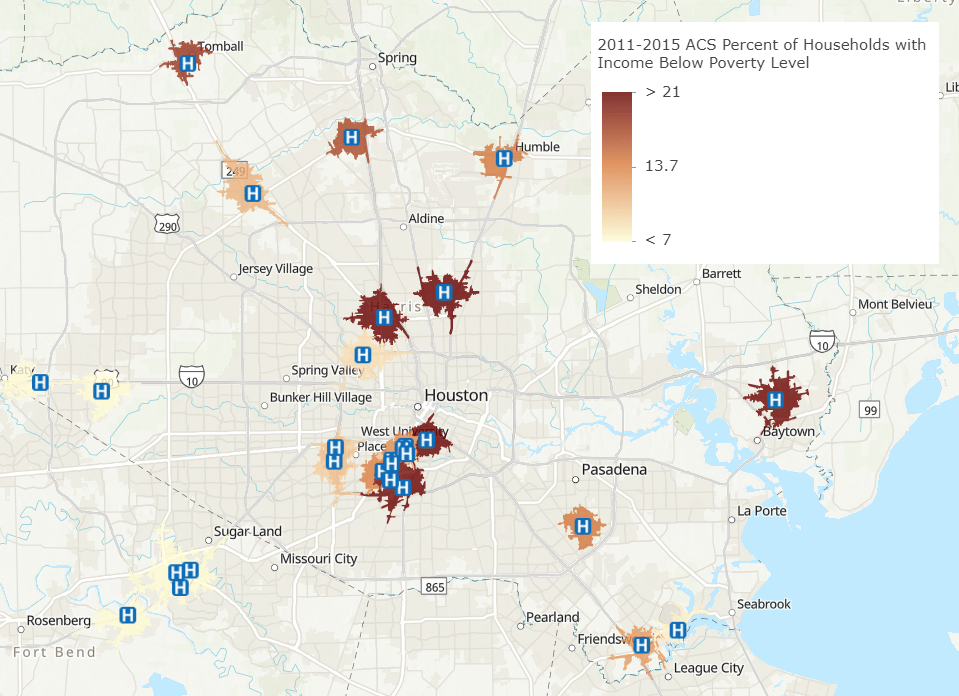
- A new layer will appear with demographics added to your existing data
- Select the variable(s) you want to explore within the “Change Style” option
Tip: If you are looking for hospital points in the US, there is a map available in the Living Atlas of the World
Lines
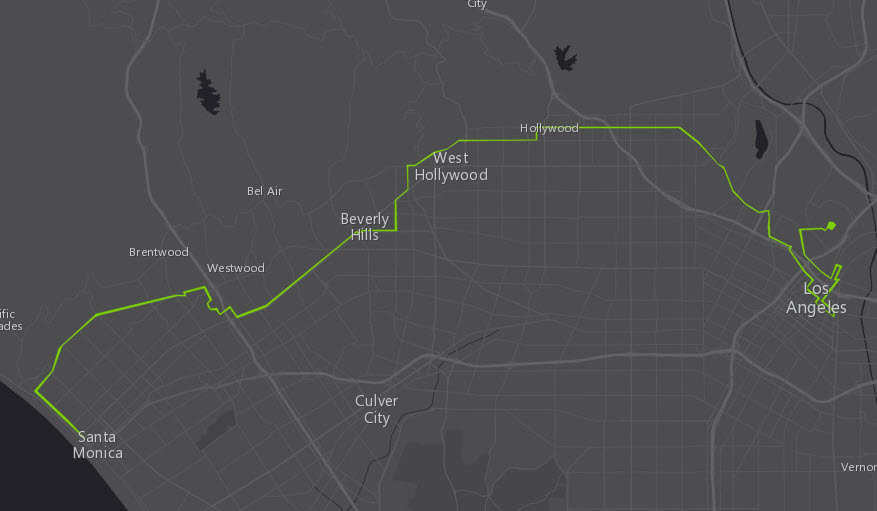
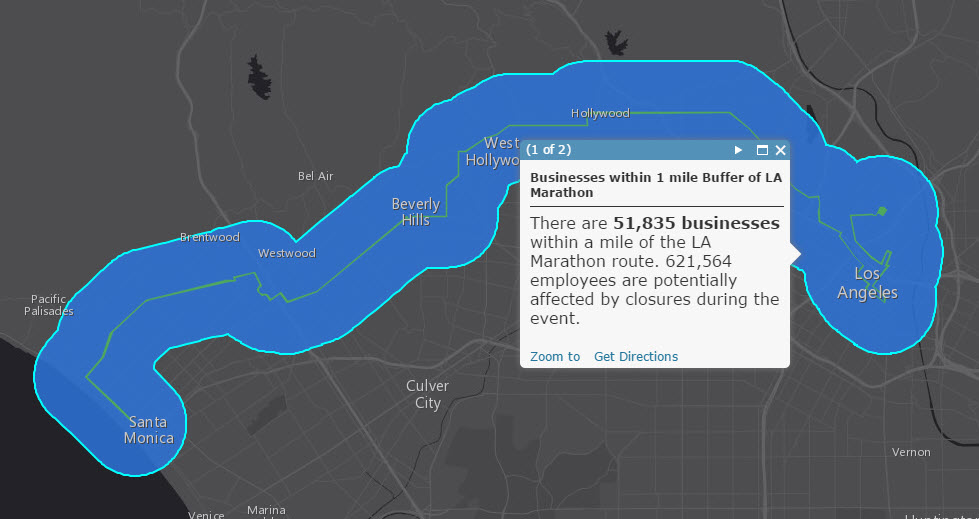
Scenario: You have linear data for the LA Marathon route. You need to know how many retail businesses are within a mile of that route so that you can assess the impact of this event.
- Analysis >> Data Enrichment >> Enrich Layer >> Choose your marathon route
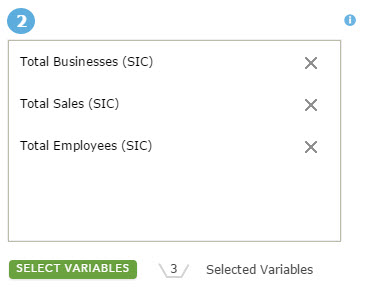
- Select Variables (the “Business” Data Collection is full of variables about businesses, employees, and sales for different NAICS/SIC codes)
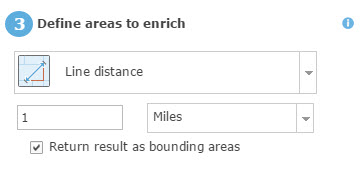
- Define the area you want to enrich (starting to see a pattern?)
- Choose a layer name and folder >>> Run Analysis
- Select the variable you want to explore within the “Change Style” option
Excel/CSV
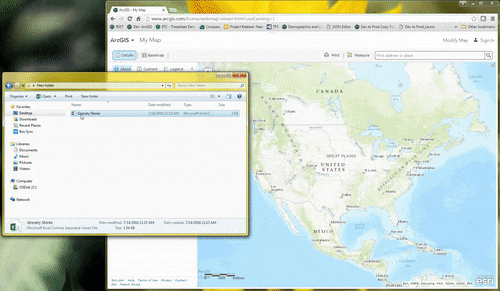
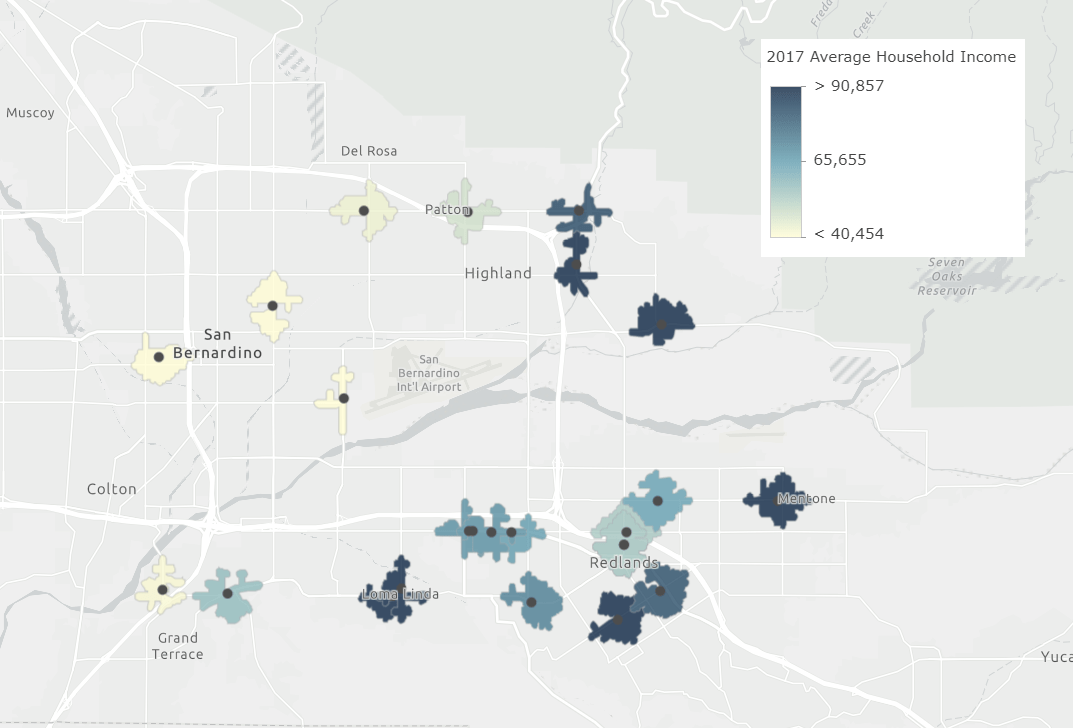
Scenario: You have a table of possible locations for a new grocery store. You need to know information about the income of the people living near these addresses so that you can select an ideal location.
- Convert your table to csv format if it is not already. It needs to include a field with geographic reference in order to be added to the map.
- Drag/drop your csv file straight into the map within ArcGIS Online. The locations will be geocoded onto the map based on your geographic field.
- Analysis >> Data Enrichment >> select the point layer you just created
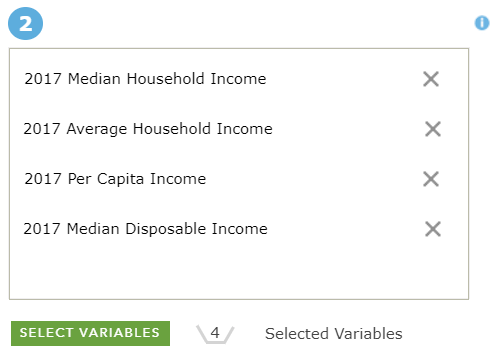
- Select Variables (check out the “Income” Data Collection)
- Define the area to enrich around your location
- Choose a layer name and folder >>> Run Analysis
- Select the variable you want to explore within the “Change Style” option
Tip: you can also do this in Maps for Office and share your layer to ArcGIS Online
Polygons (this was covered in the previous blog, but let’s take a quick look at the process again)
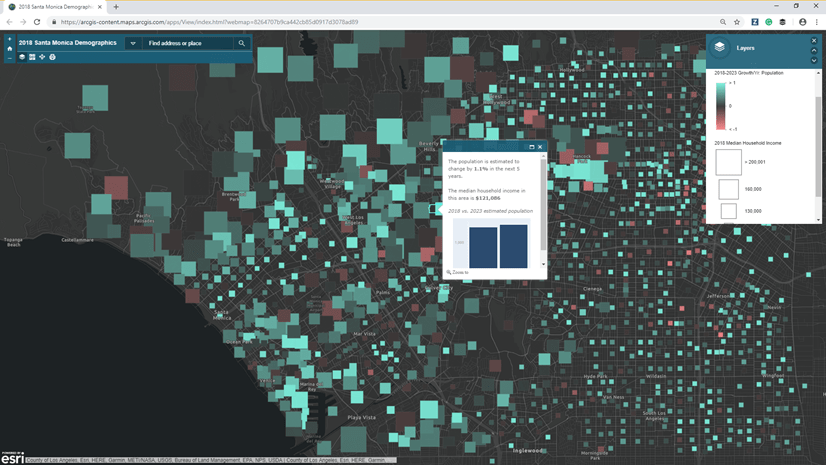
Scenario: You have a boundary of your company’s service area, and you need to know how many people live in the area, and how much growth will happen in the next 5 years
- Analysis >> Data Enrichment >> select your polygon layer as the input
- Select Variables (There are 5-year estimates for some variables, such as population)
- Choose a layer name and folder >>> Run Analysis
- Select the variable you want to explore within the “Change Style” option
Tip: Need your data in ArcMap? Once you enrich your data layer, you can open it in ArcMap using different data formats!

Article Discussion: