Many common GIS workflows involve boundaries. However, the boundaries themselves are often not the main focus of the map or the analysis.
Did you know that ArcGIS Living Atlas – which all ArcGIS users have access to – contains lots of foundational layers and boundary data to support your work? Let’s look at some of these common workflows, and how boundaries layers in Living Atlas often take a supportive role. The workflows we will look at are:
- Using boundaries for supporting symbology
- Joining tabular data to boundaries
- Using boundaries as a clipping layer
- Using boundaries in the Summarize Within tool
Using Boundaries for Supporting Symbology
If you watch the Academy Awards, you may be familiar with the concept of the Best Supporting Actor or Actress awards. The famous line, “The award for best actor in a supporting role goes to…” someone who was not in the leading role, but still critical to the movie. If I could nominate layers for best supporting layer in a map, I would nominate boundaries.
For example, in this map of polygons from survey respondents, we used a state boundaries layer for labels of the state abbreviations, and did it in a highly contrasting color. The polygon fill is set to hollow (no fill), and the outlines are set to a bright pink. The labels for the state abbreviations are styled in that same pink for a cohesive look.
This helps to orient people reading and interpreting this map. The state boundaries and labels are critical to the overall map, while letting the data collected through the survey take the spotlight.

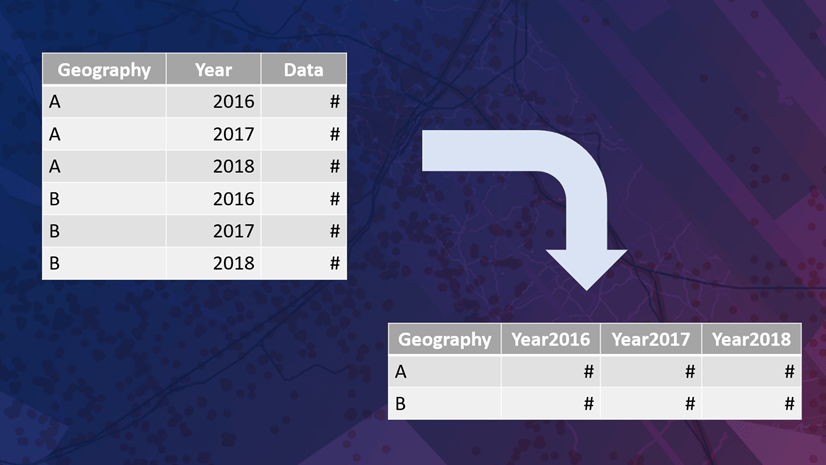
Joining Tabular Data to Boundaries
Many thematic maps start off as data in spreadsheets. Boundaries such as countries, states or provinces, or postal codes are just the rows in the data table. In order to map that data, the table must be joined to boundaries first. To perform a join by attribute (a column in a table), or in order to join features in ArcGIS Online, you need both a table of data, and a “target layer” of boundaries. Many turn to the boundaries category in ArcGIS Living Atlas for their target layer.
For instance, I had a table of the percentage of licensed California childcare providers who offer care during nontraditional hours by county. In order to display that information on a map, I need a target layer of counties to use in my join. Fortunately, Living Atlas has a USA Counties Generalized Boundaries layer that I can use. I added it to my map.

Data Prep
Real data is often messy. There is almost always a big tabular data transformation task to do first. Additionally, you may need to apply a filter or definition query to the target layer, or adjust the parameters in your join in order to get expected results. In this example, the original table downloaded from kidsdata.org needed to be pivoted from long to wide, and then I had to subset the USA Counties layer down to just counties in California.
From there, I performed the join, and was ready to symbolize.
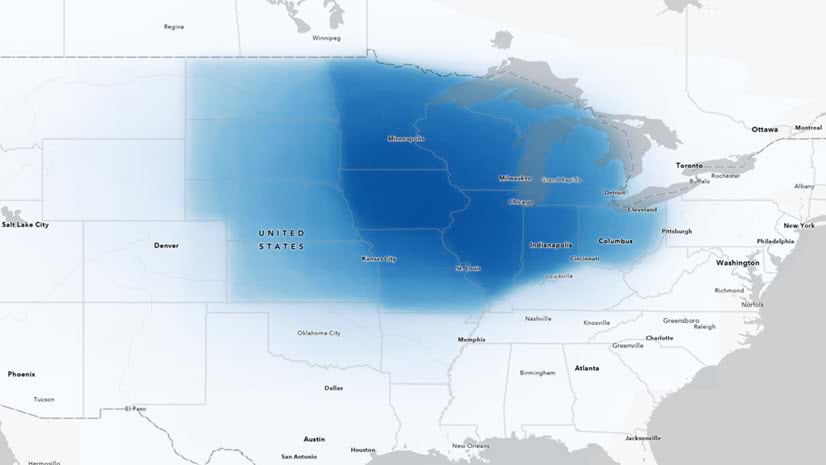
Using Boundaries as a Clipping Layer
A common GIS workflow of extracting global or national data to a specific study area involves using the Clip tool. This enables you to subset the larger dataset based on a “clip feature.” If your area of interest is a standard geography such as a country, state/province, or other popular boundary, check Living Atlas for a layer you can use. Both feature layers and imagery layers can be clipped. Learn more about clipping through these two ArcGIS Tutorials:
- Clip a Layer in Map Viewer (ArcGIS Online, requires a login to complete the tutorial)
- Clip Features to a Region (ArcGIS Pro, requires a login to complete the tutorial)

Using Boundaries with the Summarize Within Tool
Many times, data starts off as dots on a map, such as crowd-sourced data with photos and locations of graffiti, potholes, or wildlife sightings. In order to aggregate or summarize these points up to familiar geography levels (such as zip codes or census tracts), we first need a layer of these types of boundaries.
By now, you can see where I’m going with this. Use boundaries layers from Living Atlas in addition to your own data in the Summarize Within tool in either Pro or Online. This will yield counts (and max, min, average, and other summary stats) of your data.
Potential questions you can answer with this tool:
- How many dialysis centers are there in my zip code? (summarize points of centers by zip code to get the count)
- How many miles of bike lanes are there in San Diego County? (summarize a line layer of bike lanes to counties)
- Which state has the most sightings of garden snails? (summarize the observations by state and sort from highest to lowest)
What are Generalized Layers?

Our most popular items have both a generalized version and a detailed version, in order to support multiple needs. Using the generalized one is often advantageous since it is much less detailed. Fewer vertices mean faster performance.
You might have the need to use the detailed (non-generalized) version if having the detail on a coastline, river, or border is important to your visualization or your analysis. If you are interested in city-scale version of New Orleans for example, you may be willing to deal with the slightly slower or heavier layer if it means having the detail you need in your map or in your analysis.
Detailed (non-Generalized) vs. Generalized

The Item Details page on the generalized layer has notes about the scale at which this layer is fit for use.
The Item Details page on the non-generalized layer has notes about using the fields Land_Type and Land_Rank that separate polygons based on their size. (1 = very small island, all the way to 5 = primary land). If you still want the detailed coastlines on the primary land, but you don’t need all the miniscule islands, filter out those with land rank values of 1 and 2, depending on your needs.
Living Atlas Boundary Items are Here for You
Boundaries are foundational content for GIS analysts, second only to basemaps. ArcGIS Living Atlas provides curated, high-quality boundaries to support your work.

In Map Viewer, open the Layers pane and click Browse Layers. Select From Living Atlas in the dropdown options, and search away. Our items are updated regularly, to ensure that you have the best available geographic information. Check the Item Details pages for item-specific information on the update cadence.
Some of the most frequently requested boundaries are available today:
- World Administrative Divisions (commonly known as “Admin level 1”)
- World Countries (both generalized and detailed)
- World Regions
- World Continents
- USA Zip Codes
- USA Telephone Area Codes
- USA Counties
How are you using boundaries from ArcGIS Living Atlas? Are there additional boundaries you’d like to see? Let us know in Esri Community.

Article Discussion: