After 50+ years working as a cartographer, much of it dealing with complex reference maps for print as well as the online basemap work I do now, I’ve built-up quite a bit of experience. I’ve been through a number of technical and production evolutions (as I discuss here), and I’ve taken an active role in the transition from manual to digital to online work (and beyond).
So how do I do that? This is an attempt to write down some of the things I have learnt over those years. I’ve created a series of ArcGIS StoryMaps stories looking at different aspects of how I work and how I think. They deal with my personal working methods, and they are by no means the only way of reaching a final product. Hopefully you find them useful, but ultimately you will need to work out what is best for you.
This blog article links to them.

Planning and Executing a Map Project
Over time, I’ve developed my own techniques for getting started on a map or series of maps, and seeing the project through to its conclusion. This outlines what I have learnt.

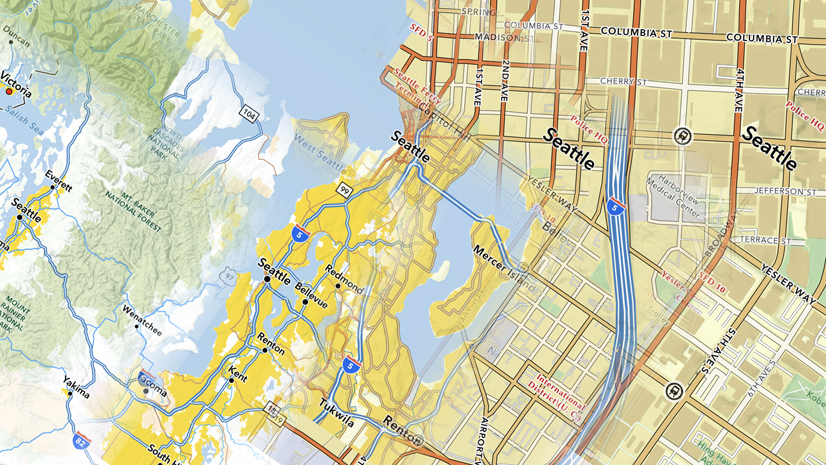
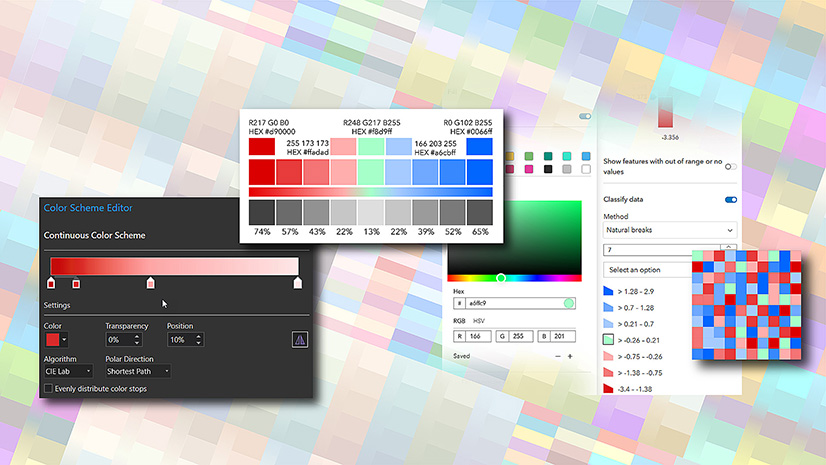
Working with Color
I’ve been working as a map designer for most of my career. Starting in black and white, then working in color for print (CMYK), to on-screen (RGB) and now online (HEX), I’ve developed a deep understanding of how color works on maps. Here are some of the techniques I use.

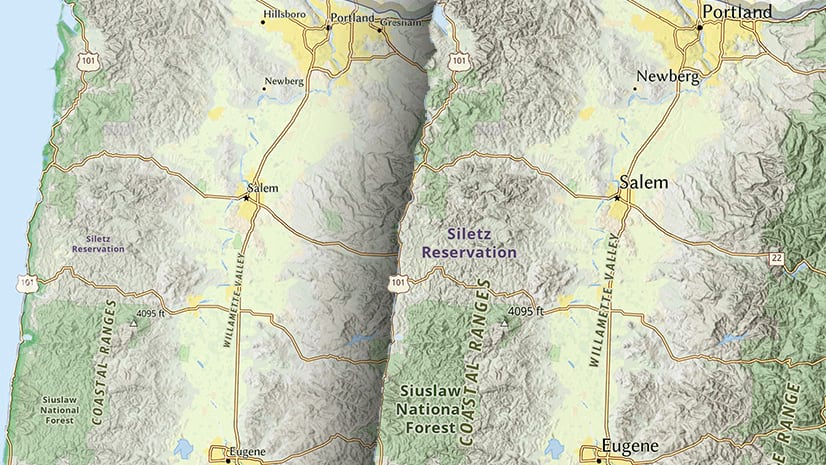
Building for Vision Deficiency
I’ve been designing maps for many years, but it is only recently that I have started to consider accessibility as part of my decision making. An admission though – not all of the maps I build, even now, are accessible! I try to do what I can, but it’s a learning process for me as well. These are some techniques and guidelines that I try to work with.

Extreme Labels
It’s been a constant throughout my career! I’ll create beautiful, colorful and informative map detail, then have it disappear behind an impossibly dense, but equally important, label distribution. This is a look at ways of fighting back.

Maps and Printing
It is only in the last 15 years that I’ve been working online. Before that my work was for print, and I’ve been in a good position to watch how things have changed. These are some of the techniques I used back in the ‘old’ days…

Working for Print in ArcGIS
I don’t work too often for print these days, but occasionally I’ll dip my toe into that water again. Usually, given that I work for Esri, that means using one of the ArcGIS products. This is a guide to the capabilities, and the potential pitfalls, I’ve found working in ArcGIS for print.

Lines and More Lines
There are so many line symbols that we try to work into our maps (more than we should sometimes), and there is a temptation to introduce all sorts of different effects to resolve the conflicts. But should we?


Article Discussion: