Can we all agree that a good map helps the user navigate to the most important information?
OK, good. Now with that in mind, let’s play a little color game. Take the five randomly arranged colors below and rank them in some order of importance based on how your eye is attracted to them.

I get something like this:

But what if I told you that the “correct” order should be like this:

The brightest dayglow yellow color that grabs your attention is actually of relatively low importance. Herein lies the issue with color choice on the U.S. Drought Monitor.

It is a map of great value, informing everyone from farmers to water managers on the current status of drought across the U.S. It is also available in the Living Atlas of the World using the original symbology. Which, thankfully, can be tweaked. So how can we break this down and make some simple improvements?
To do this, we need to understand three important attributes that are affecting how this map is interpreted: scale, brightness, and saturation.
SCALE
Because the lowest value (D0) is almost always the largest area, its sheer area automatically weights its importance. When taking scale into account, that first image would actually look something like this:

So not only do we have to account for D0’s dayglow appearance, but also its spatial dominance. This dominance is further enforced by the fact that D0 is always on the periphery.
BRIGHTNESS
One of the first things we learn about color theory is that the human eye is far more attentive to brightness than hue. This prominence is also what creates banding artifacts in typical rainbow color schemes.
Brightness is simple to break down, especially if you use the HSB color space rather than RGB. If we arranged the original colors based on brightness we get:

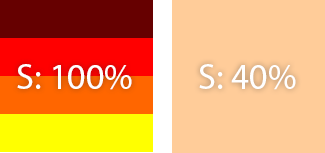
SATURATION
Brightness and saturation can sometimes be at odds with each other. While we cue in on brightness, we also infer magnitude from saturation. When these two bounce around a lot, we can create cognitive confusion. The saturation of the original goes like this:
A SIMPLE FIX
So how do we make one simple fix to this map? Let’s start with color and scale should fall into place. I like to start with my end colors and work my way to the middle.
To me, some of the most intuitive maps have a constant gradient of both saturation and brightness. Each interval of data has an equal change in those values. With the help of a spreadsheet, I plot out the HSB (and add in the matching HEX for simple copy/paste into the map).

We can see that yellow and red color are separated by 35 brightness and 70 saturation values. To create my intermediary colors, I’ll make equal intervals at each step from the bookend H, S, and B. Brightness will decrease (since I’m using a light basemap) and saturation will increase.

Pretty simple, right? Now nothing in theory is ever perfect in application. You’ll get some very wonky colors that will need to be tweaked. For example, to get good contrast on D4 for its relative importance, I needed to have greater separation in its brightness.

I swapped out the default colors in an ArcGIS Online web map. The resulting map draws the eye to the most intense drought areas, and the eye gradually moves outward into less drought stricken regions. You can use this swipe tool to compare the two versions.
Want to use the revised color palette for the weekly-updated version of the U.S. Drought Monitor in your web maps? Here is the service: USA Drought Intensity (Current Conditions) – revised colors.
Have questions or comments about this blog? Post them in our GeoNet.


Commenting is not enabled for this article.