Earlier this year Satellite VIIRS Thermal Hotspot and Fire Activity from NASA’s Land, Atmosphere Near real-time Capability for EOS (LANCE) Earth Observation Data, part of NASA’s Earth Science Data was made available in Living Atlas as a Live Feed. This global layer represents the most frequently updated and most detailed remotely sensed fire information. Detection attributes include time, location, and intensity and it can be used to track the location of fires from a few hours ago up to seven days behind real time.
Fires Vary in Nature from Place to Place Around the World
These detections show many interesting hotspots around the world.
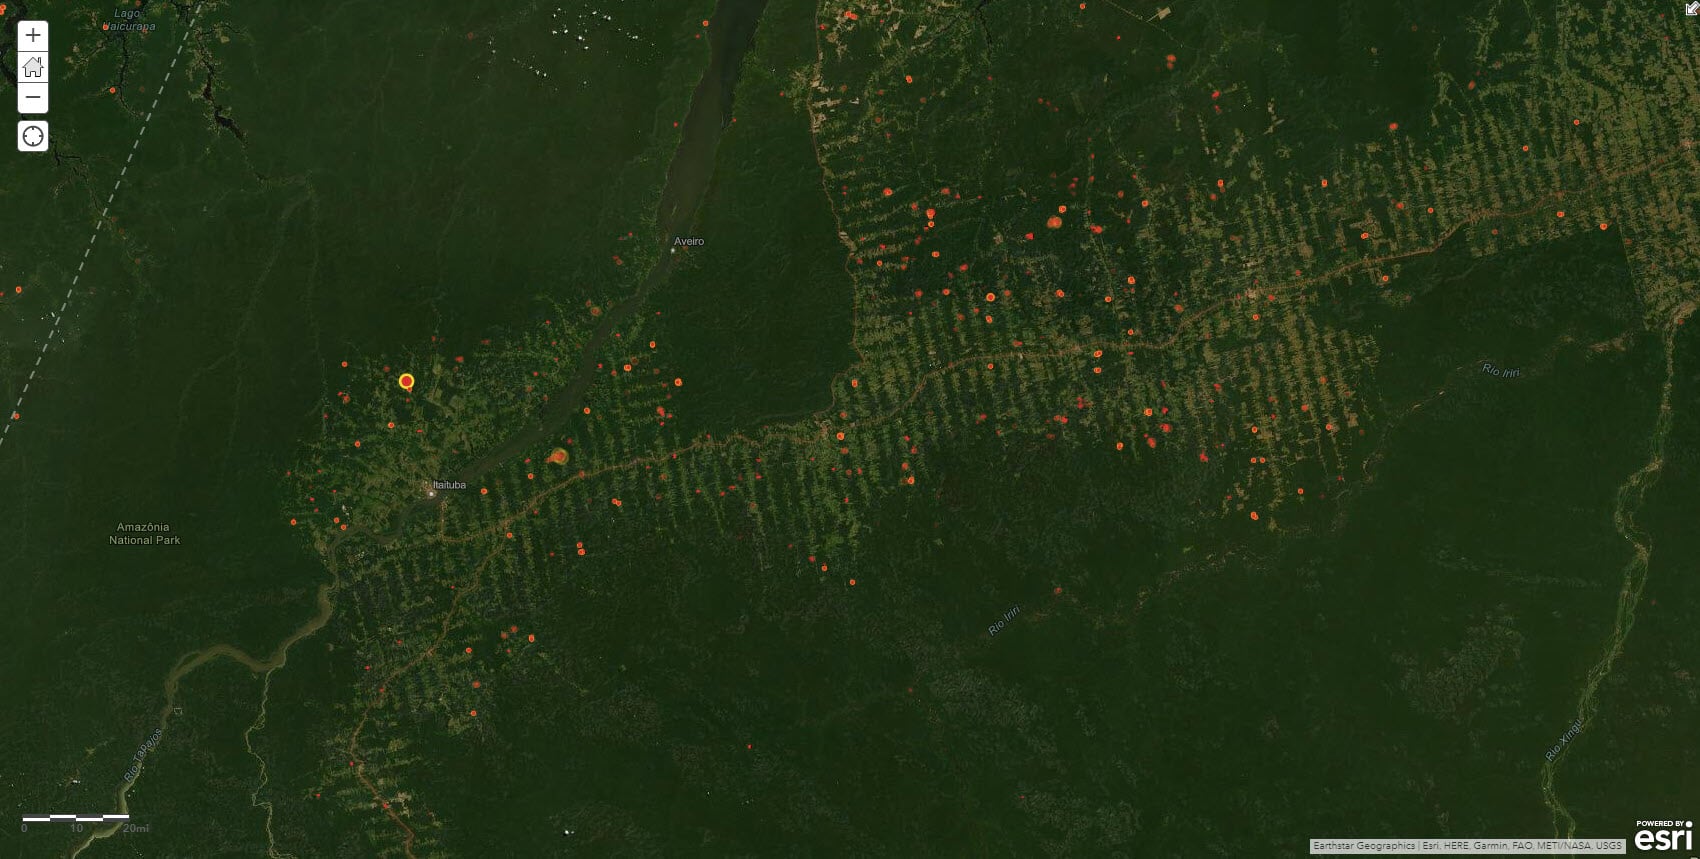
For example, here in Itaituba, Pará, Brazil we can see conversion from forest to farmland taking place, using fire, just to the east of Amazônia National Park.
Flaring can be seen where oil and gas production is active like here near Basra, Iraq.

You can see the thermal signature of Mount Nyiragongo volcano in Virunga National Park, Democratic Republic of the Congo.

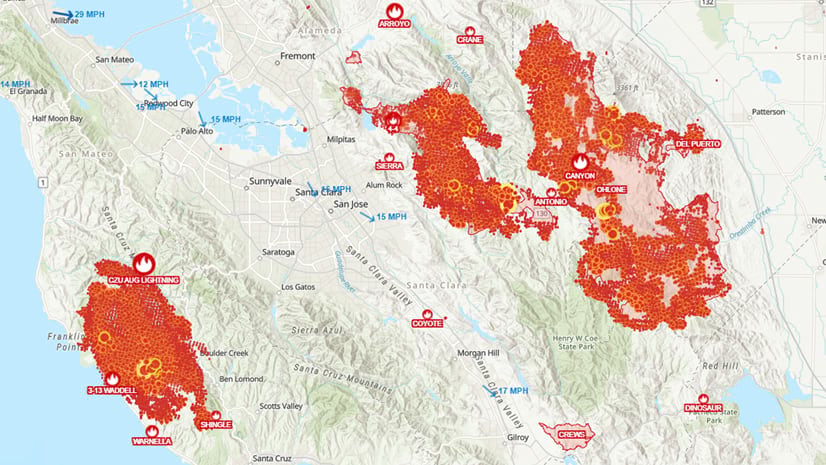
In the western United States the layer has been used to track wildfires as shown here in California.

Using VIIRS for Mapping Wildfires
Example 1: Versatile by Default
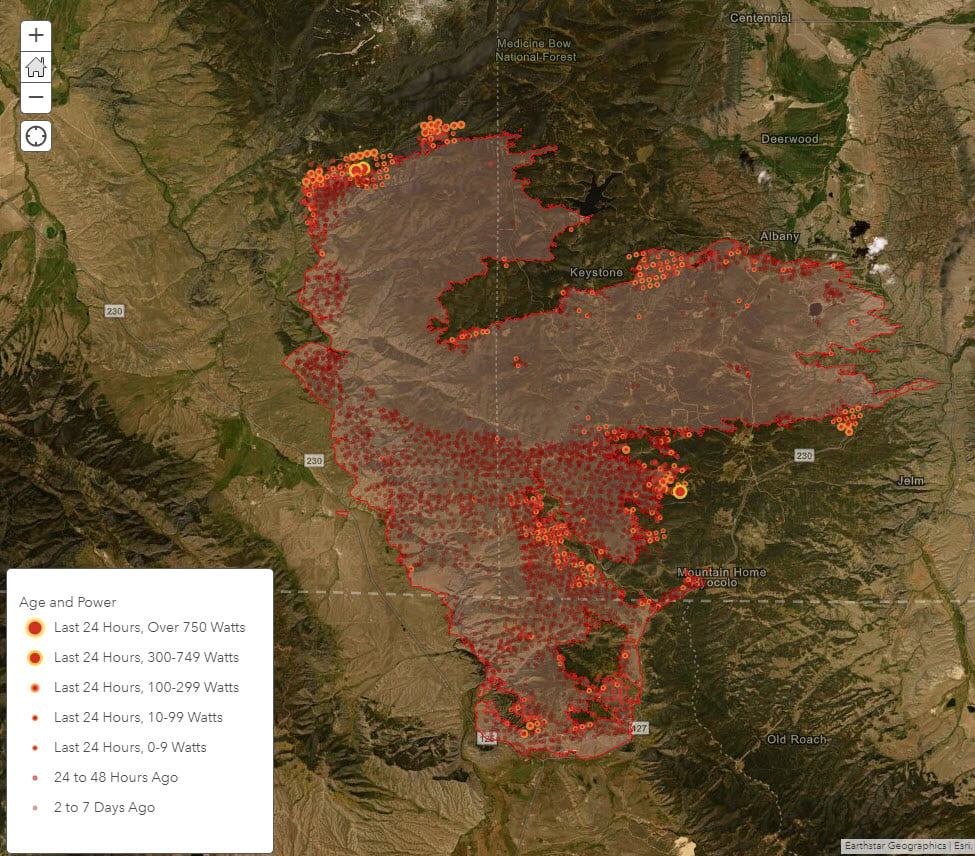
The layer’s default symbology is designed to be functional and for all-around use globally. Right out of the box from Living Atlas it can be easily added to your web map or Pro project to display the location and characteristics of fires happing right now through the past seven days. It’s already set up, with the cartography and popups are ready to go, and it also was designed to work with most of our stock light and dark basemaps.
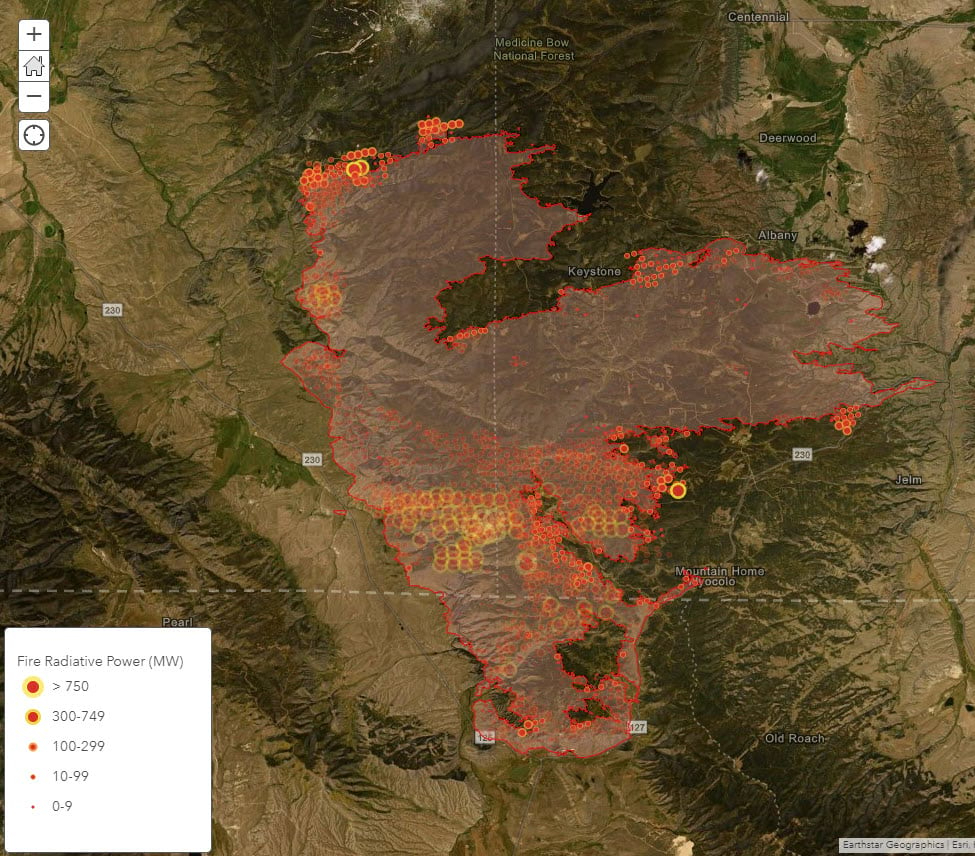
You can see here on the Mullen Fire in Wyoming and Colorado that the big symbols with yellow halos show where the fire was burning with the most power. As time goes by, the points fade away, just like memories do. The places on the fire’s edge with the most current fire detections show up bright red and orange, grabbing your attention.
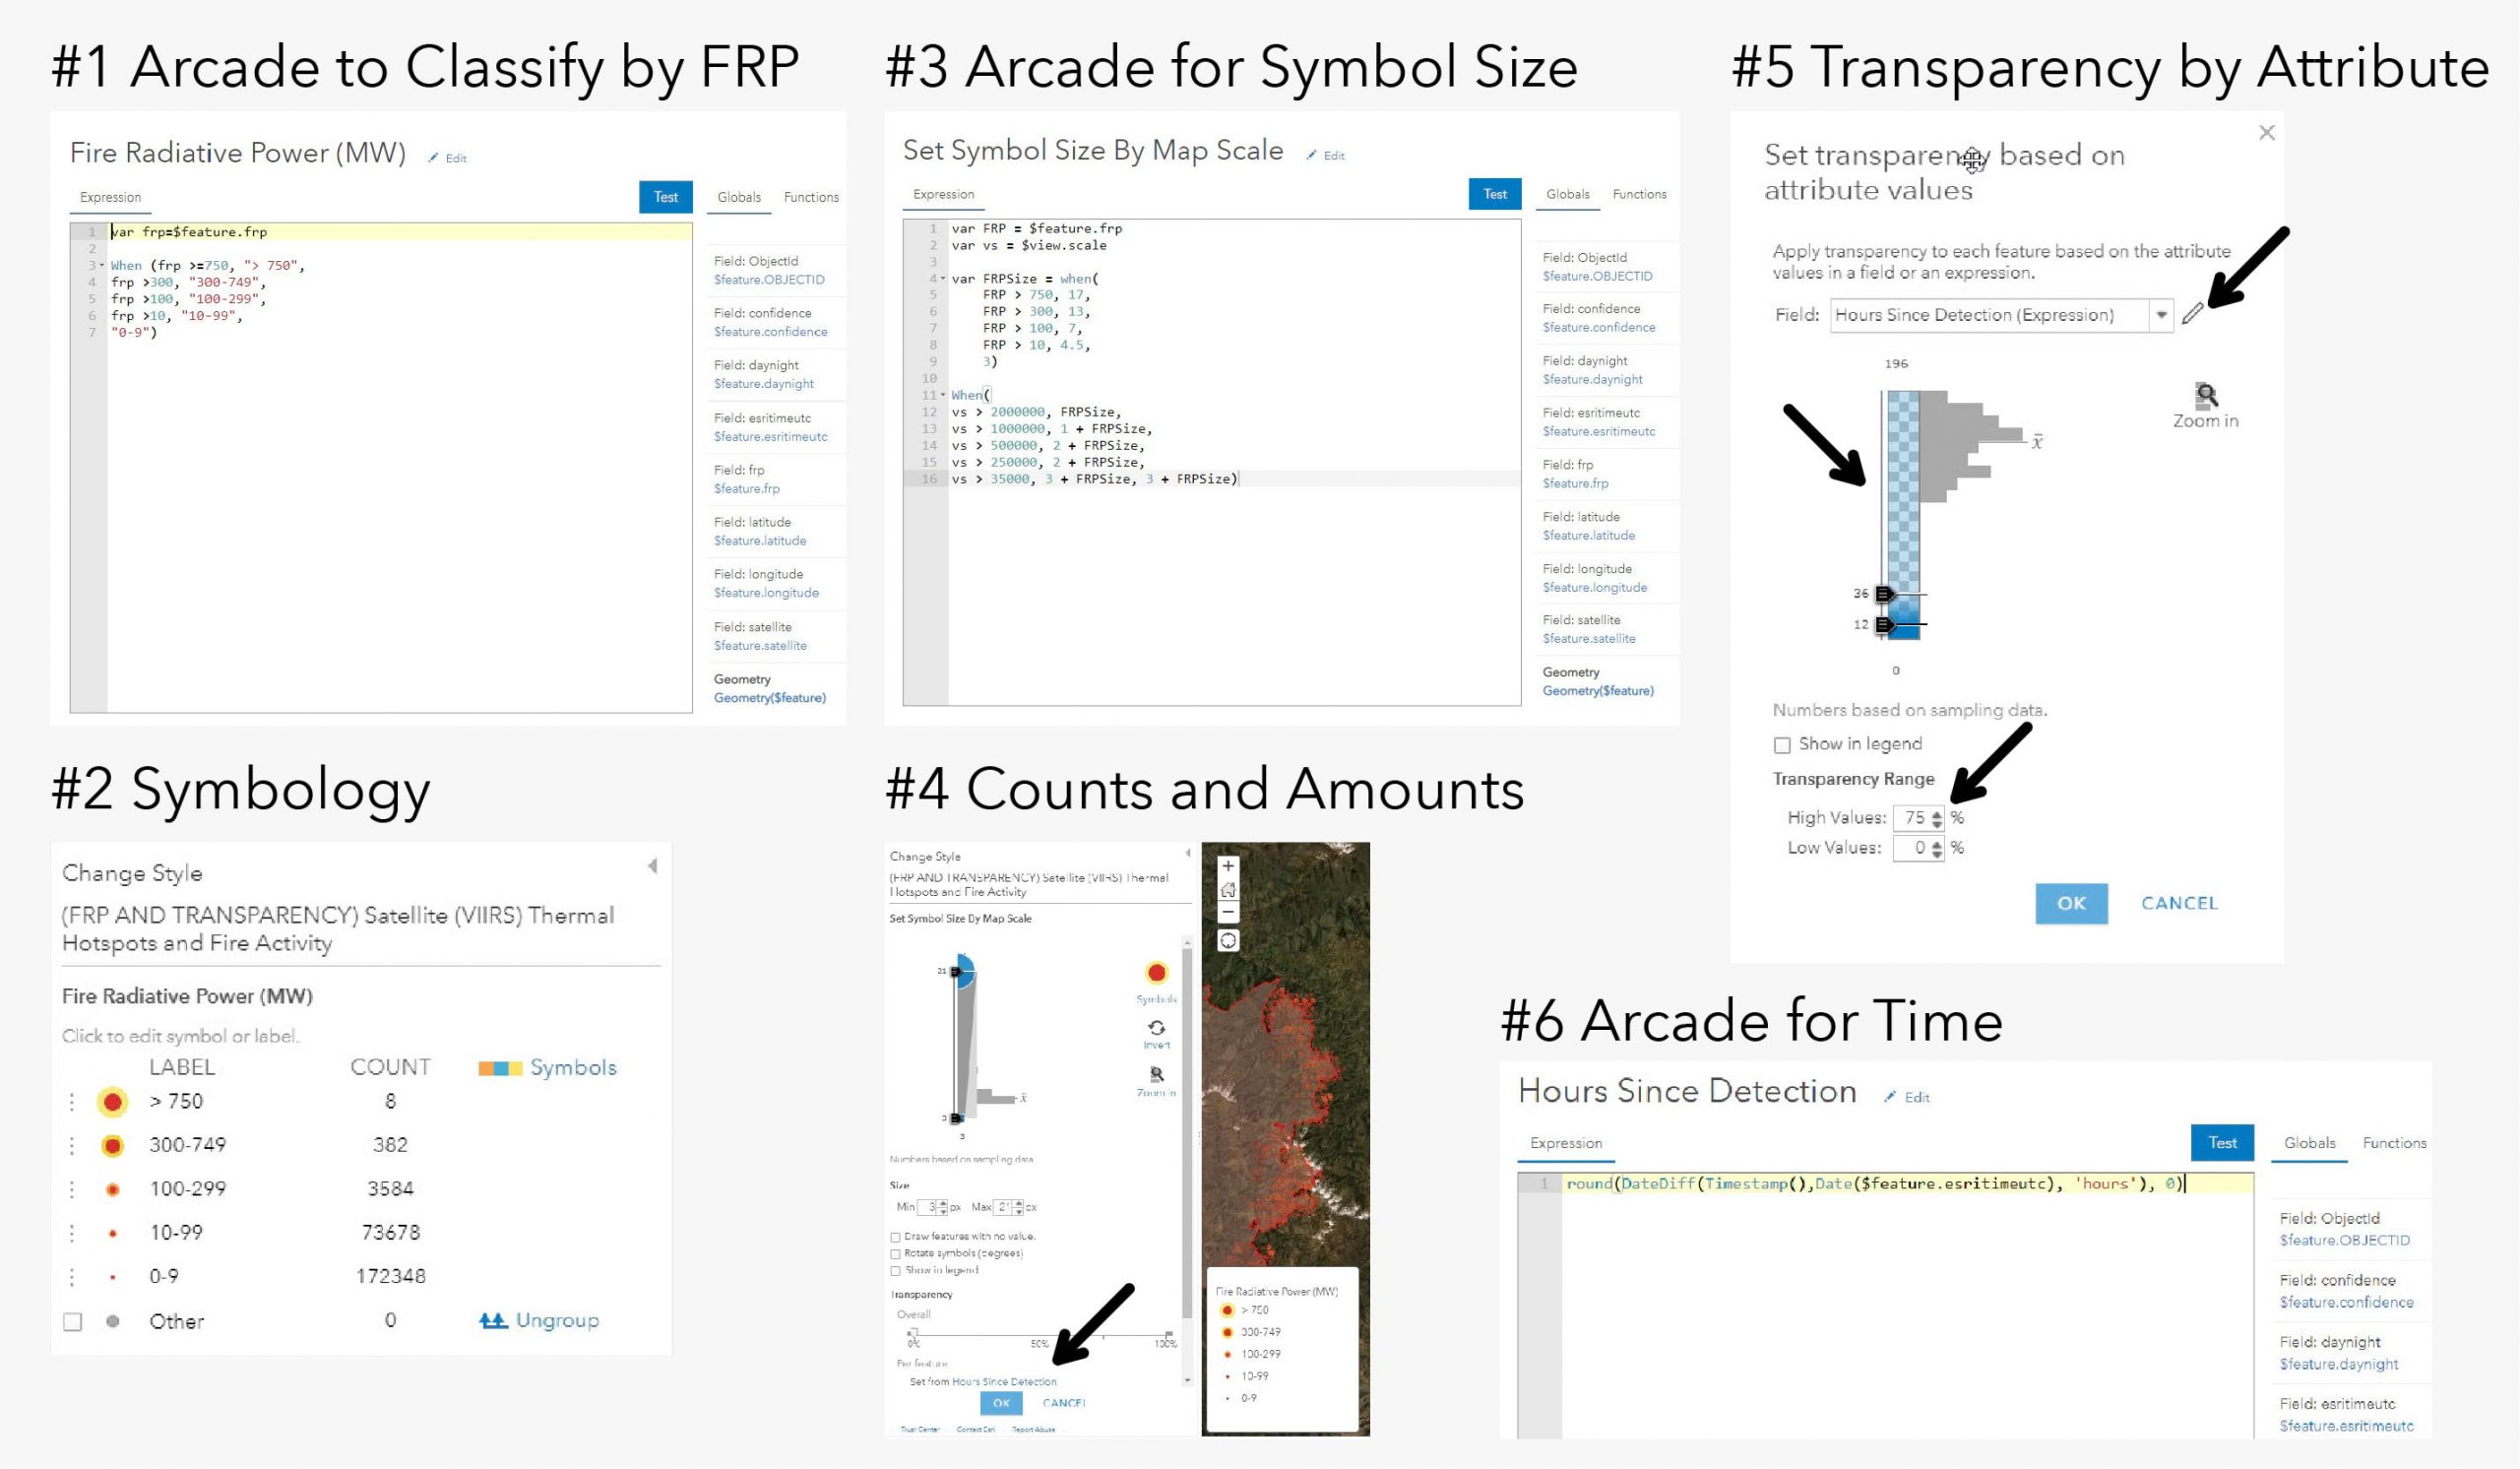
Let’s take you behind the scenes of the default symbology a bit. Five symbol sizes express the Fire Radiative Power (FRP) as detected by the VIIRS satellites, in megawatts. As time goes by the symbols fade, but how does the service do that? What’s the technique?
On social media we see people’s urgent questions: Where’s the fire now? Which way is it headed? What has burned already?
What’s most meaningful to people is finding the most current information, that’s the impulse to track fires using an Esri Live Feed service. They want what’s currently burning to get their attention. However, by default hotspots in the VIIRS detection and fire activity layer start to become more transparent just 24 hours after detection. When we get to one week since the detection, it fades to become a mostly transparent symbol.
In Arcade we made an expression that symbolizes all the detections by how many hours ago they occurred. This is the most meaningful aspect of time when tracking a fire. Symbolizing by the fire’s date is a bit abstract and can be distracting. Even worse, the satellite detections have their date in Coordinated Universal Time (UTC). This is a global map and there may be detections with tomorrow’s date on them. Using Arcade we can get the time right now in UTC using the timestamp() and datediff() methods to subtract the time in UTC of the detection from the time the actual map is being read in UTC. This is the way to get the UTC time out of the way, and round the number of hours ago the fire was detected to the nearest hour.
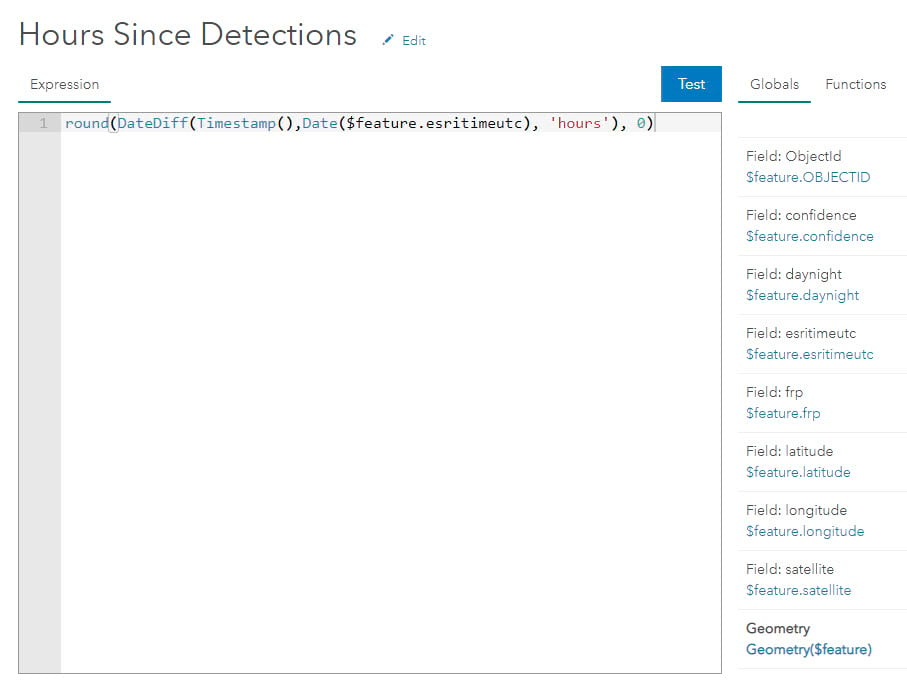
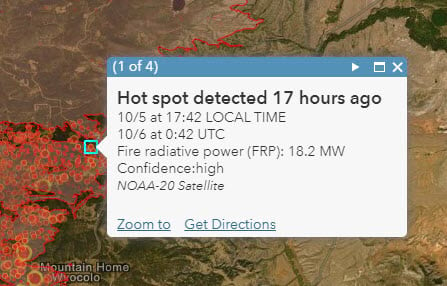
This gives us a much more relatable way to symbolize the map and indicate how current the fire is in the map popups which also leverages this expression.
Example 2: Symbolize Current Detections by Power and if it’s 2-7 Days Old, Symbolize by Time
We just learned that the default symbology relies heavily on transparency to visualize global heat detections and their intensity. Maybe though you’d prefer only to see the power of the fire if it occurred in the past 24 hours, and if it happened over a day ago you don’t particularly care about how powerful the fire was? Let’s say you are watching a wildfire burn near your home and wondering which side of the fire is still burning, where is it going, and how that might affect you?
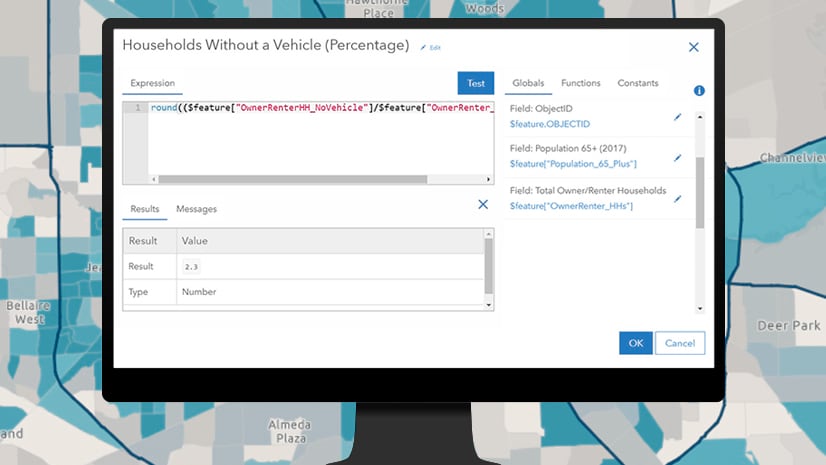
ArcGIS Online has dynamic tools for showing two variables at once. If we show the fire’s power and the number of hours since it occurred, we can end up easily with 15-25 symbols on the map. People stumble to interpret the points, and the legend gets very long, like a grocery store receipt. Again, we can use Arcade to trim it down to the most meaningful seven symbols. We can show the fire’s “current” intensity, then if it’s not current, show a dull symbol for detections 1-2 days ago, and duller still for fires 2-7 days ago. With this visualization on the Mullen Fire you can see that there is higher intensity growth on the northwest and east areas of the fire and lighter activity across the interior on the southern half of the fire.
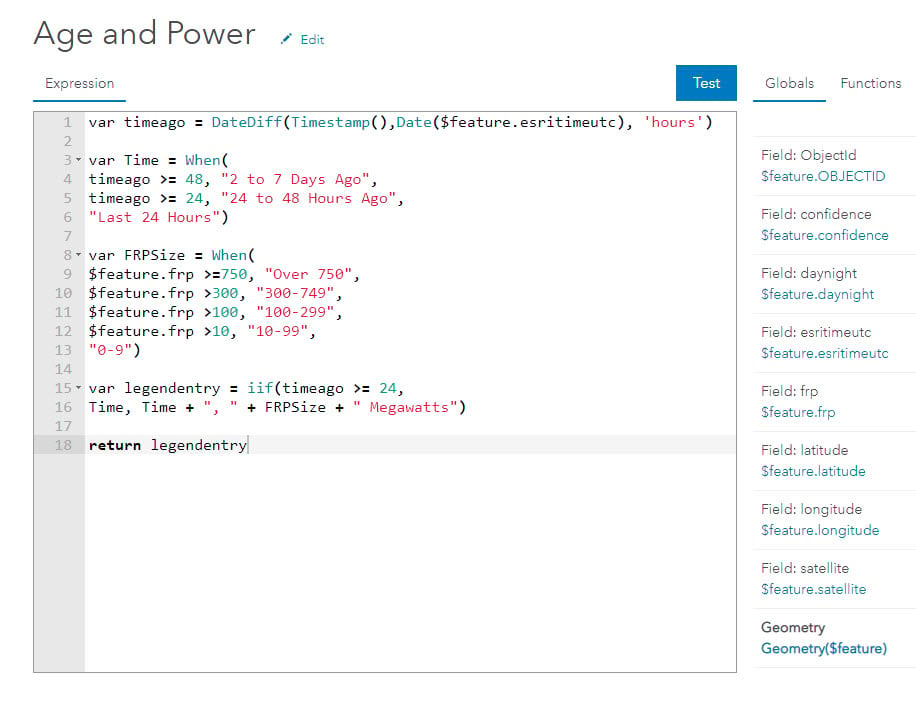
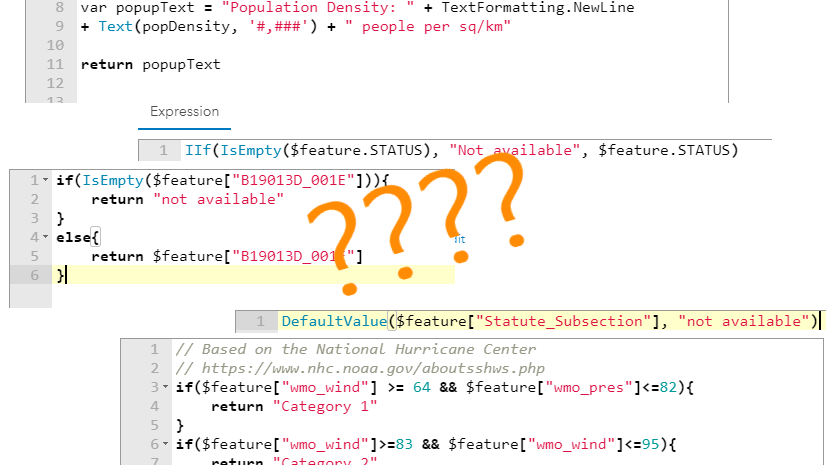
In the arcade expression below, the variable timeago captures the value of the number of hours ago each fire was detected. Using the iif() logical function, we combine the strings for time and power of the fire for the legend if it’s less than 24 hours old. If it’s older than that, the legend string doesn’t include the FRPSize at all. We end up with just seven symbols, we communicate what’s most meaningful without blowing up the legend with too many symbols.
Example 3: Strictly Time
Let’s consider looking at this layer strictly from a time perspective where the age of the detection is represented by color. If we use the same Hours Since Detection expression for the symbology, then we can answer the question: Where is the latest heat detection, irregardless of size or any other interpretation? By selecting an intuitive ArcGIS Online yellow to red gradient (available as a default) to highlight this you can quickly determine exactly where the fire looks to still be burning.
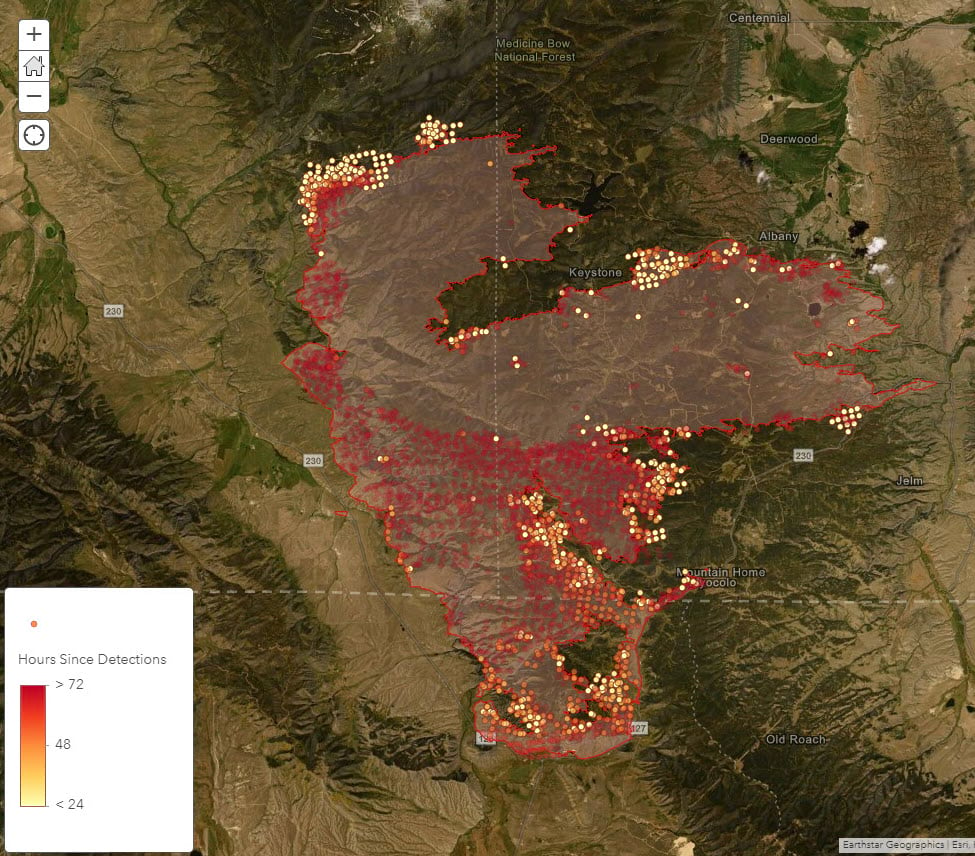
This time we applied the Hours Since Detection expression on the symbology, as well, we also used it to set the transparency to help the most active locations really pop out.
Let’s look at three days of VIIRS detections using the three different classification methods on the Mullen Fire to see how the different visualizations help to better understand the fire situation.
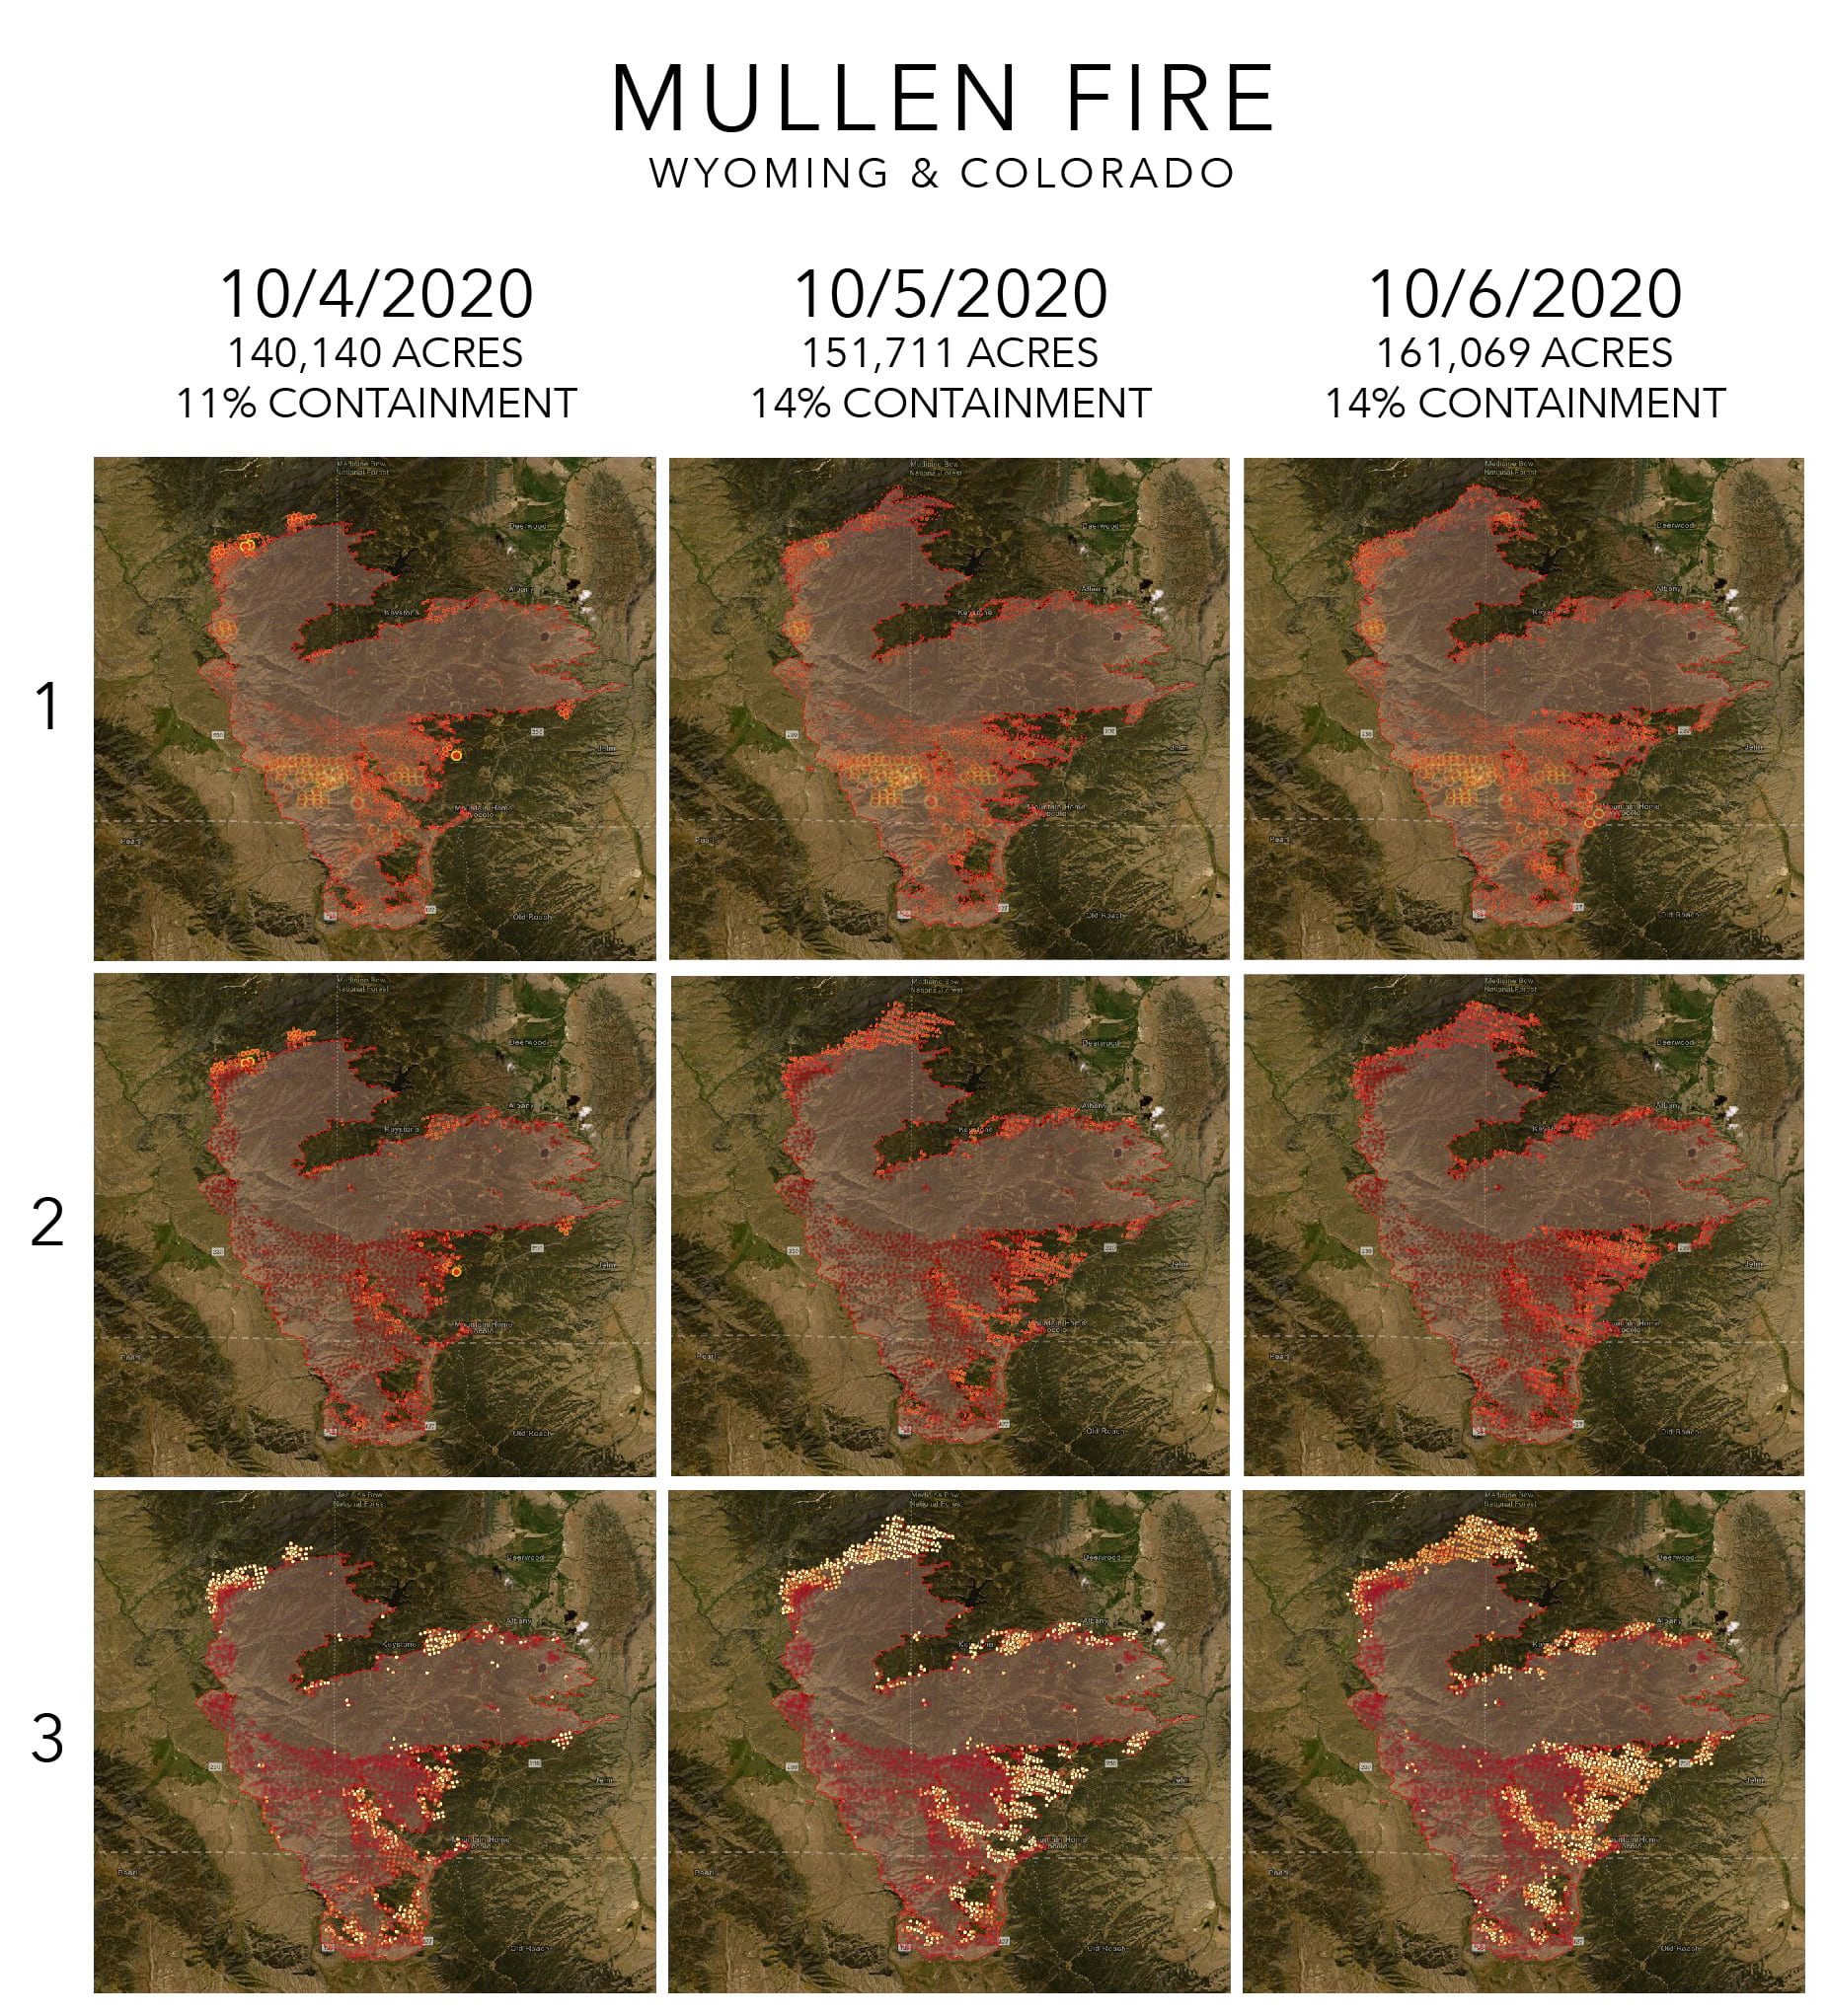
Take a look at the northern area of the fire in examples 1 and 2 you can see a higher FRP intensity of the points very distinctly on 10/4, and then predictably on 10/5 and 10/6 the fire grows in that direction. You can see that reflected in the update of the next day’s perimeter. Along the east side, where the fire was moving toward Hwy 230, the activity is more visible in example 3 given the fire intensity at the time of detection was lower. In that case displaying the data by time provides a clearer picture of where active fire growth is occurring.
All wildfires behave differently and your needs for mapping the fire or providing updates to your audience may be different. Using these three display techniques interchangeably you can get the most information from the VIIRS layer.
Resources
The Arcade expressions demonstrated above can be found here in this web map. There have been many blogs written about Arcade and some of our favorites are linked below.
For more information on Esri’s support for wildfires please visit our Disaster Response Program (DRP). DRP assists organizations responding to disasters or crises worldwide by providing GIS technology and technical expertise when an organization’s capacity is exceeded.


Article Discussion: