ArcGIS Arcade was introduced to the ArcGIS platform back in 2016 but is somewhat of a hidden gem. For those who have used it, there’s no secret that it is changing the way people make their maps and work with data. What is incredible, is that you don’t have to be a “coder” to do amazing things with Arcade. If you are, however, a coding wizard, Arcade is a powerful way to enhance your maps in new ways.
I regularly get questions about Arcade and what it can do. This made me realize that many people might have similar questions, so a ton of my Arcade wizard teammates and I compiled the most common questions we get about Arcade. While there are blogs, ArcGIS Learn resources, and documentation pages to get you started, not everyone has the time to spend on tutorials. In this article, my fellow Arcade enthusiast Gee Fernando and I offer easy-to-understand answers and examples to the questions we get the most. Feel free to use this resource if you are just getting started with Arcade, or if you are familiar with Arcade and have some nagging questions. You can also find the official ArcGIS Arcade FAQ here, which contains some of the same questions.
- What exactly is Arcade?
- Does Arcade change the underlying data table?
- Do I have to own a layer to use Arcade?
- Where do I find Arcade? How can I use it?
- What is an expression? What does it do?
- I just opened the expression window. What am I seeing exactly?
- Is the new Arcade Editor WCAG Compliant?
- What are globals?
- What is $feature?
- What do functions do?
- Can I reuse an expression I’ve already written?
- Where can I find examples of Arcade?
- My data changes behind-the-scenes regularly. Will my map show those changes if I use Arcade?
- Can I create variables?
- I see something about “returns” in the documentation and examples. What does this mean exactly? Do I need to have one?
- What’s the best way to debug an Arcade expression?
- How do I write if/else logic?
- Can I format text using Arcade?
- Why isn’t the newline text formatting showing up on my labels?
- Is there a way I can handle null values in my popups?
- How can I turn numeric values into categories?
- Can I convert field types using Arcade?
- Can I do a unit conversion with Arcade?
- Can I work with date fields using Arcade?
- What is a FeatureSet?
- Can I work with related tables using Arcade?
- Can I use Arcade to get the statistics for a layer?
- Can I do spatial calculations in Arcade?
- What is the difference between the intersects() and intersection() functions?
- Can I list the closest locations to a point on my map?
- Why does my Arcade expression work in ArcGIS Online but not WebApp Builder?
What exactly is Arcade?
ArcGIS Arcade is a scripting language that allows you to calculate new data values on-the-fly. Think of it like “calculate field” but without directly editing your database. What’s really cool about Arcade is that you don’t have to own a layer to do this. This makes it so that you can find layers from ArcGIS Online or ArcGIS Living Atlas and calculate and map completely new things! You also don’t need to be a “coder” to be able to create powerful calculations. It has a lot of similarities to Excel for basic functions, but also can be advanced similar to JavaScript for when you want to do more.
Does Arcade change the underlying data table?
Arcade allows you to calculate new values on-the-fly, meaning you aren’t actually writing anything to a table. This makes it easy to adjust and try out new things when working with spatial/tabular data. This is especially helpful when using layers that you don’t own yourself. However, if you own a layer, you can use Arcade to calculate a new field to your table if you want the result to be more permanent.
Do I have to own a layer to use Arcade?
Nope! This is one of the most powerful and understated parts of Arcade. You used to be stuck in the water if you found someone else’s layer but it didn’t have a field you wanted, or if a field wasn’t how you needed it. You’d have to contact the person and HOPE they update their service, or you’d need to find and host your own version of the data. Arcade empowers you to use data from trusted sources while still providing the freedom to customize or calculate your own things.
Where do I find Arcade? How can I use it?
You can write, share, and execute Arcade expressions in ArcGIS Online, ArcGIS Pro, ArcGIS API for JavaScript, and ArcGIS Runtime. The language is portable, meaning that an expression written in your web map popup will also work in your downstream apps like ArcGIS StoryMaps. You can find Arcade most places where you find and use other attributes. For example, symbology, labeling, transparency, popups, and more. The same way you would choose an attribute from your data to use for mapping/labeling/etc, you can choose to create an Arcade expression. Once you have created the expression, you will then find it in your attribute lists and can use it like any other field. Sometimes there’s a symbol that looks like a pencil (ArcGIS Online Map Viewer), an excel—like symbol (ArcGIS Pro), or you’ll find language about expressions (ArcGIS Online Map Viewer Beta). In this article, the example expressions you’ll see are built in the ArcGIS Online Map Viewer.
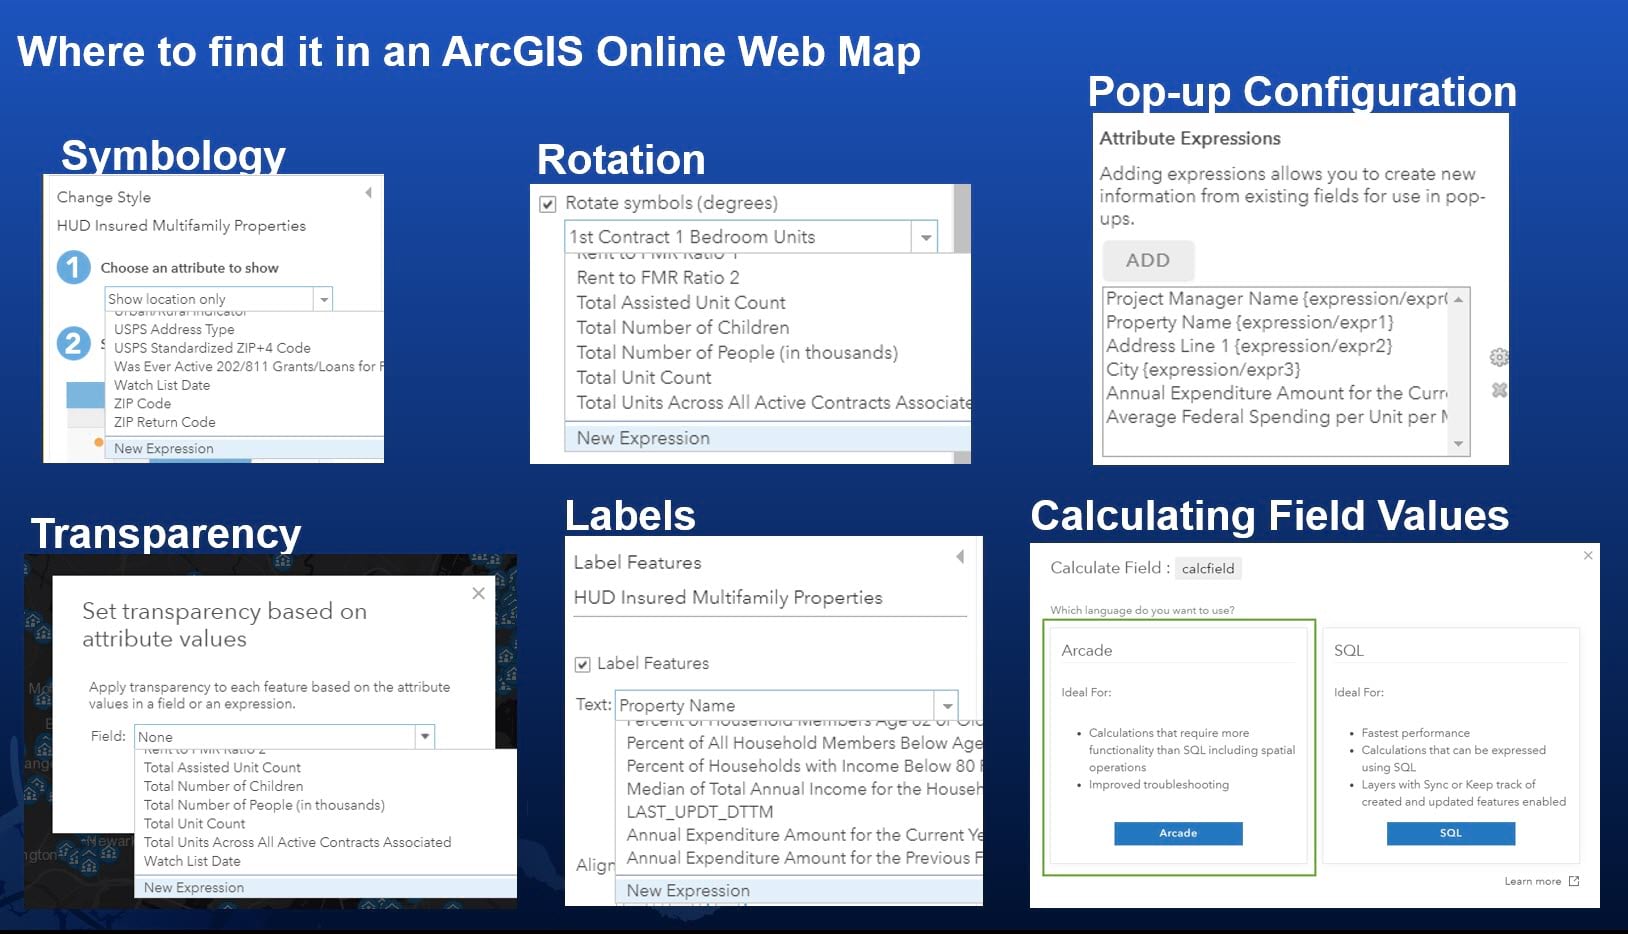
Arcade has also recently been added into ArcGIS Dashboards Beta. Building an expression for a Dashboard will look slightly different, so to learn more about how to use Arcade in Dashboards, visit this informative blog by our colleague David Nyenhuis.
What is an expression? What does it do?
Expressions are just a fancy word for the script that you write. The map will treat this like any other data value from your map. Think of it like a new field for the features in your map. You can create many expressions and use them like you would any other attribute. The expression itself looks like a chunk of code, but can be as simple or complicated as you need.
Do things as simple as adding 25 to a field value:
Or do more complex calculations:
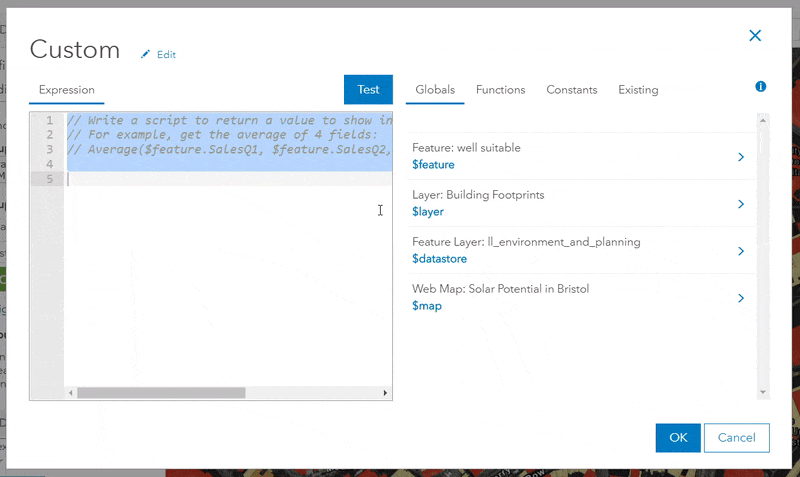
I just opened the expression window. What am I seeing exactly?
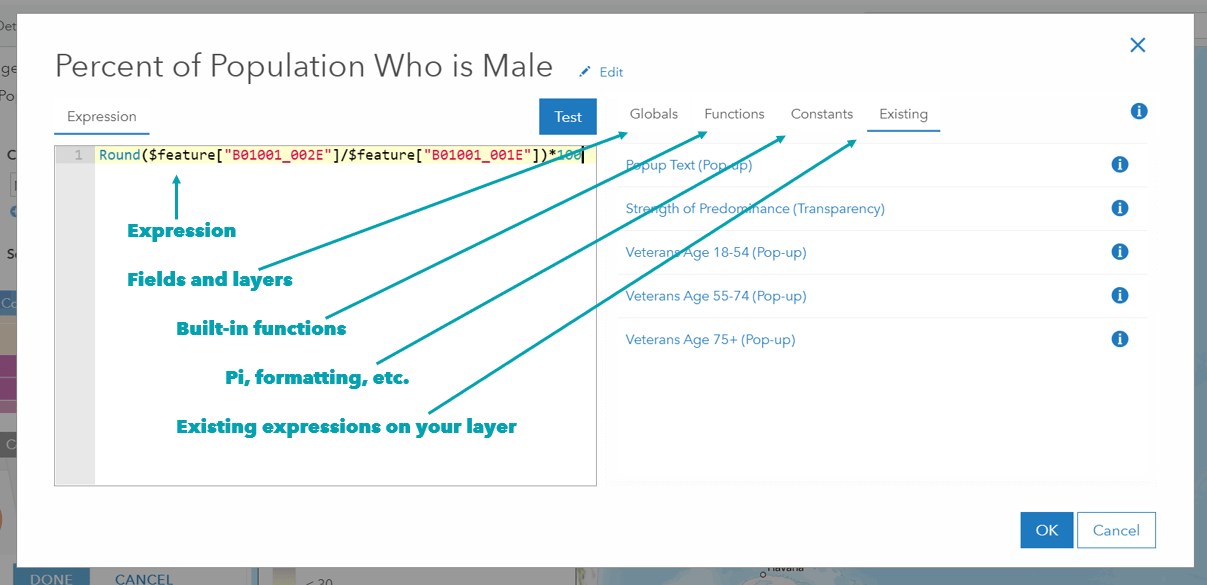
This window that appears is where you can create new values for the features in your map. The same way you calculate a new field, this window allows you to calculate new values by utilizing the other attributes in your layer, and even other layers in your map.
The box on the left is where you write your expression. Whatever you tell this box to calculate, it will return that value for each feature in your map.
Is the new Arcade Editor WCAG Compliant?
Yes! The color palette used to highlight syntax elements in the new Arcade editor was designed to meet the WCAG 2.0 Special Criterion 1.4.3 guidelines for color contrast. This ensures that the contrast between the background and foreground colors is high enough to be legible to all individuals, including those with various color vision deficiencies. For more information, check out this blog.
What are globals?
In the expression window you’ll see the word “Globals”. These are things in your map such as fields, other layers (you’ll find those under $map), and other things. When looking at the globals list when working in symbology, you’ll see the list of fields. At the bottom, you’ll also see the map scale as $view.scale. This can be used to adjust the symbology by scale, like shown in this blog. You can also access the geometry of a feature by using $feature on its own. But we will address that in the next question. When looking at globals within popups, you’ll see more things appear in the list. The reason this list is different is because not all functions are supported in all places. This is mostly due to performance reasons.
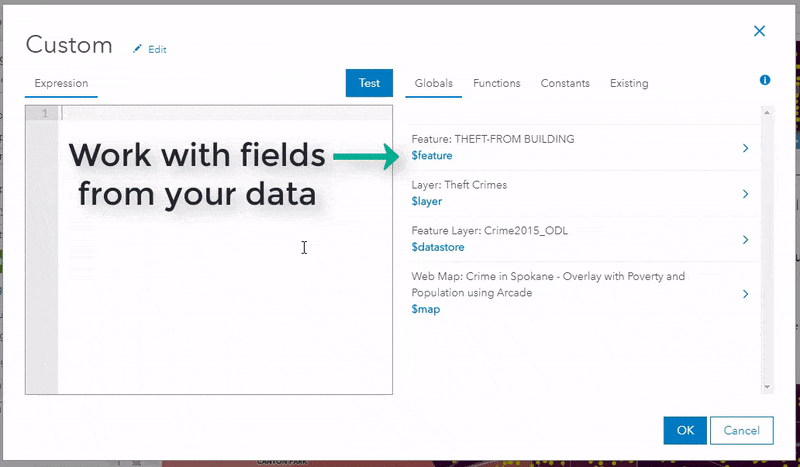
What is $feature?
Think of $feature as just that… a feature on your map. When building an expression, $feature represents a single feature from the layer you are working with. Think of it as a row on your spatial table. You can access a particular field from that feature by using the “dot notation” or $feature.YOURFIELD. You’ll see this in the list of fields (Globals). You can also use brackets to access fields from a feature, with notation: $feature[‘YOURFIELD‘].
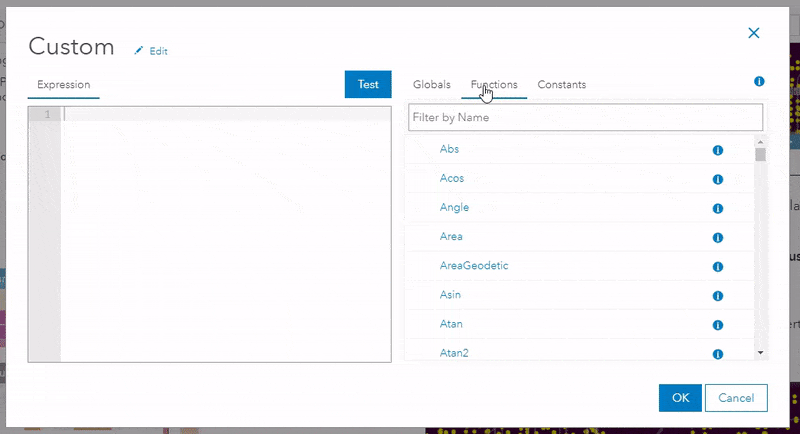
What do functions do?
Like Excel, functions are built-in tools to help you process and clean your data. For example, the Round() function helps you round a value to the significant figures you want. So Round($feature[‘YOURFIELD’] ,1) would give you the value of each figure rounded to 1 decimal point. The help is also built straight into the window, so you don’t need to leave your map to learn more about a function and its syntax. Add a function into your expression with the syntax already built-in. Easy! You can also search for functions.
Can I reuse an expression I’ve already written?
Once you have created an expression within a layer in your web map, you can access that expression again when working on the same layer. The “Existing” tab that appears in ArcGIS Online allows you to choose an expression and it will auto populate into the expression window to easily reuse it. If you set an expression for your symbology and you want to reuse it in your popup, just go into the popup and find it within the Existing tab.
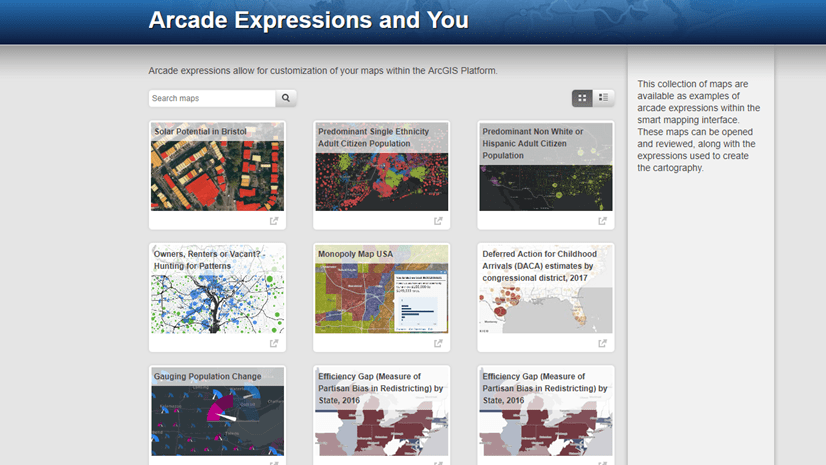
Where can I find examples of Arcade?
There are many different places people have shared their Arcade to help others. Here are a few:
- Esri/arcade-expressions GitHub repository contains examples to use and also lets you share your own.
- Arcade Expressions and You ArcGIS Online group containing maps that use Arcade for symbology or popups.
- There are many ArcGIS Blogs about Arcade with examples
- GeoNet contains many questions, answers, and blogs about Arcade
My data changes behind-the-scenes regularly. Will my map show those changes if I use Arcade?
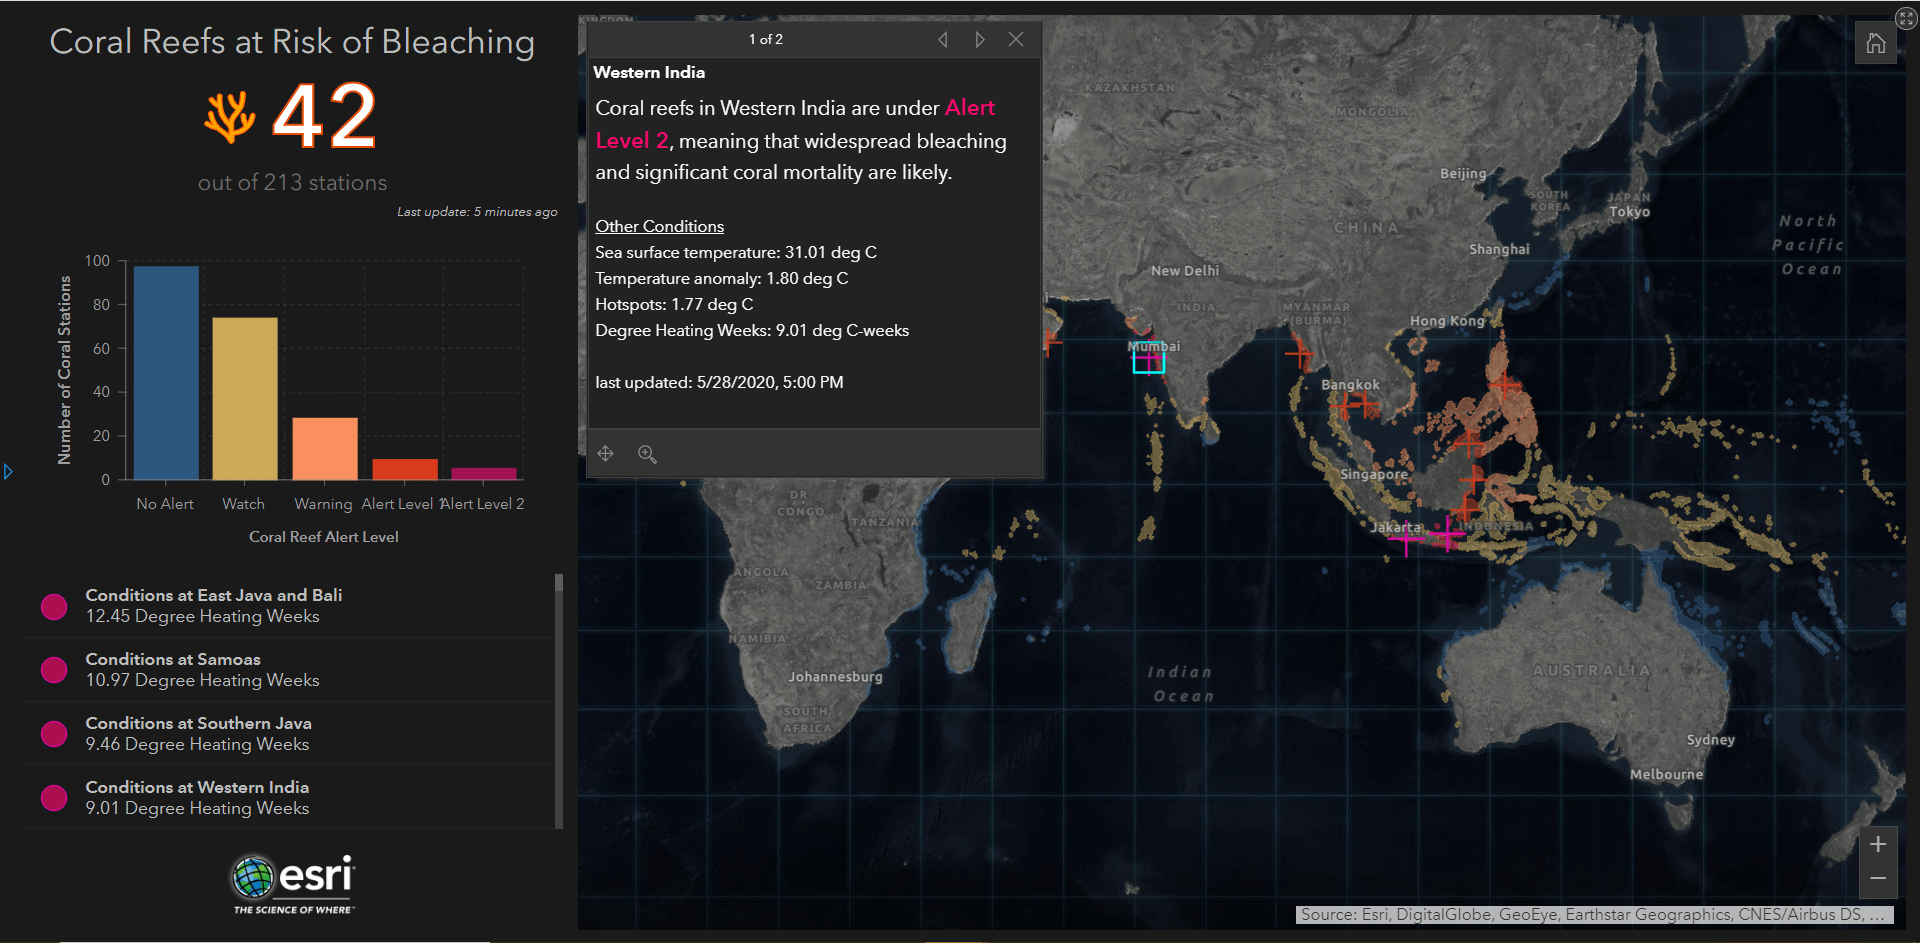
Yes! The beauty of Arcade is that it is dynamic. Whenever you load a map, it will calculate the values from your expression on-the-fly. This means that changing data will adapt with no extra calculations or configuration on your part. When your layer has values that change regularly, your symbology/popup/etc. will all update automatically. For example, the Coral Reef Bleaching Dashboard in ArcGIS Living Atlas uses a live feeds layer with data from NOAA that updates daily. The web map symbology and popup are driven by Arcade expressions, and the dashboard pulls in the web map. The web map and dashboard all update automatically when the data is updated, so the map stays current, even as real-life conditions change.
Note: Your map will show the newest data values on its own, but your web map will use whatever symbology settings were set originally. New data could mean that you need to make accommodations to your symbology such as the breakpoints being used.
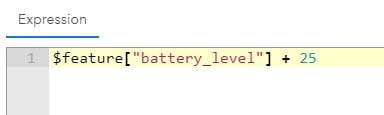
Can I create variables?
Absolutely! Arcade is built on top of JavaScript, so the syntax for Arcade variables is very similar. You can declare a variable (var x) and assign it (=) to whatever you’d like. For example, this variable calls to my field “battery_level” and multiplies it by 10:
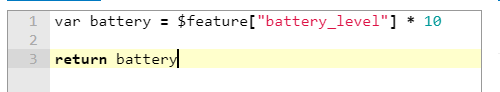
I see something about “returns” in the documentation and examples. What does this mean exactly? Do I need to have one?
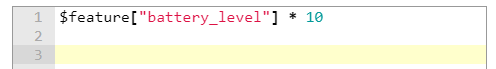
A return statement tells your expression what to return in the map. You can do a whole slew of loops and sub-calculations to get to your end goal, but the script will ultimately return whatever you tell it to using the word “return”. For example the previous question above shows us a statement where the expression will return the result of the calculation from the “battery” variable. However, you don’t always need a return statement. If you are doing a simple one-line expression, there is no need to add a return statement. You CAN add one, but it is not necessary. The example above will return the same thing if written like this:
What’s the best way to debug an Arcade expression?
There are two main tools to help you debug your expressions. The expression window has a button that says Test, and when that appears, you’ll see the Results panel. These are your weapons for success.
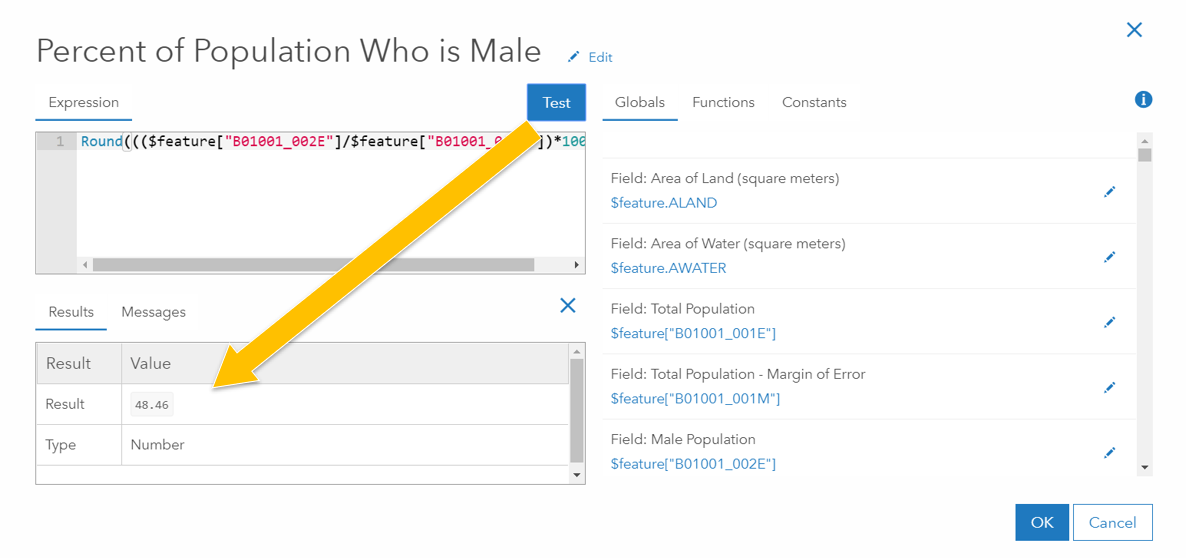
The Results panel will tell you what the expression is trying to return in your map. If the type or resulting value isn’t what you expect, try investigating each line in your expression. Try using the return statement for each line along the way to make sure you are getting what you expect in each step. To comment out any code, use // before anything you want the expression to ignore.
You can also use the small pencil symbol to the right of a field to change the value being used in the test. By default it pulls the first record from your table, but if you want to test what the result will be for other scenarios, you can simply type in a different value.
Another way to see what the expression is returning at different points in your expression is by using the Console() function. This is almost like a print statement in other coding languages. See the documentation for a good example.
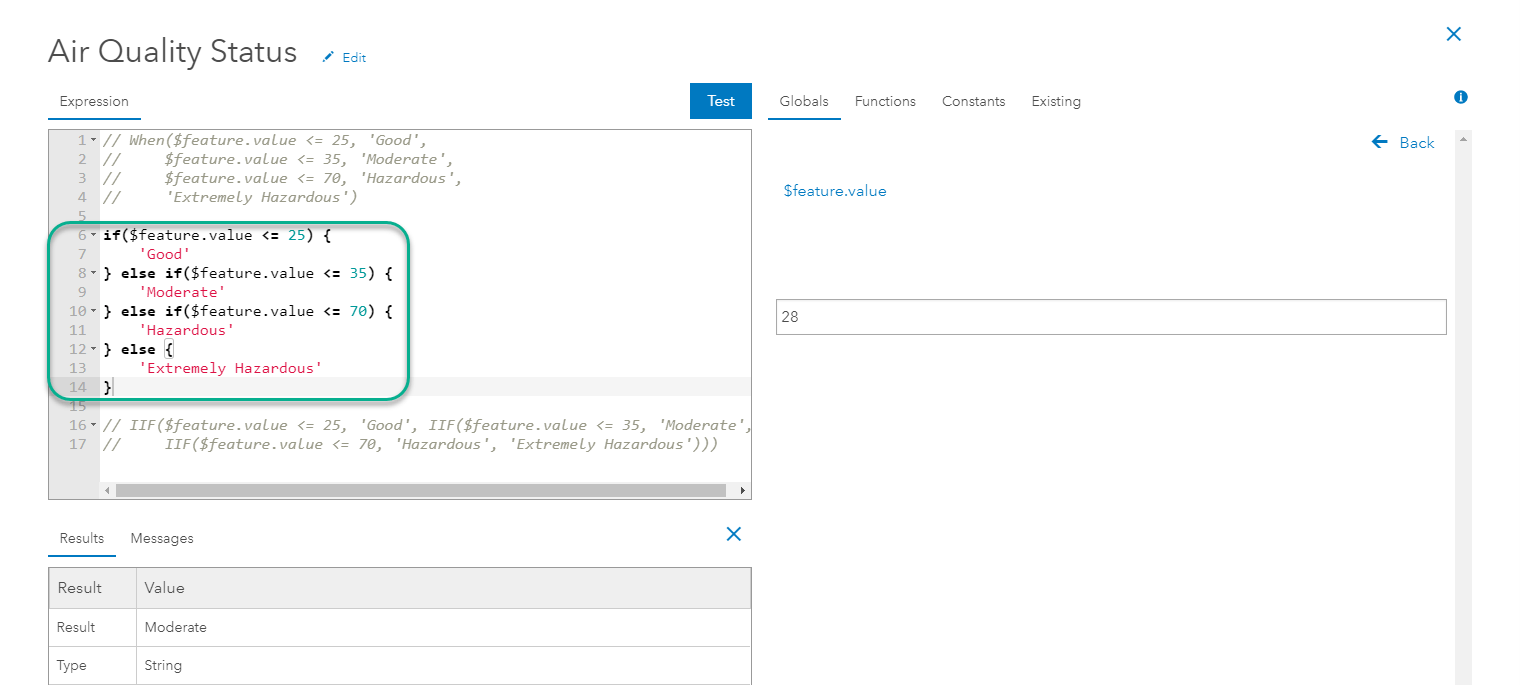
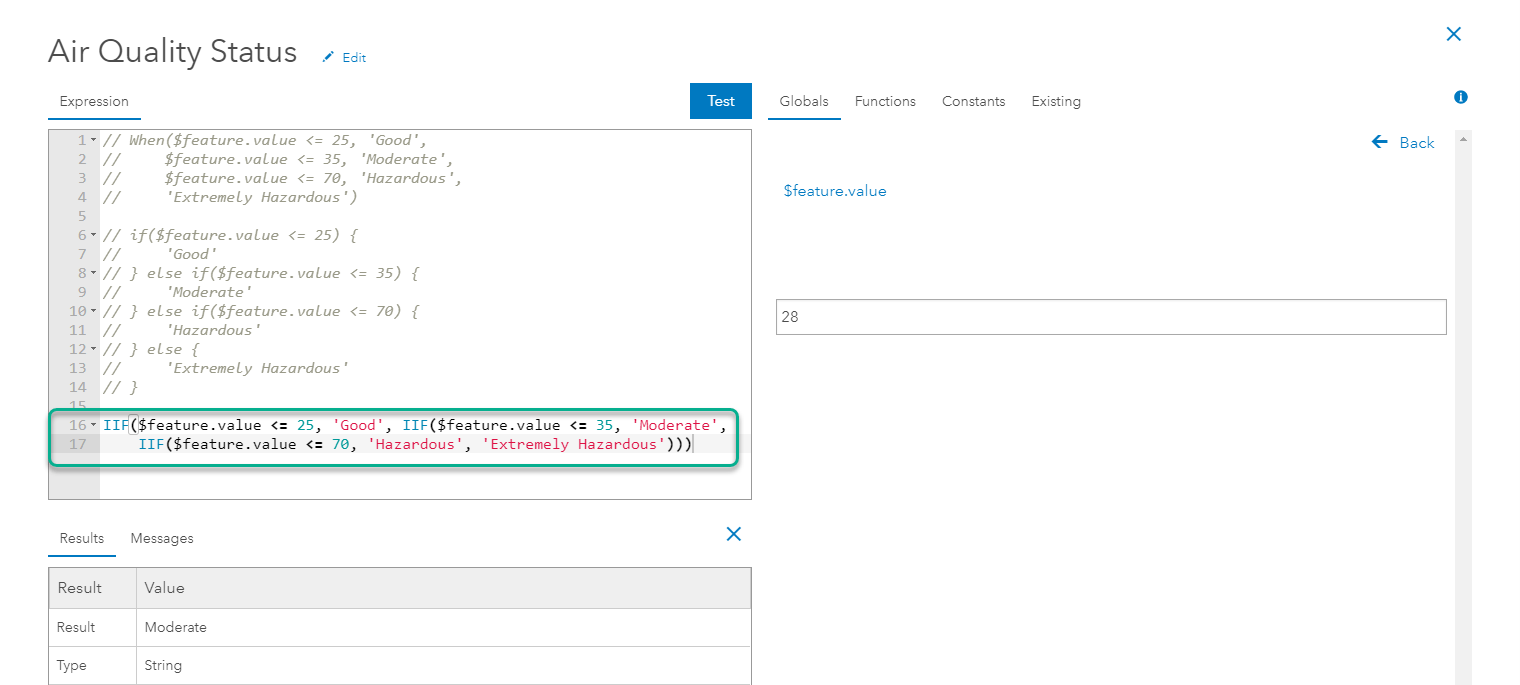
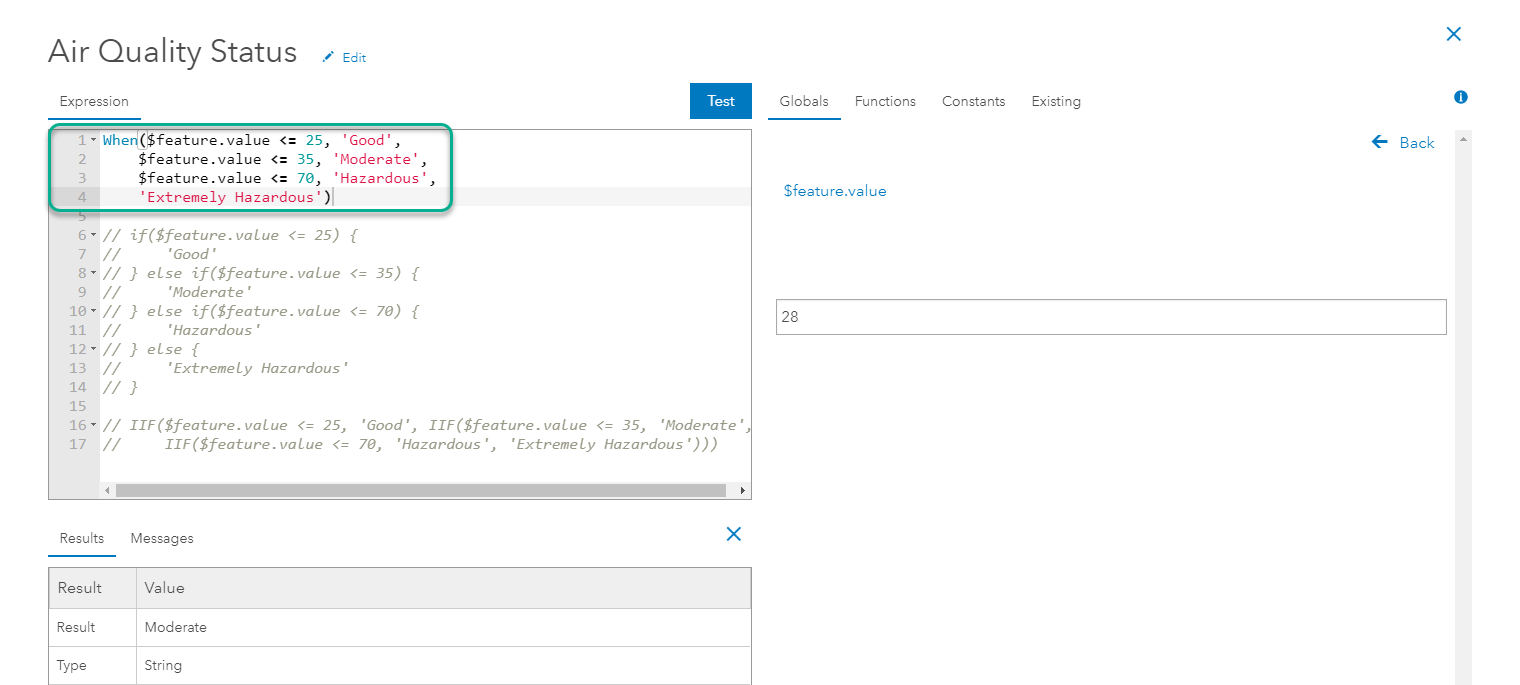
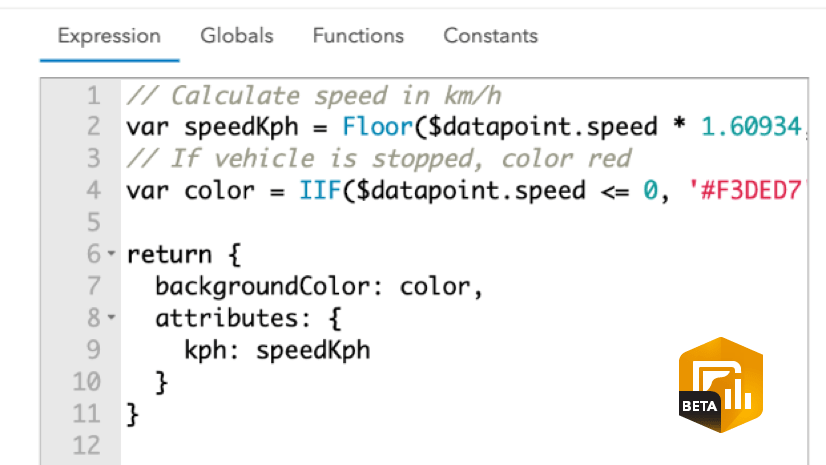
How do I write if/else logic?
There are many ways to write if/else logic (conditional statements) in Arcade. Ultimately, I suggest doing what makes the most sense to you. If you are less comfortable with the syntax of Arcade, try using the IIF() or When() functions. First, you’ll need to know which operators to use when writing a statement. If you want to check if a variable x is greater than 25, your conditional statement will be simple: x > 25. If you want to check if that variable is greater than 25 and less than 100, your statement will need to combine those with the && operator: x > 25 && x <100. For the full list of operators in Arcade, you can find them near the bottom of this help page. Here are a few ways to work with conditional statements in Arcade:
-
If(){} else{} logic
This method uses syntax that looks just like JavaScript, where you write your condition in the parentheses, and you tell the expression what to return in the squiggly brackets. For example:
-
IIF() function
This built-in function does the same thing as the code above, but doesn’t require you to write out the code syntax. This could be an easier way to start if you aren’t comfortable with coding. The help page shows us that this function works like IIf( condition, trueValue, falseValue). This means that in the first position, you write the conditional statement, in the second position you tell it what to return if the conditional statement is met (if true), and in the final position you tell it what to return if the conditional statement is not met (else). For example:
-
When() function
This built-in function is helpful when you have many different conditional statements. This works like the IIF() function, except you can include as many conditional statements as you need for your calculation. For each conditional statement, you tell the function what you want it to return for each condition. For example:
Can I format text using Arcade?
Yes! Arcade is a great way to make your pop-ups easier to read. Instead of raw data values, you can turn numbers into understandable and clean information. A few examples:
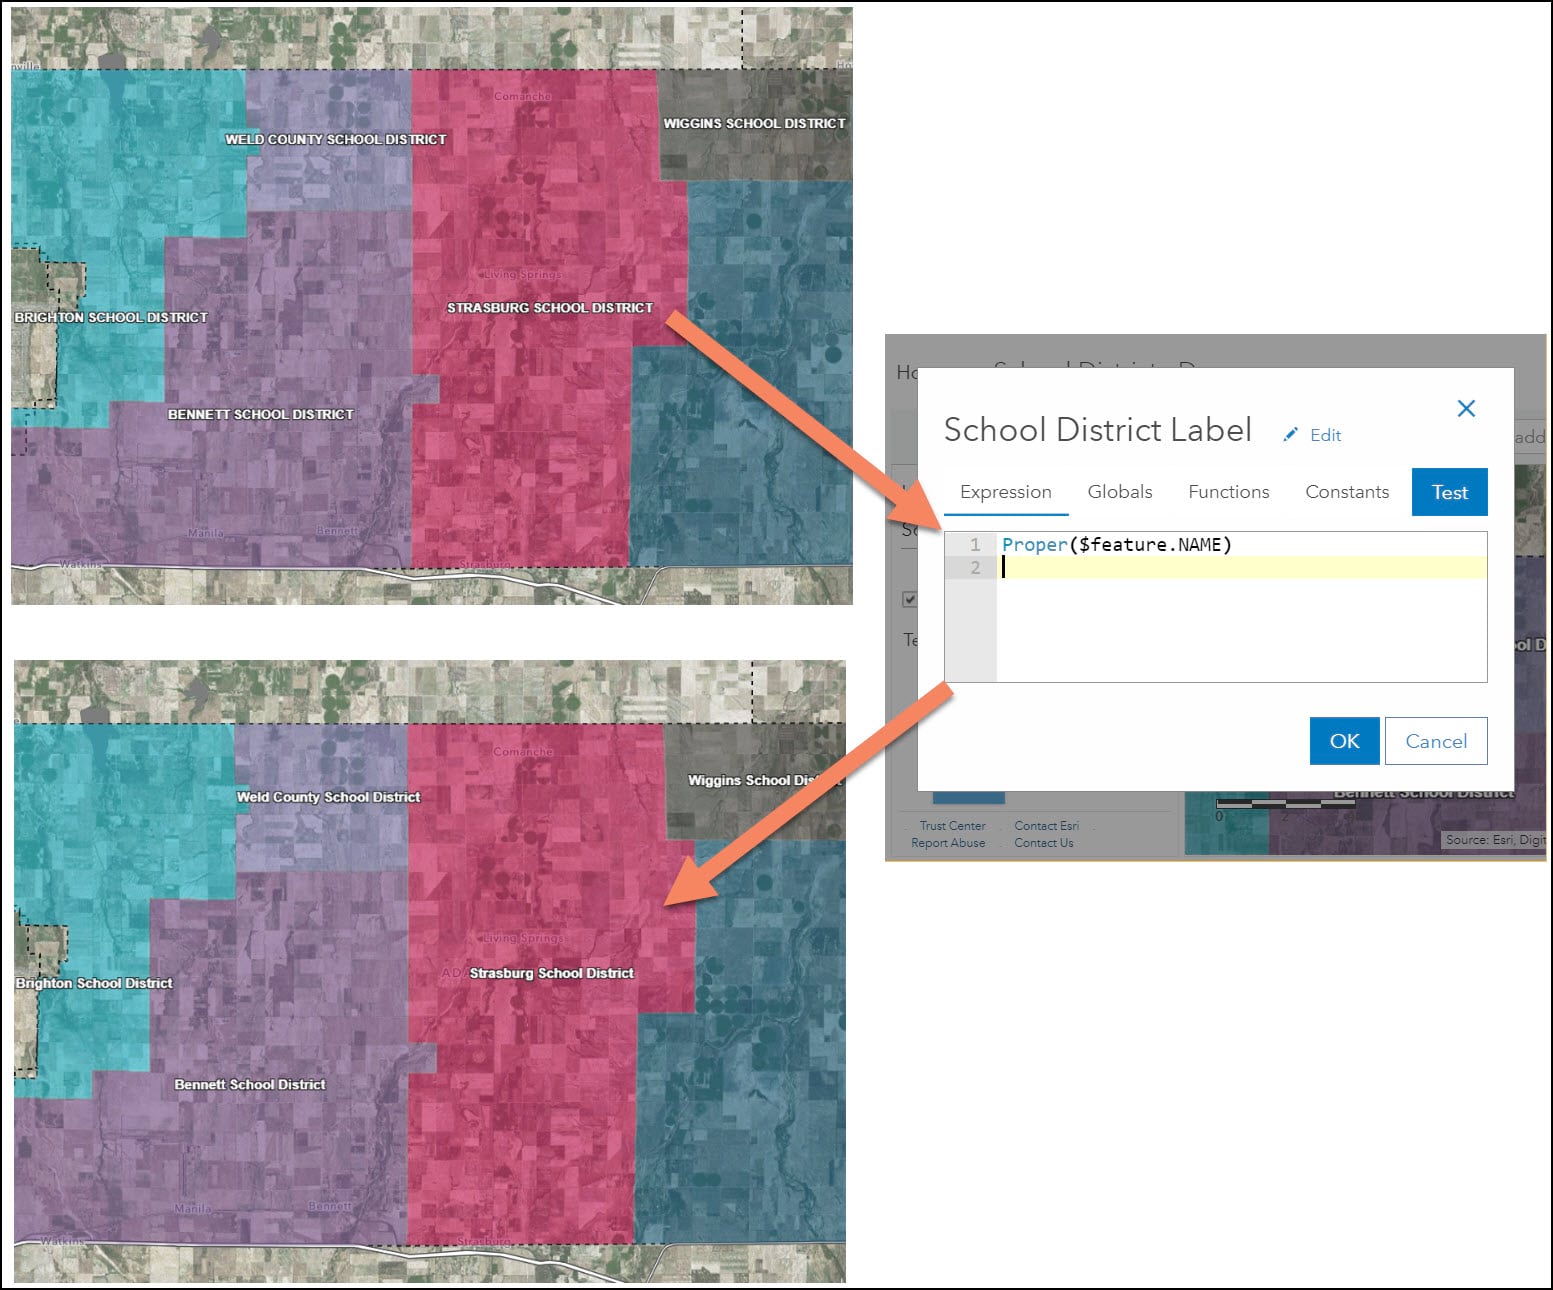
- Proper() -How many times have you see labels or values in your map like this: REDLANDS HIGH SCHOOL. The Proper() function easily re-formats these all-caps-atrocities with a simple line of Arcade. This map uses it within the labels so that they are easier to read:
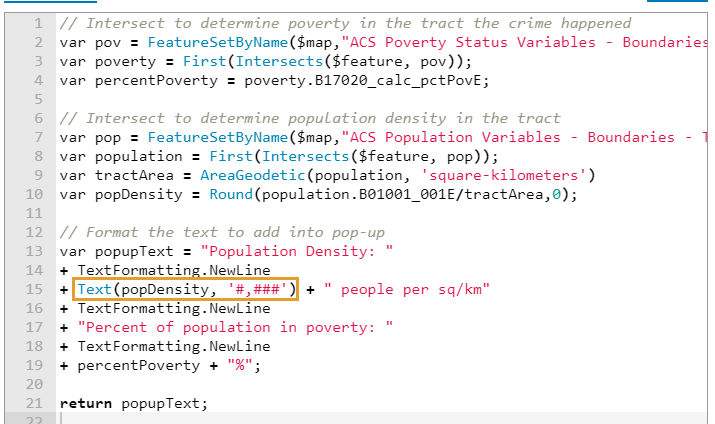
- Text() – This function helps format your numbers or dates into more readable text. For example, this map uses a complex expression to calculate new values, and then creates a formatted string for the popup. You can see that the Text() function is used to add a comma separator for the popup:
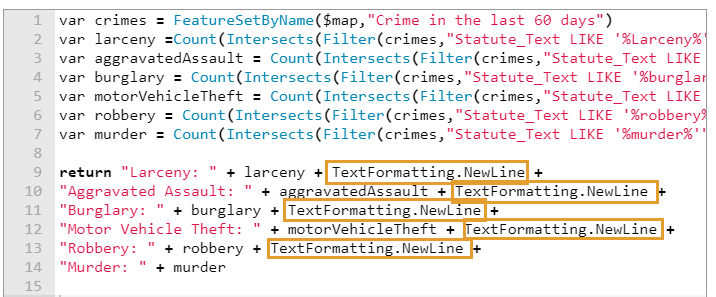
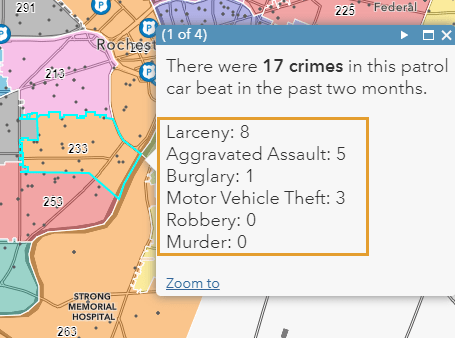
- TextFormatting.NewLine Constant – Add a new line into your popups or 4.x map labels using this text formatting constant. It is an easy way to make a list of information more readable. For example, this map lists out the various crimes that occur in police districts by counting how many there are of each one. Newline makes the popup easy to understand:
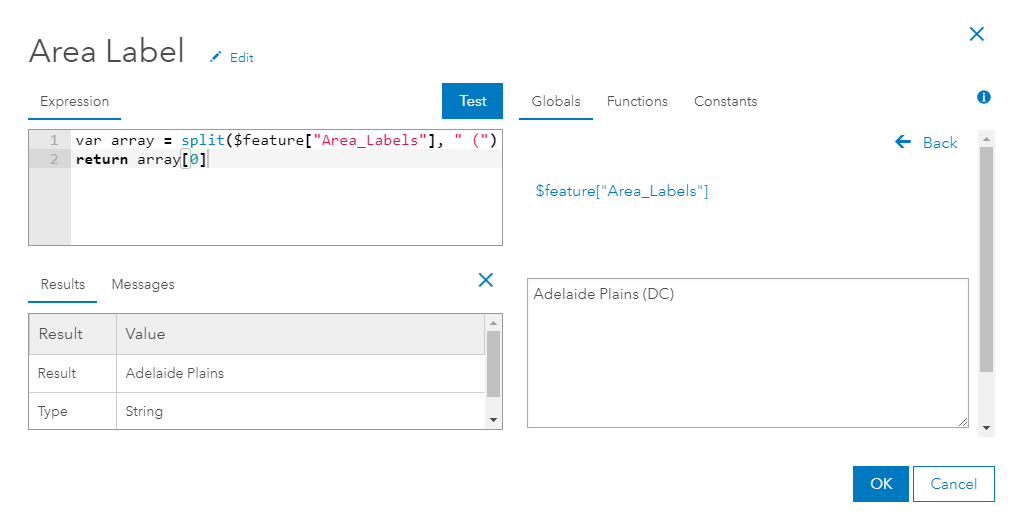
- You can use Split() to split text at a character, and then return everything before that point in the text. The same thing can also be accomplished using the Left() function.
These are just a few examples. There are also function like Replace(), and others that can grab the values you need from other fields in order to create new text values. Click here for the full list of text functions.
Why isn’t the newline text formatting showing up on my labels?
The TextFormatting.NewLine functionality is a great way to clean up your popups and labels but isn’t supported when labeling in the existing ArcGIS Online Map Viewer. Try viewing the map in the new Map Viewer Beta or adding the map into a 4.x supported app. To see which apps are 4.x, check out this blog.
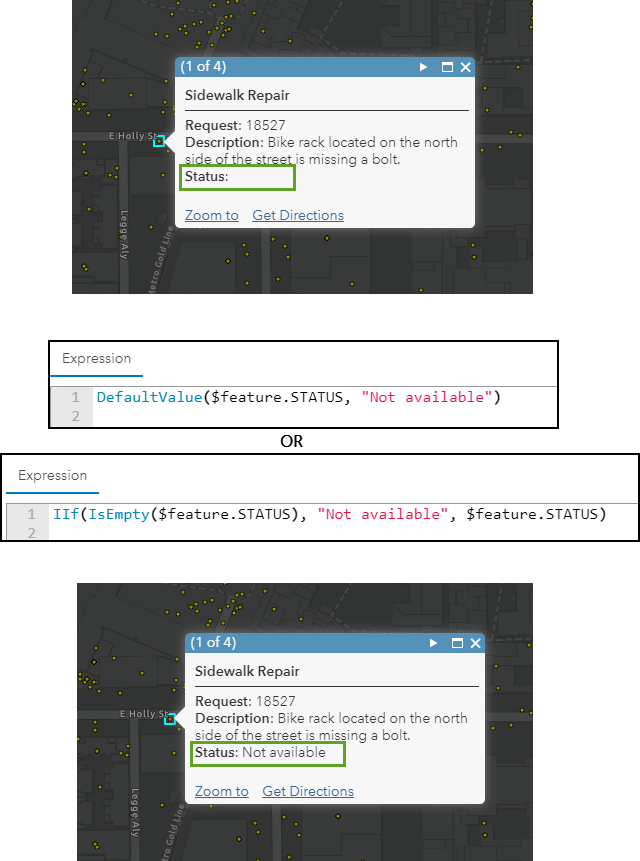
Is there a way I can handle null values in my popups?
There are many different ways to handle null values in your data. Replace an awkward blank spot in your popup with a coherent phrase or placeholder. There are a few ways you can handle nulls, but some of the basics are by checking if a value is null using the IsEmpty() function, or by setting a DefaultValue().
How can I turn numeric values into categories?
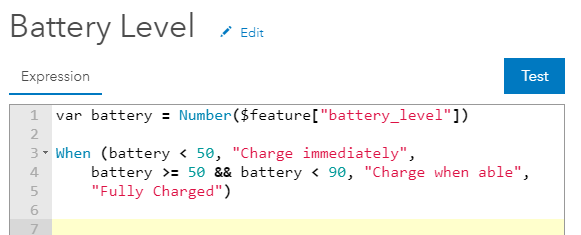
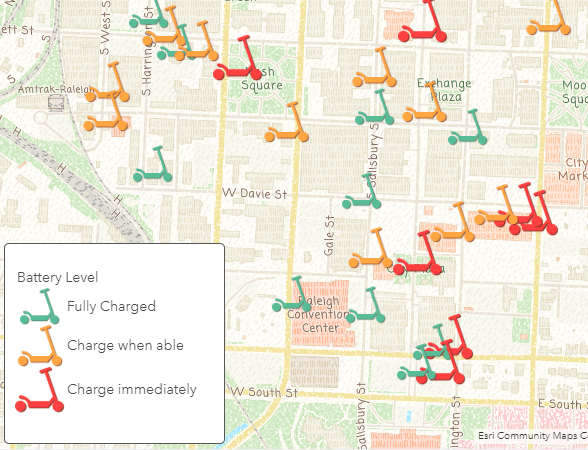
Using the technique mentioned in the earlier question about if/else statements, you can easily convert numeric values into categorical data. Write your conditional statement, and have the expression return the text you want to appear. The map will treat your result as text and map the results. For example, I want to show the battery level of Bird scooters around my area, but I want to easily recognize which ones need to be charged immediately. I can convert the battery_level field into different categories using the conditional statement techniques mentioned earlier:
Can I convert field types using Arcade?
How many times have you tried to map a field that LOOKS like a numeric field but it was actually a text field? You can create a new expression in order to use the field the way you need.
You can use the Number() function to quickly convert it into a number. If you want to round that number, you can use the Round() function.
Similarly, if you want to show a numeric field as text, you can use the Text() function to do this. There is an example of this earlier in the article.
Note: When using expressions in your map, you aren’t changing the field type on your table schema. If you own the layer and want to calculate a new field with the data type you want, you can do that directly within ArcGIS Online. Check out this blog to see how.
Can I do a unit conversion with Arcade?
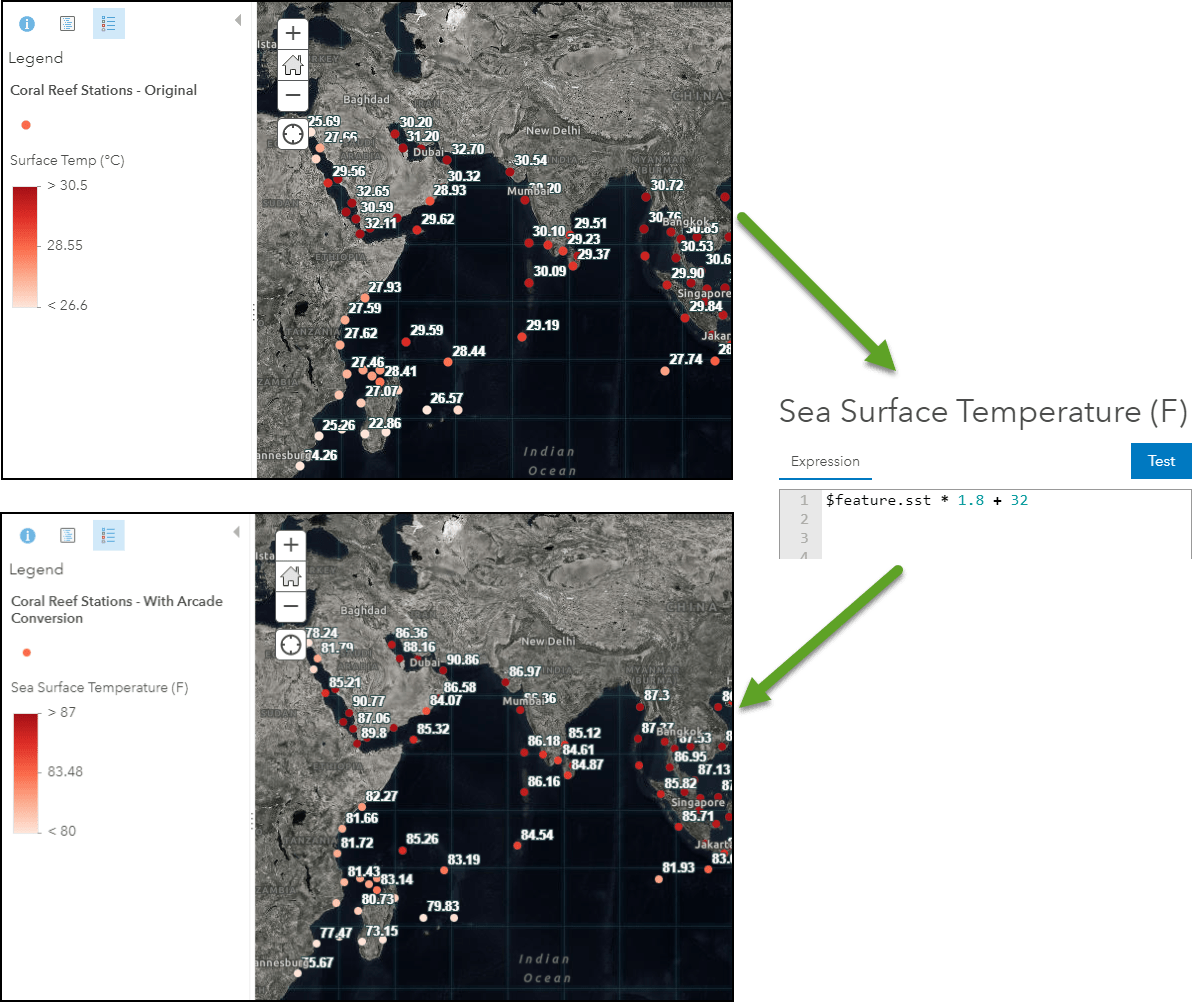
Absolutely! This is a great example of a simple calculation that can be done with Arcade. Simply use the attribute you want to convert and plug it into an equation. For example, if I have a map showing sea surface temperature in Celsius but I want to show the values in Fahrenheit, I can convert these using the equation CelsiusValue * 1.8 + 32. I can plug this straight into my expression calling to the sea surface field ($feature.sst). This story map shows step-by-step how to do a conversion like this.
Can I work with date fields using Arcade?
There are many Date functions available within Arcade. You can format these nicely for your popups and labels in order to communicate only the information you want the end-user to see. You can even calculate the difference between two dates, or determine how far away a date is from the current time by using the DateDiff() function. For example, you can use this function along with the Now() function to figure out how recently something in your data was updated. You can then use text formatting methods to make it easy to read in your popup:
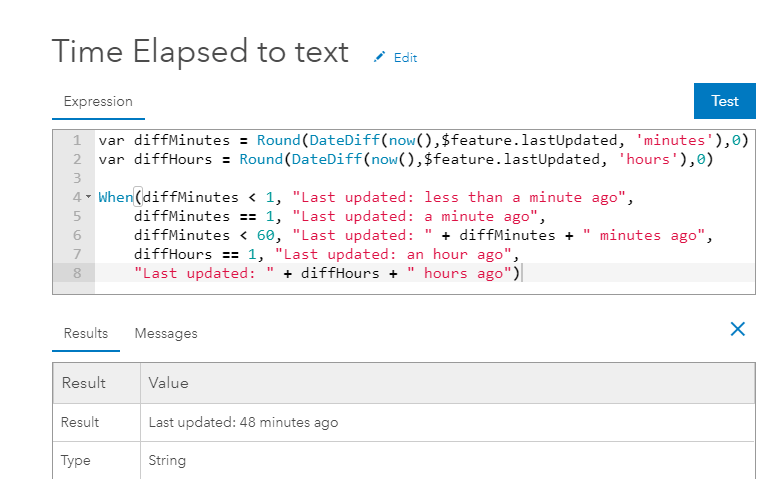
You can also use the Text() function to give your date fields the look and feel that you want. For example, Text($feature.YOURDATEFIELD, ‘M/D/Y’) would return a string such as 7/4/2020 or Text($feature.YOURDATEFIELD, ‘MM/DD/YY’) would return 07/04/20.
For a tutorial on how to work with date fields in Arcade, check out this blog by Gee Fernando.
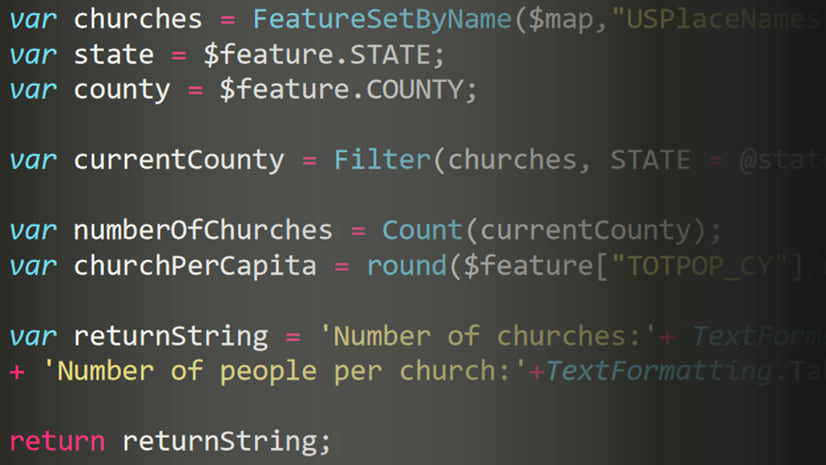
What is a FeatureSet?
FeatureSet() is a function that allows you to access information from other layers in your map. A FeatureSet is exactly what it sounds like. It is a set of features from within your map. So if you call to another layer in your map (or that SET of FEATURES), you will essentially be accessing that entire layer. Because of that, you can’t return a feature set directly, but rather you can work with that other layer to derive something from it. You can add a FeatureSet into your expression easily by going into $map, navigating to the layer you want to access information from, and clicking the FeatureSet button beneath it. This will add it directly into your expression. I usually set this feature set as a variable in order to easily access it later. You can see an example of how to add a FeatureSet to your expression in the question above called “what are globals?”.
You can use information from another layer from a FeatureSet in a few different ways:
- Spatially – You can use a geometry functions to determine if your layer has a spatial relationship to another layer. Geometry functions are mentioned a few paragraphs down from here if you want to learn more.
- Attribute-driven – You can grab attributes from another layer almost like a join using the Filter() function (this includes related records). If your layer and the other layer have a tabular commonality, you can use the information from that table with this method. If you are working with a large table, you may consider calculating the field using Arcade. This blog shows you how to do that.
To learn more about these two methods, visit this blog for a detailed description and examples. This story map tutorial also provides instructions on how to make your layers talk to each other.
But wait! You can also access information from other layers, even if the layers aren’t in your map! Instead of using the FeatueSet() function, you can use the FeatureSetByPortalItem() function. This function utilizes the item ID of a layer from so that it doesn’t have to clutter up your table of contents! This is described in detail in this blog.
Note: Check out this blog for considerations when working with FeatureSets or think about calculating your field ahead of time using Arcade.
Can I work with related tables using Arcade?
You can work with related tables alot like the “attribute-driven” FeatureSets example described above. For an example, check out this blog by Gee Fernando for a step-by-step tutorial on how to do so.
Can I use Arcade to get the statistics for a layer?
With Arcade 1.8, released in October of 2019, a new function called GroupBy() allows you to get the statistics of a layer. To do so, you pass the layer as a FeatureSet (described above), and specify the fields and statistics. This function allows you to summarize data instead of showing information about just a single feature. You can get statistics such as sum, count, minimum, maximum, average, standard deviation, and variance for a field (or fields) from a layer.
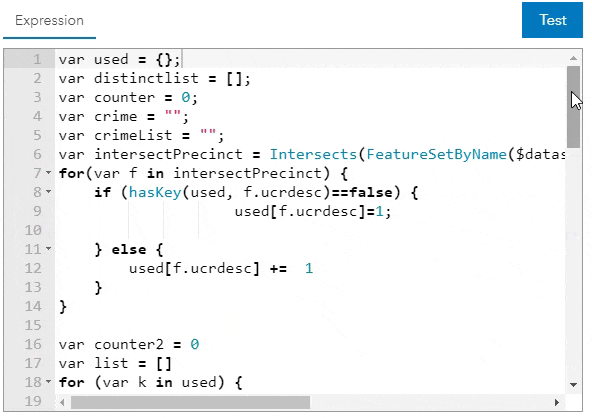
In this map inspired by Paul Barker‘s blog, there are thousands of trees within the city of Toronto in Canada. In order to see the three most common tree species for the Neighborhoods within the city, we are able to determine the count of each type using the GroupBy() function and a FeatureSet. The expression then lists out the top 3 types using the Top() and OrderBy() functions. To see how the spatial intersection of these two layers was done, check out the next two questions below.
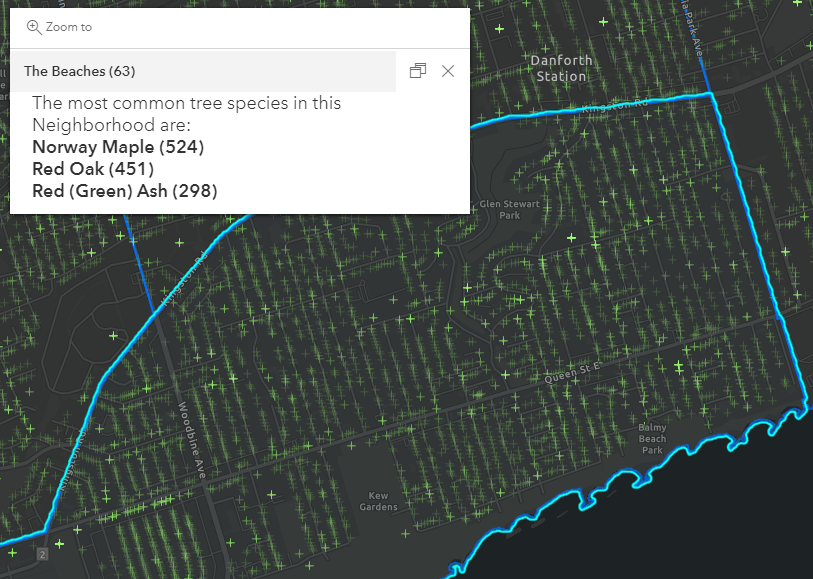
To see how this was done, open this web map and explore the expression within the pop-up configuration. (Hint: open the map, select the Toronto Neighborhoods layer in the Layers list, go to configure pop-ups on the right toolbar, choose manage expressions, and open the “Most Popular Trees expression).
You can also explore the Distinct() function covered in this blog which helps you get a unique set of values from a field in your dataset.
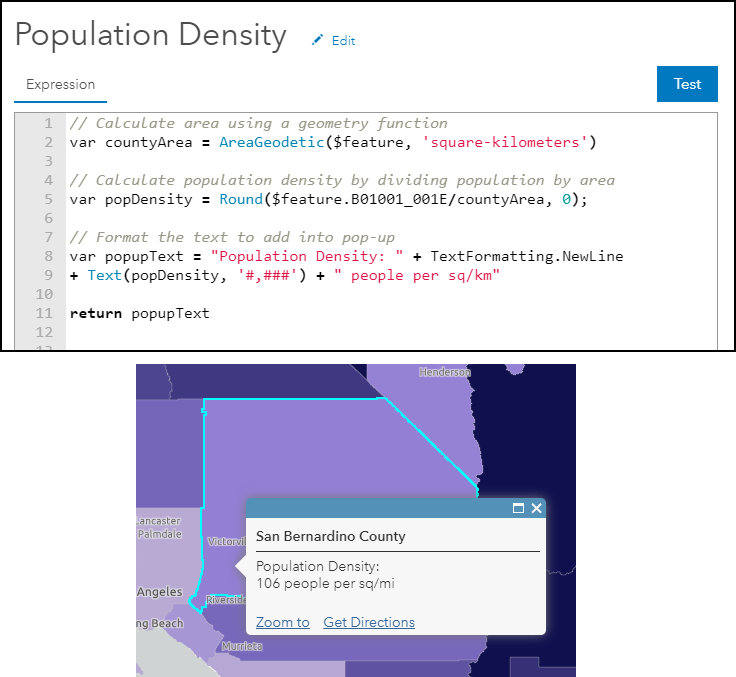
Can I do spatial calculations in Arcade?
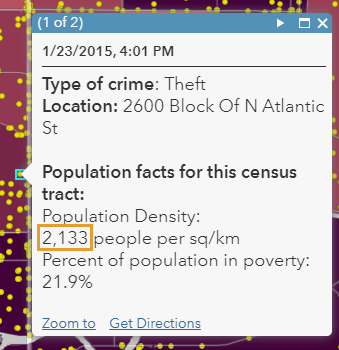
Yes! One of the most powerful and hidden gems within Arcade is its ability to evaluate geometrical objects (AKA the features on your map). You can pass a feature from your map (literally as $feature), and the geometry function will perform an on-the-fly calculation based on your current map scale. For example, I can calculate the population density from the Living Atlas layer ACS Population Variables using the area of each feature along with the total population. Using many of the techniques seen in this article so far, we could use a calculation like this to create a simple formatted popup:
Note #1: That this is not a replacement for advanced spatial analysis that you would do in ArcGIS Pro. There is a certain level of generalization that is done behind the scenes to your features in order to make the map performant. For more information about the context of geometry functions, please read the disclaimer in the documentation pages.
Note #2: Geometry functions can be “expensive” calls, meaning they can be slow for advanced calculations. If you have millions of features or detailed polygons, consider using ArcGIS Pro geoprocessing or calculate the field value using Arcade.
What is the difference between the intersects() and intersection() functions?
Intersection() will give you the overlapping feature when comparing two geometries, like you would get using the Intersect tool in ArcGIS Pro. The Intersects() function, however, tells you if two geometries overlap. If you wanted to find if a point falls within a buffer, you would use the Intersects() function to provide a True/False statement (Boolean). But if you wanted to find the overlapping area of two polygons, you would use Intersection().
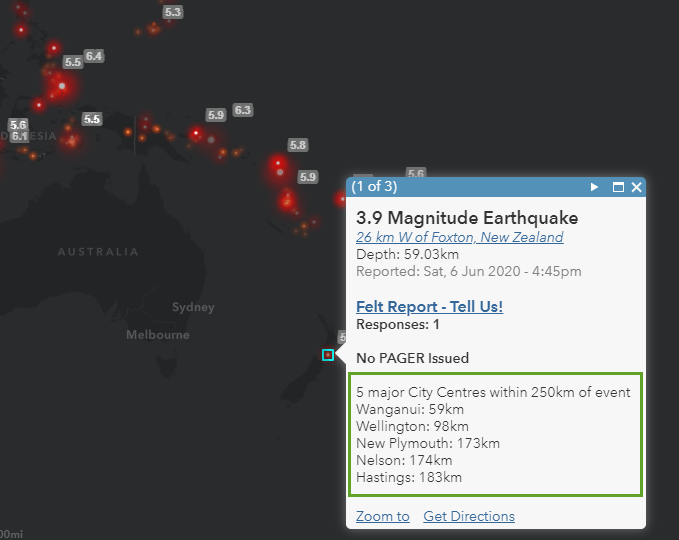
Can I list the closest locations to a point on my map?
We get this question pretty often, and the answer is yes! There are a few ways to do this. Using the Intersects() function mentioned above, along with the Buffer() or Distance() geometry functions, we can quickly see if two things fall within a range of each other. Using many of the techniques covered in this blog, we can use some advanced logic to find all overlapping features and list them out nicely in our popup. Below is an advanced example that compares recent earthquakes to the location of major cities. Using these two Living Atlas layers, the popup gives a formatted list of any earthquakes within 250km of a major city, or reports that no cities are nearby in order of their distance. I would recommend opening this map, clicking “Modify Map” at the top right, go into the layer settings to the popup configuration, and find the “Nearby Cities” expression.
Note: as mentioned earlier, keep in mind that this call is happening client-side, so heavier requests can slow down your popup.
Why does my Arcade expression work in ArcGIS Online but not Web AppBuilder?
As Arcade is implemented into different parts of the product, there can sometimes be slight differences in the version of Arcade. See the official answer to this question on the Arcade FAQs, and see the full matrix of Arcade versions throughout the ArcGIS product, visit this page.
More resources and tips:
- ArcGIS Learn Path for Arcade: Try Arcade
- ArcGIS Learn lessons and articles about Arcade
- ArcGIS Blogs about Arcade
- ArcGIS Arcade documentation and guide
- ArcGIS Arcade structure and logic
- ArcGIS Arcade type system
- ArcGIS Arcade functions
- Express Yourself (and your data!) with Arcade Expressions
- Videos from Esri Events or Online tutorials


How I integrate API link in a popup window. I want popup load record from another system using API or have a link in a pop up and click on it send a ajax request to another system. The response is json data and want to show on popup menu.
This is phenomenal! I had no idea that expressions I wrote for my popups or layer styling were available in the “Existing” tab. I just never clicked on it for some reason. Also, this post helped explain why Dashboard destroys my line break formatting within my expression. At least I won’t try to battle it now.