Yes!
Those curious glowing symbols that we just can’t look away from are now available right out of the box in ArcGIS Online…starting now. Now all that Firefly goodness is at your fantastic GIS-slinging cartographically-inclined fingertips. Go forth.

How?
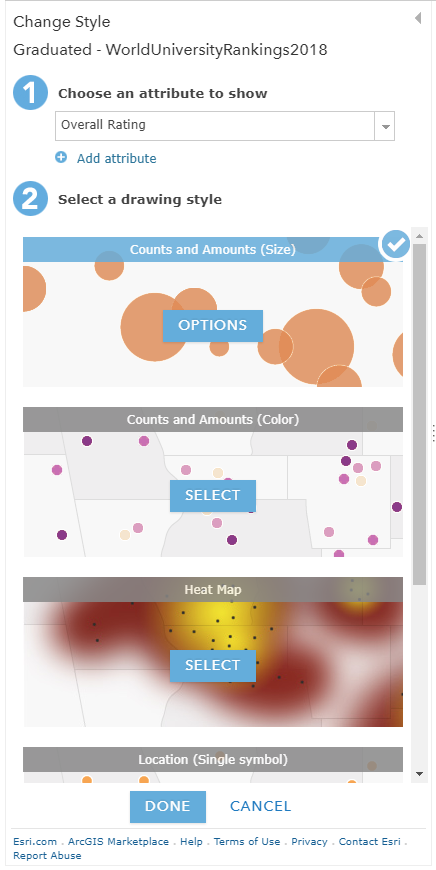
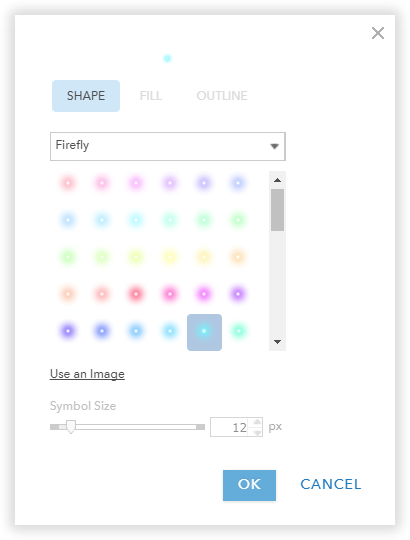
Any point layer in ArcGIS can be given Firefly point symbols. I like to use firefly symbols as graduated symbols to really harness the mesmerizingness of glowing stuff. Here’s the symbolization menu that appears when you choose “change style” for a layer in your ArcGIS Online map. Choose “Counts and Amounts (Size)”.
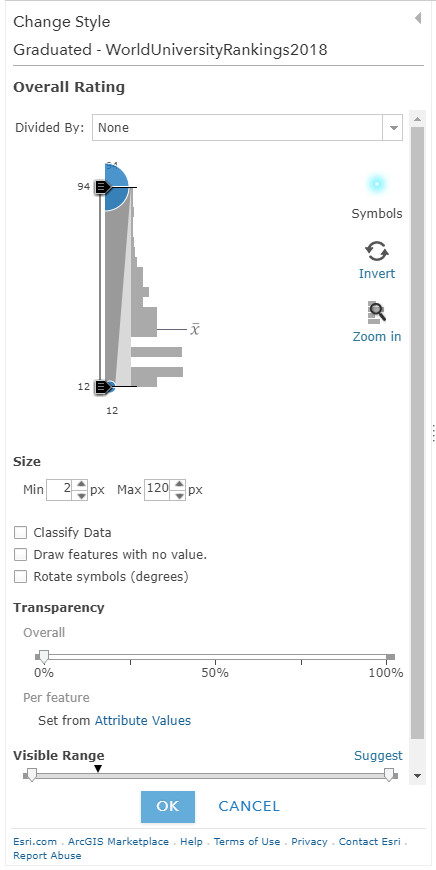
And from there you can click on the “Symbols” button to pop out all sorts of options.
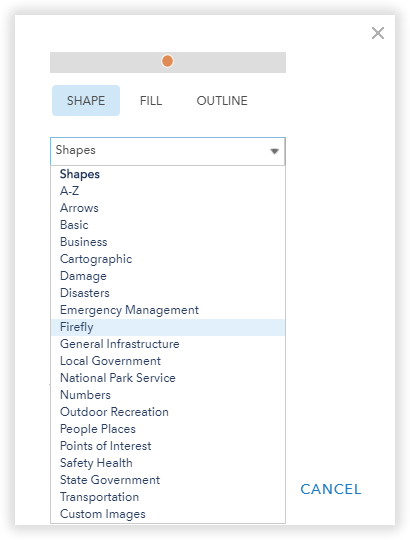
And there, among a host of wonderful symbol categories, you’ll see a sweet sweet little listing called…Firefly.
A single tear rolls down my cheek…
No more self-hosting little firefly symbols all over the web and linking to them manually?
No, John. No more of that. Those days are gone now. This is happening; the old manual assembling of Firefly maps has been swept away –replaced by a fantastic new world order. Firefly symbols are now natively supported in ArcGIS Online.

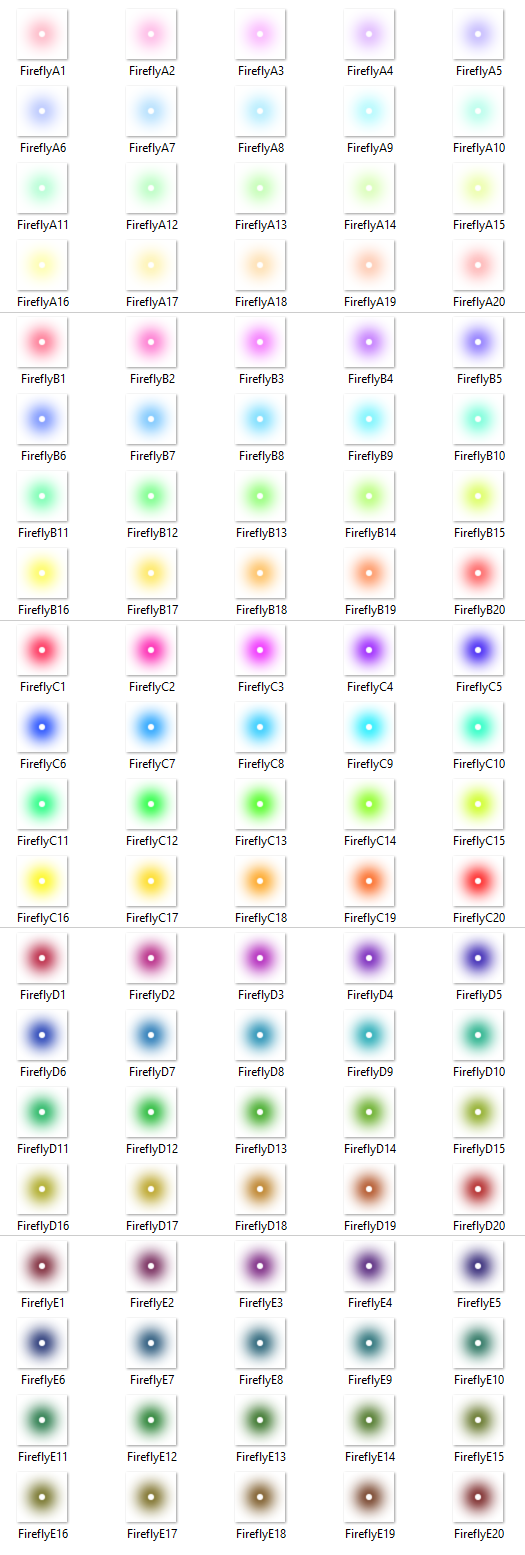
Here’s a look at the whole set. There are 20 hues, each with 5 sets of lightness. Let the soft-edged chroma wash over you…
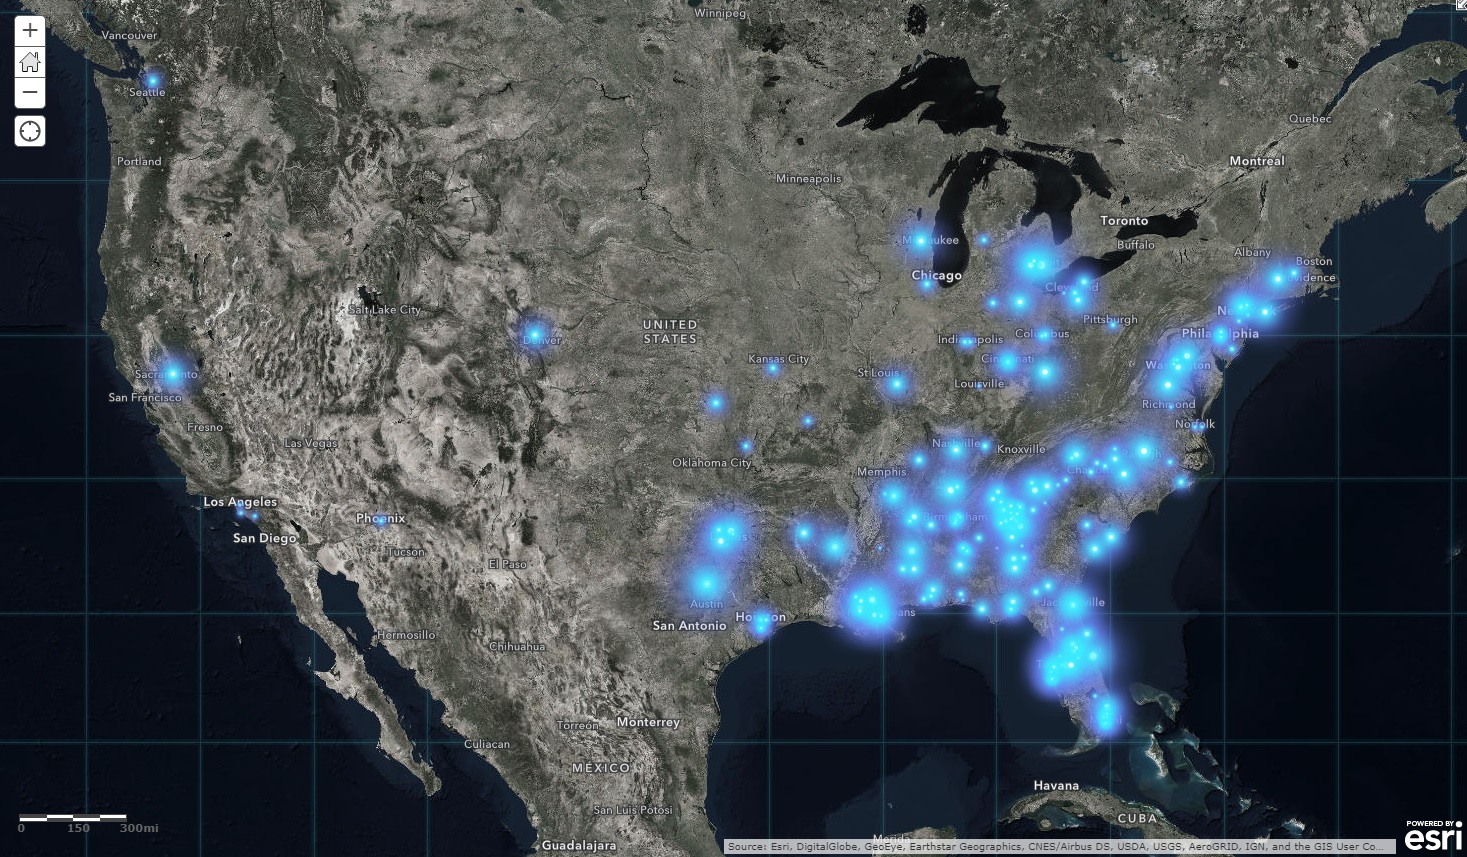
Picking one for the layer symbol gives you a glowtastic Firefly map. Best viewed atop a Firefly basemap, of course. Firefly basemap? Yes.
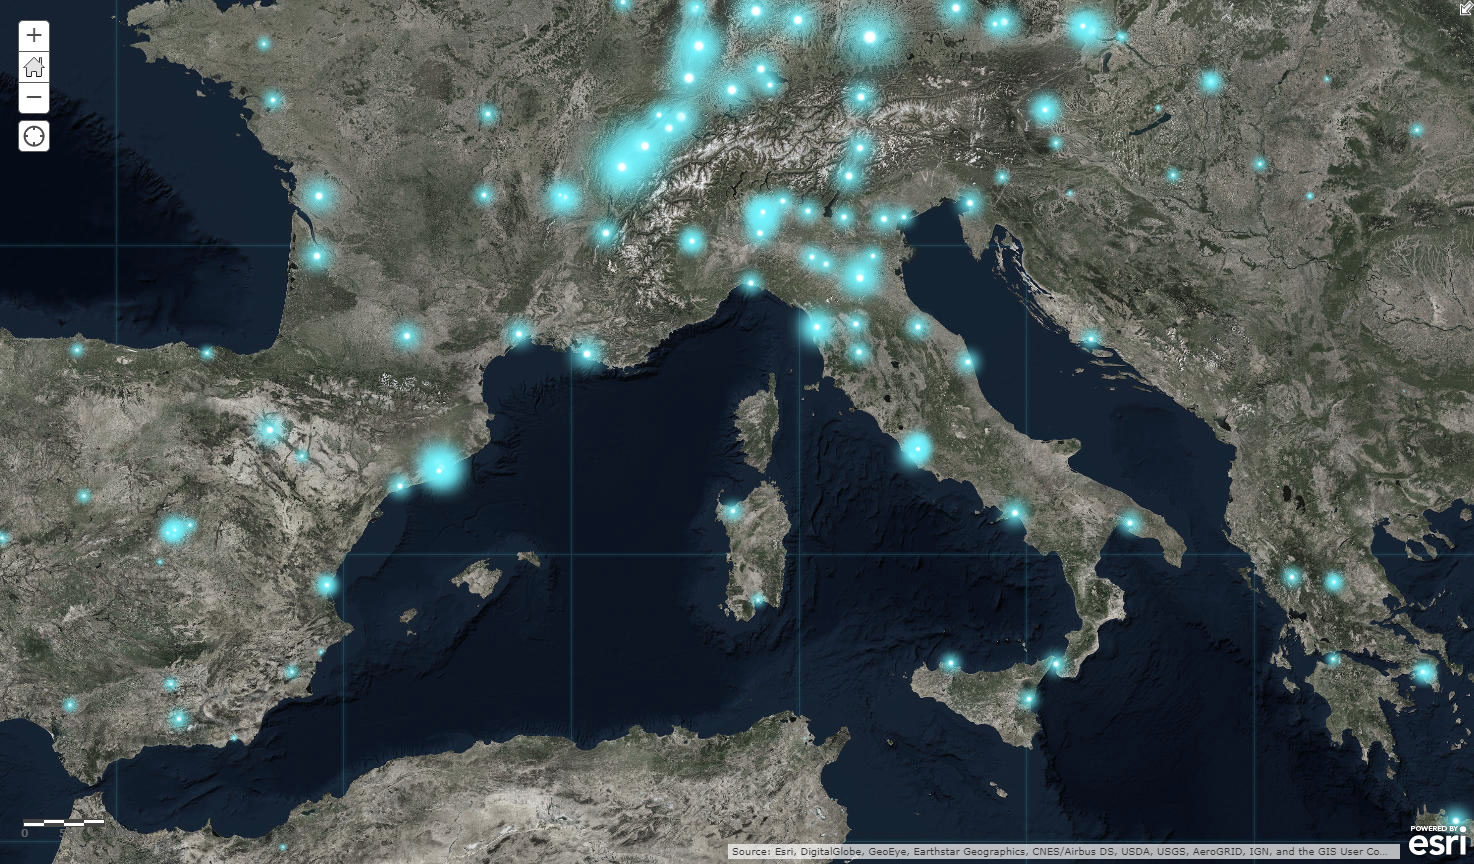
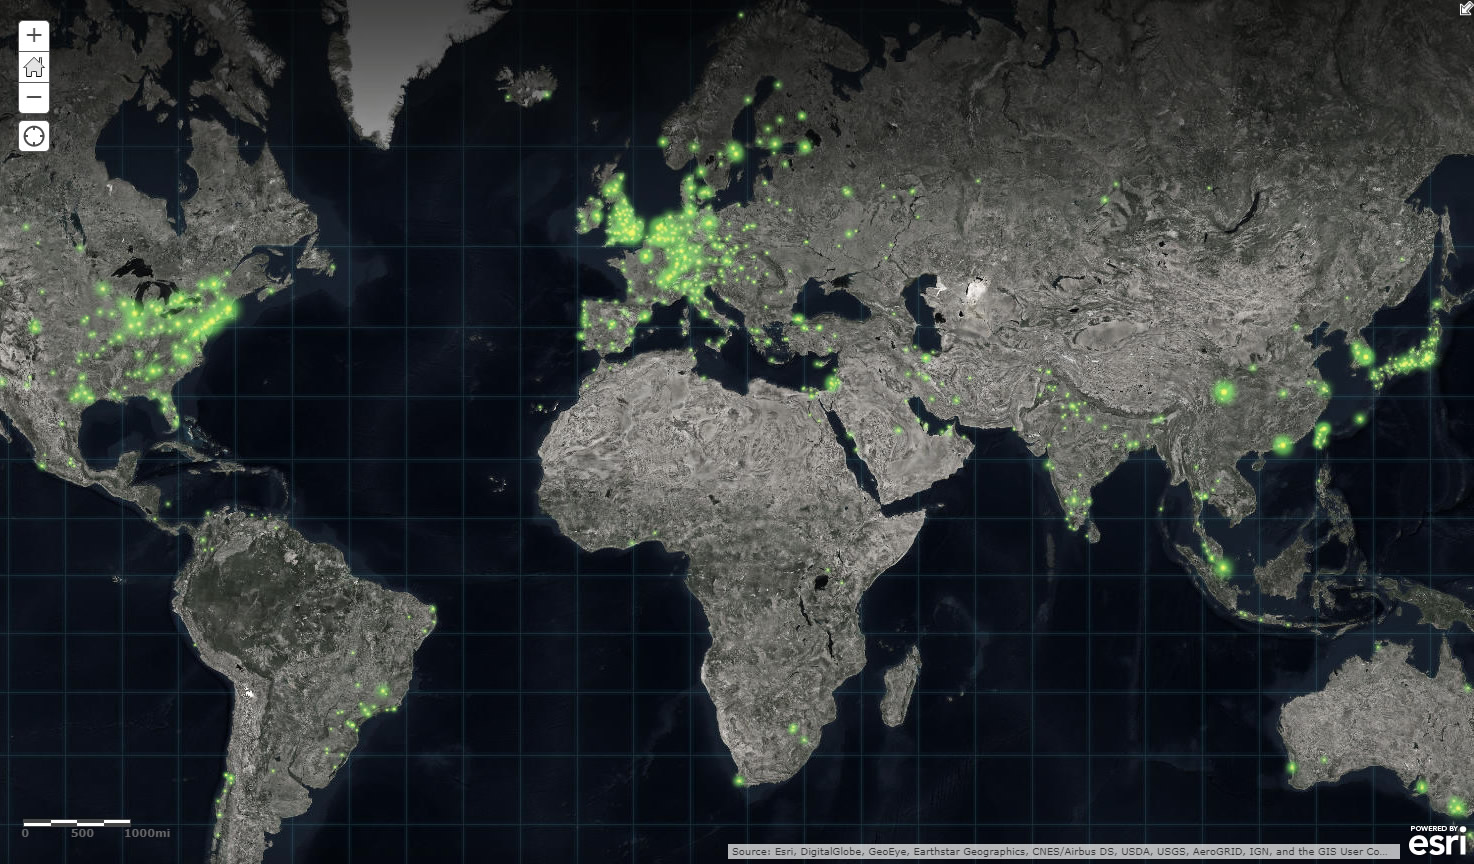
The firefly basemap is designed to increase in color saturation as you zoom in. So at broad scales the imagery is a context-wielding near-black-and-white. At more local levels, the saturation has been stepped up to show street level details in full color.
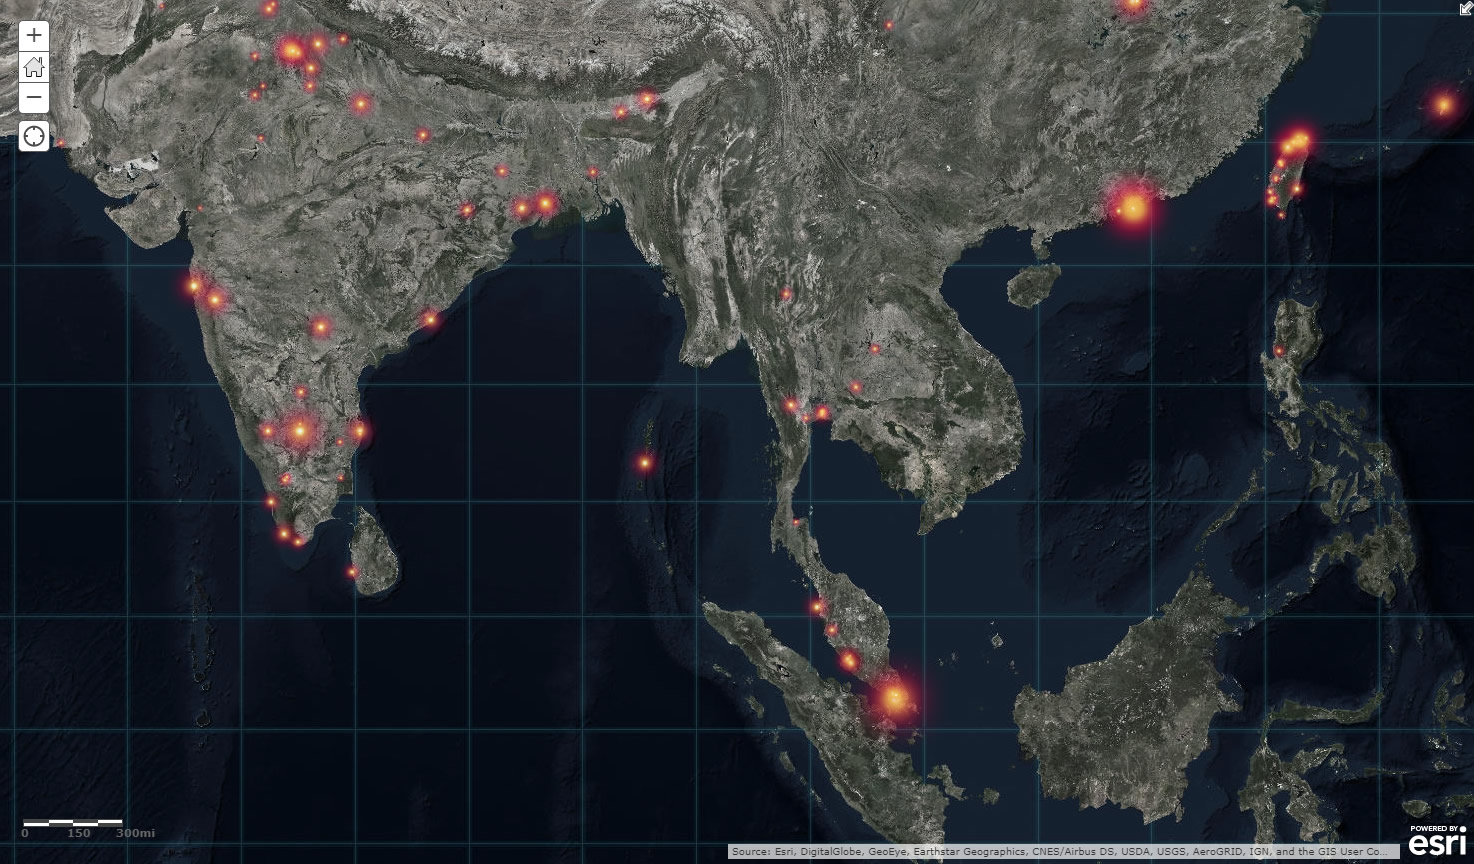
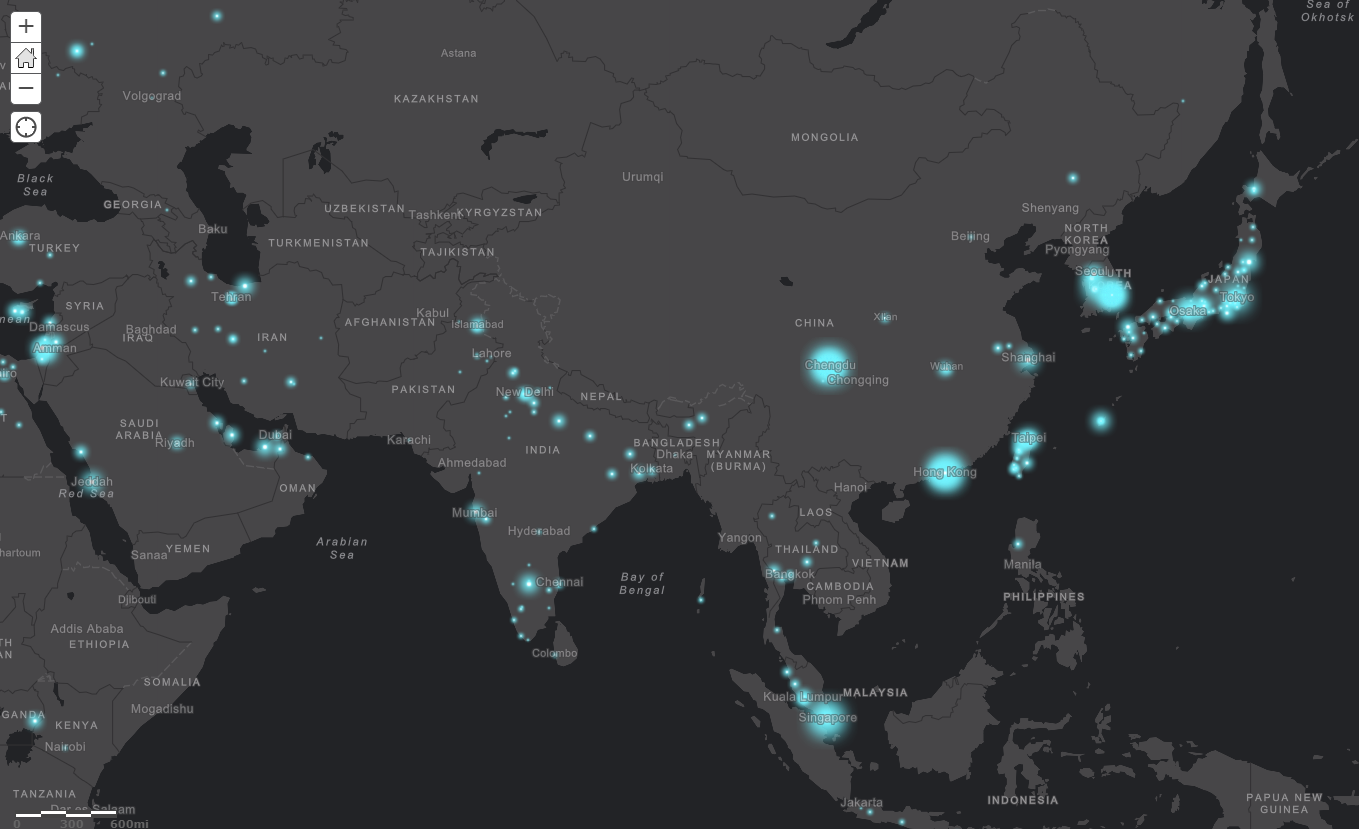
Here’s a near-global view using lime green Firefly symbols…
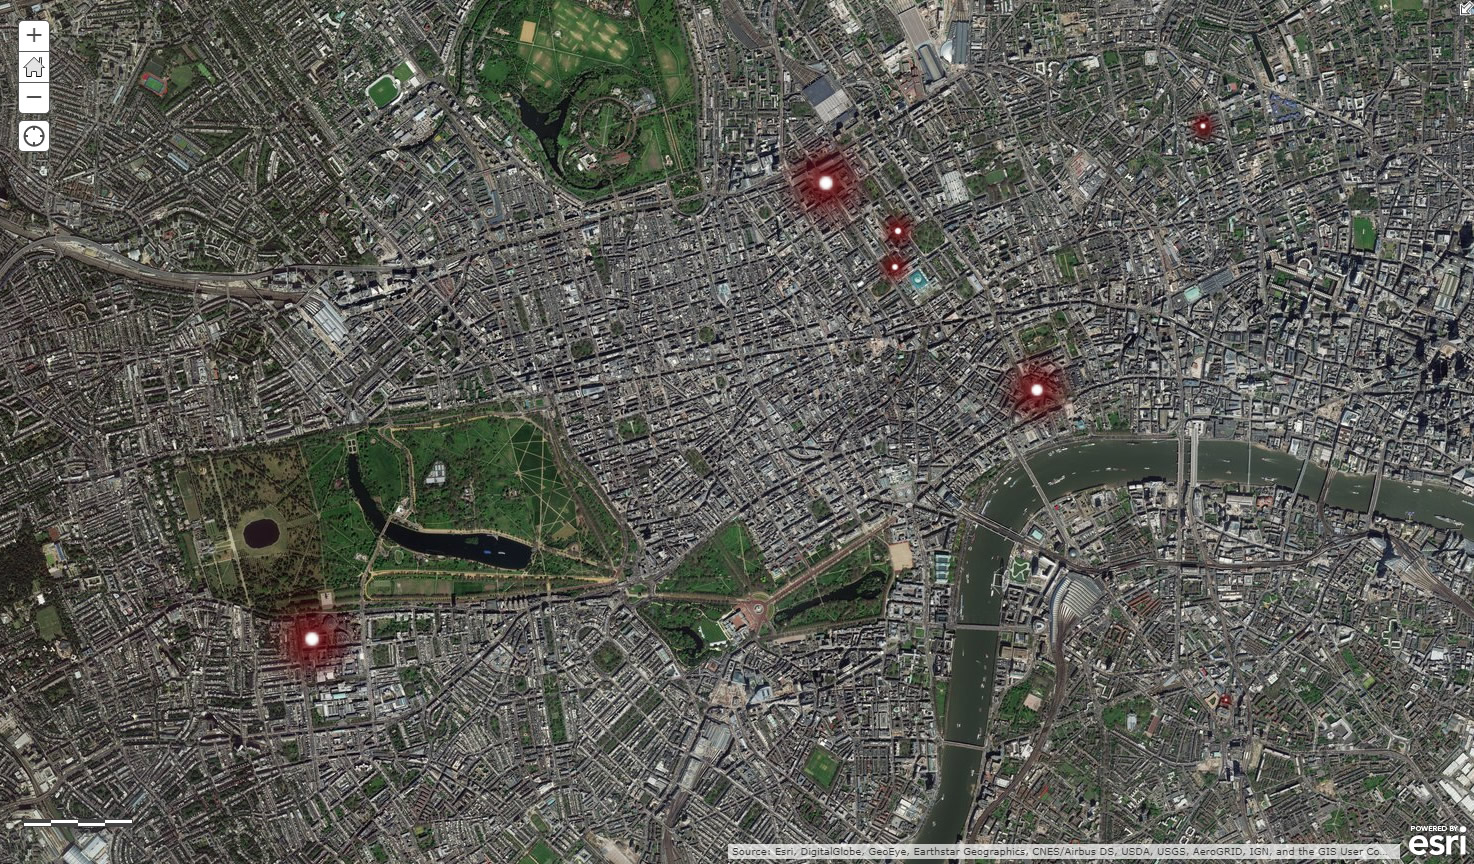
And here is a street level map using deep crimson Firefly symbols…
Firefly Alchemy
A single layer with glowing Firefly symbols is pretty fun. But you can put on your evil scientist hat for a moment and cook up all sorts of chromatic fireworks. By stacking a couple copies of your layer and using a different color, the Firefly symbols blend into a rich multi-dimensional map. The results can be beautiful. The process is certainly fun.
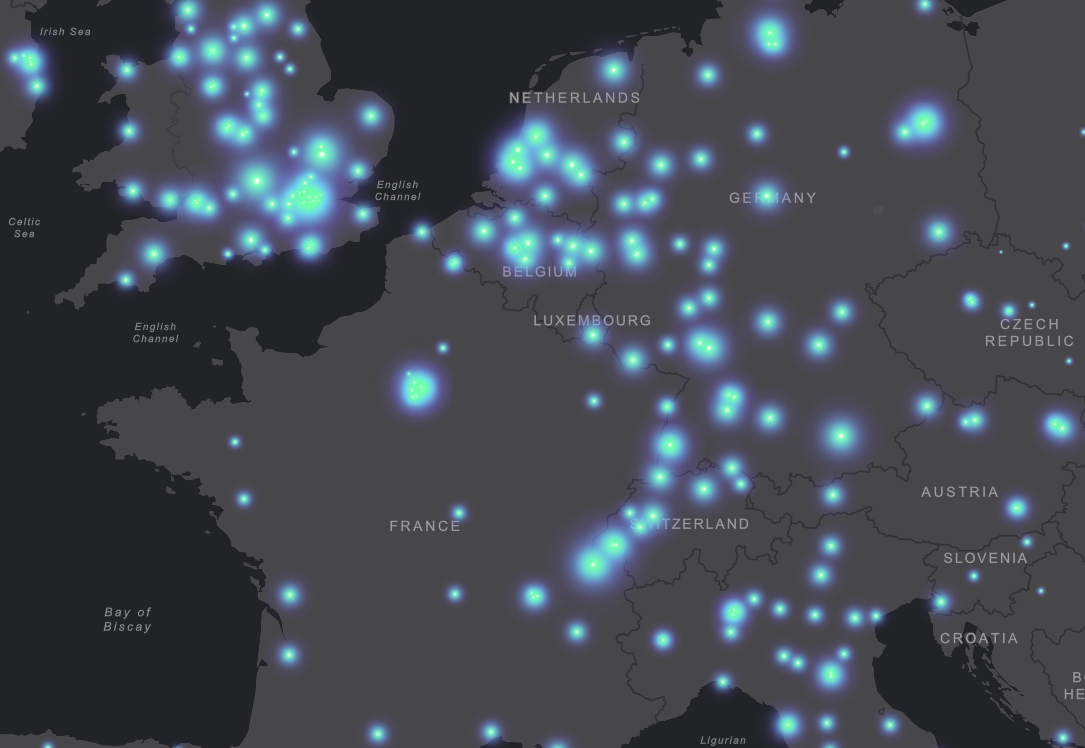
This map uses a deep red below a vibrant yellow…
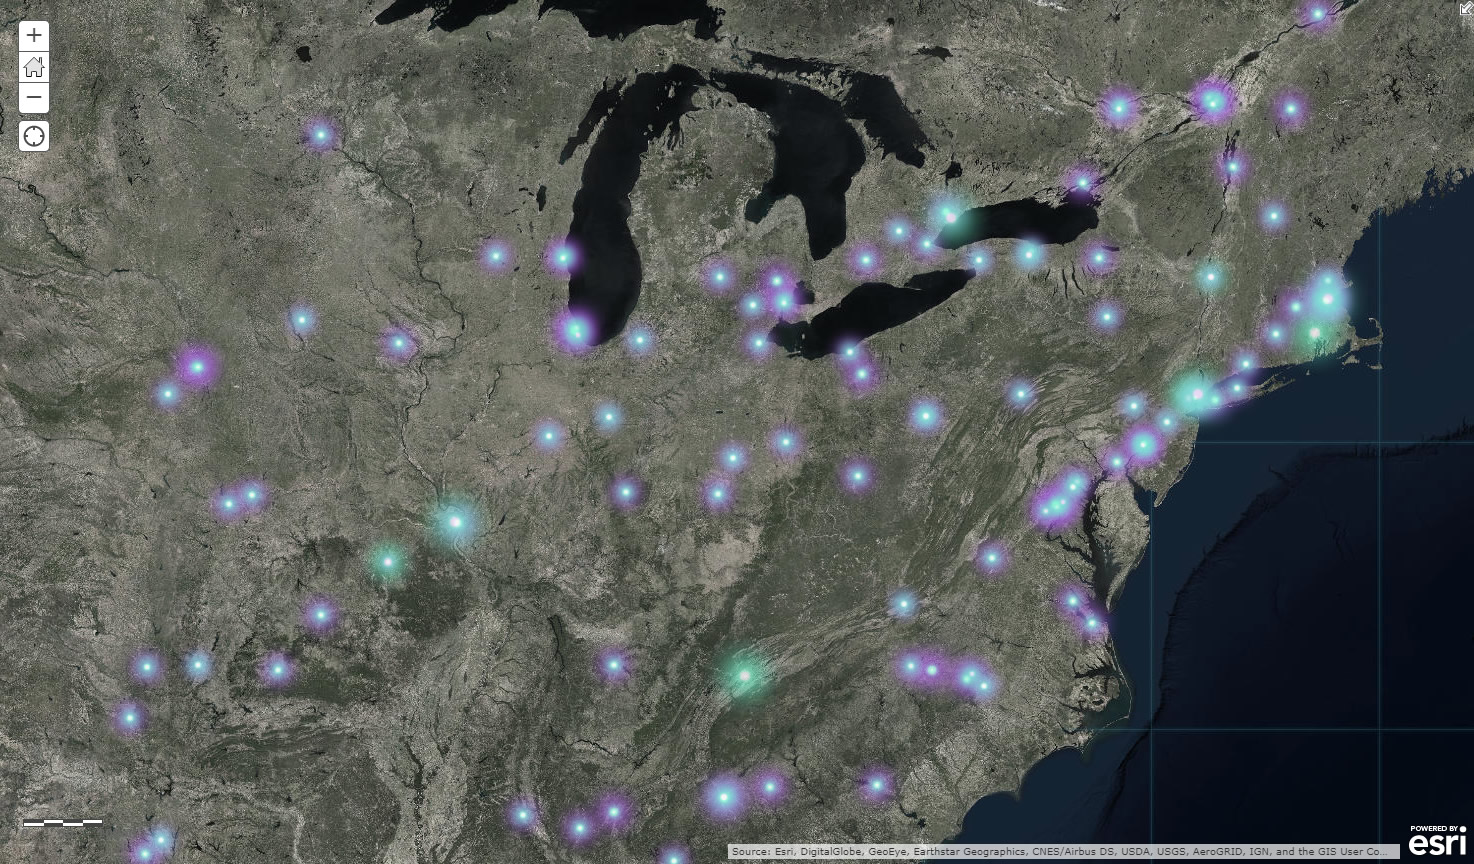
This map uses two layers, each with their own Firefly color, to present a bivariate look at these co-incident points…
Could you use Firefly symbology over non-Firefly basemaps? Yes, but let’s not get too carried away.
Why?
Glowing things are intrinsically visually interesting. Also, they honor Waldo Tobler‘s First Law of Geography, which is “everything is related to everything else, but near things are more related than distant things.” I interpret that as symbols that have a radial decay commensurate with proximity.
So you have an aesthetic urge as well as scientific rationale. What’s more to want? Here is a map with a Firefly base, all set with data (football recruits scaled by their size). Give the firefly symbols a whirl, using the steps above!
Happy Firefly Mapping! John

Article Discussion: