Have you ever needed to perform a local water quality assessment?
Getting started with that process is now made easier by having the EPA Impaired Water Bodies dataset available in ArcGIS Living Atlas of the World.
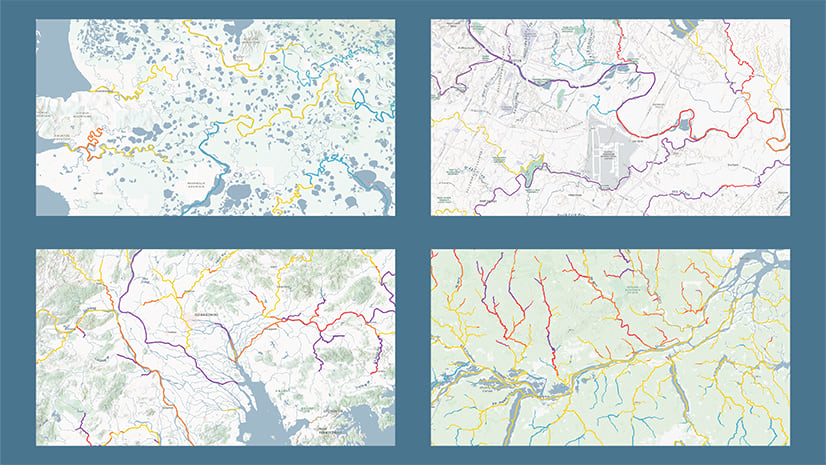
Tracking Water Quality in our Rivers and Lakes
Under Section 303(d) of the Clean Water Act, states and Tribes are required to assess and report water bodies that do not meet water quality standards. These hydrologic features are classified as impaired if they are affected by pollutants or conditions that limit their designated uses—such as drinking water supply, fish consumption, recreation, and more.
Each state or Tribe submits its assessments to the U.S. Environmental Protection Agency (EPA), and in many cases, they also develop restoration plans that include Total Maximum Daily Loads (TMDLs)—the maximum amount of a pollutant that a water body can receive while still meeting standards.
What You’ll Find in the Pop-Up
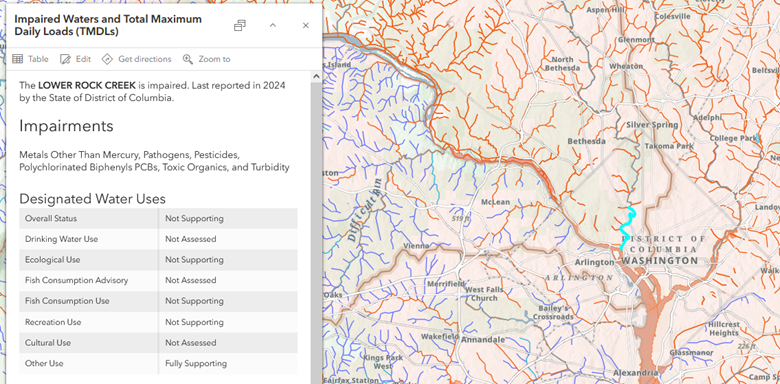
The dataset includes informative pop-ups that summarize key findings from the latest study for each water body.
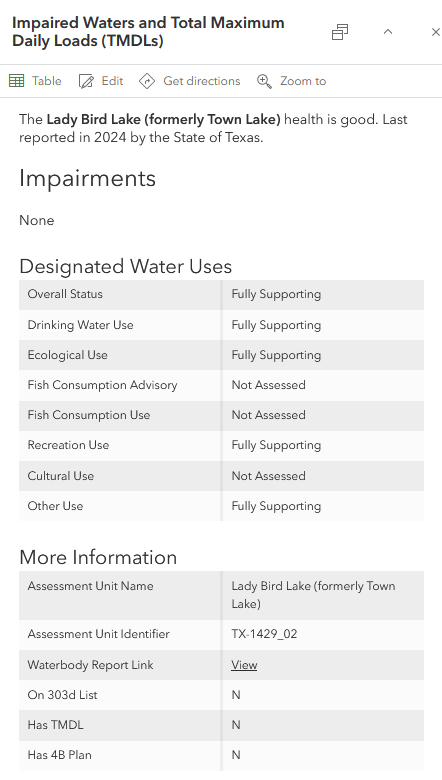
- Name and Date: Name of the water body and last reported date
- Impairment Status: Whether the water body is (1) impaired, (2) unassessed, or (3) not impaired. If a water body is not impaired, it may still be flagged as threatened, meaning its water quality condition was reported as declining.
- List of Impairments: A detailed list of pollutants or conditions affecting the water body.
- Designated Water Uses Restrictions: Information on which uses are restricted, such as drinking water, fish consumption, recreational, or ecological use.
- More Information: Includes the unit identifier and a link to the official assessment report website for further details.
Variability in State Reporting
It’s important to note that reporting methods vary by state. For instance, some states report impairments using subwatershed units, offering a drainage-area perspective. Other states focus on the specific water courses affected within those subwatersheds, providing a more localized view of water quality conditions.
Additionally, water courses may be classified differently across state boundaries due to differences in the types of impairments assessed or gaps in available information.
This variability reflects how each state implements the Clean Water Act, while still contributing valuable data to a unified national dataset.
Use Cases
This dataset is a valuable resource for:
- Watershed planning and restoration
- Environmental impact assessments
- Public health and recreation planning
- Academic research and education
Filtering by Impairments and Upcoming Layer Retirement
The USA Impaired or Threatened Waterbodies item can be easily filtered to focus on specific types of impairments. For instance, the USA Impaired or Threatened Waterbodies by Heavy Metals item uses a view definition query to display only features where:
- Mercury is listed as the cause of impairment or has observed effects, or
- Other metals (excluding Mercury) are identified as the cause or have observed effects.
This allows you to isolate and analyze only those water bodies impacted by heavy metals.
Similarly, you can create custom views based on:
- Specific impairments (e.g., Pesticides),
- Designated uses (e.g., water bodies fully supporting fish consumption), or
- Reporting dates (e.g., last reported before 2024).
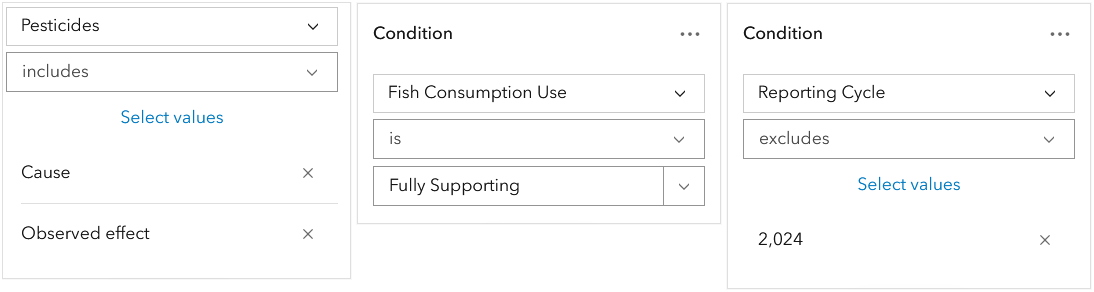
This approach enables you to focus on the most relevant data for your analysis and integrate it into your own applications.
Notice that the USA Polluted Waters map service is being retired and replaced by the USA Impaired or Threatened Waterbodies item. If you’re currently using the USA Polluted Waters or USA Polluted Waters Heavy Metals layers, please update your maps and applications to use the new layers.
Summary
The EPA Impaired Water Bodies dataset is now part of ArcGIS Living Atlas, where it can be used alongside more than 11,000 curated layers including land cover, hydrology, climate, and infrastructure, making it a powerful resource for data-driven decision-making. Among these layers is the National Hydrography Dataset (NHD) Plus High Resolution (HR), which serves as a foundational layer for the EPA impaired waters dataset.
More Information
Visit the official Assessment, Total Maximum Daily Load (TMDL) Tracking and Implementation System (ATTAINS) website. Interested in water resources and GIS? visit the Esri Water Resources industry page or join the Esri Community and ask questions to our experts.

An excellent initiative, Gonzalo—making the EPA’s impaired waters data accessible in ArcGIS Living Atlas is a powerful step for transparency and planning. In Pakistan, we are also facing increasing water quality challenges, from heavy metal contamination to urban wastewater issues. A similar data-driven framework could greatly help us track, assess, and restore our rivers and lakes, while improving public health and resilience.