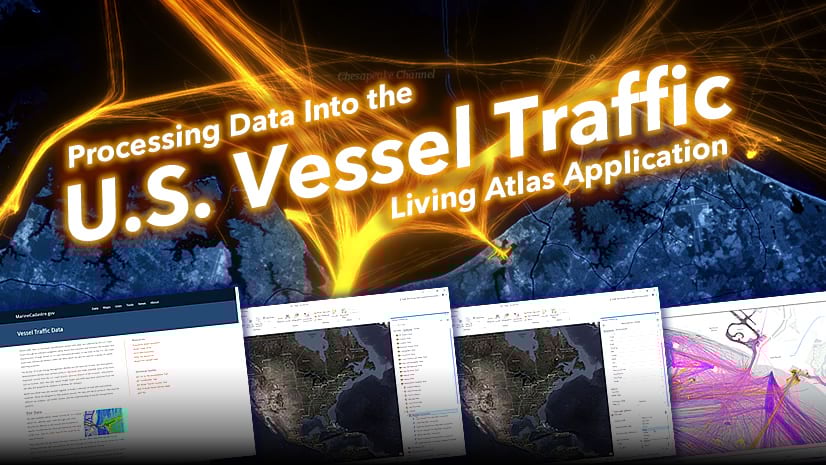
Understanding how vessels move through U.S. waters is critical for effective marine spatial planning, resource management, and ensuring maritime safety. The U.S. Vessel Traffic App provides an extensive archive of vector line track data, capturing the paths of ships as they traverse coastal and inland waterways. However, to truly unlock insights about vessel density and patterns over time—and by vessel group—planners and GIS professionals might need to convert this vector data into raster density maps. This blog post walks through a streamlined, five-tool ArcGIS workflow compiled in Model Builder, designed to make the vector-to-raster transformation efficient and repeatable.
These vessel products would not be available without the diligent work of the Marine Cadastre team. They provide AIS data to the community, through their vessel traffic hub, that allows the creation of apps like the U.S. Vessel Traffic App. This promotes a better understanding of space use conflicts in the ocean and enables marine spatial planning.
Introduction: The Value of Vessel Density Mapping
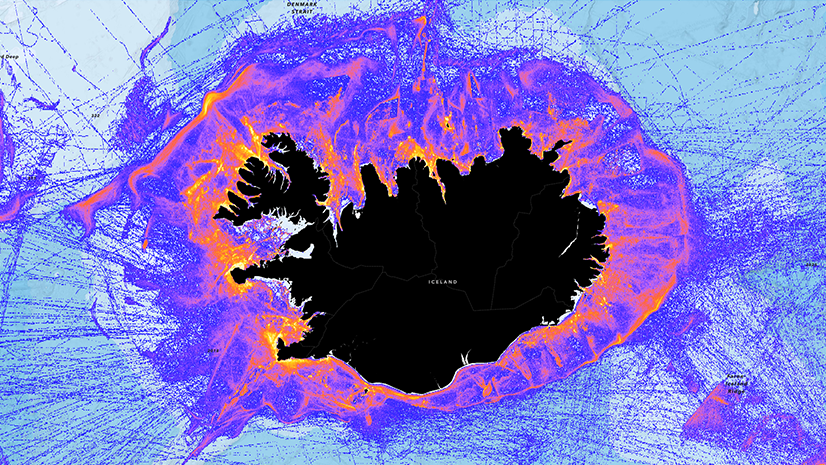
Vessel density maps are essential for visualizing where maritime activity is most concentrated, supporting decisions in marine spatial planning, conservation, and risk assessment. Raster-based density layers enable planners to perform quantitative analyses, such as weighted overlays for suitability modeling, and to communicate patterns clearly to stakeholders. By converting line track data into density rasters grouped by vessel type, we gain actionable information for zoning, impact analysis, and conflict resolution.

Overview of U.S. Vessel Traffic App Vector Data
The U.S. Vessel Traffic App provides downloadable vector line tracks, each representing a vessel’s movement over a specified time frame. These tracks include attributes including vessel group (e.g., cargo, tanker, fishing), timestamp, and spatial geometry. Before analysis, it’s crucial to ensure the data is clean, projected appropriately for your study area, and clipped to the region of interest. You can download a ready to use file geodatabase for each month of vessel traffic data from the U.S. Vessel Traffic App, that is the input for this processing model.
Step 1: Preparing Vector Line Track Data
Begin by downloading data from the US Vessel Traffic App and importing the vessel track feature classes into your ArcGIS project. If needed you can clip the dataset to your analysis boundary, such as a particular port service area or a marine protected area polygon.
Step 2: Summarize Within—Aggregating Tracks by Area and Group
The Summarize Within tool aggregates vessel track data within defined spatial units—such as grid cells, hexagons, or administrative boundaries. Prior to using the tool, I created my own set of 1km square polygons to summarize to; I did this using the Generate Tessellation tool.

For Summarize Within, the output polygons from the Generate Tessellation tool are used as the input polygons and the vessel tracks as the input lines. You can choose to summarize the line lengths or counts by vessel group within each cell, or both. This step produces a new feature class where each area unit contains aggregated vessel activity metrics, organized by vessel group by month.
Step 3: Pivot Table—Reshaping Data for Analysis
After summarizing, your attribute table will have multiple records per area unit (count and length), one for each vessel group. The Pivot Table tool reshapes this data, creating a wide table where each vessel group becomes its own column. This format simplifies further processing, allowing you to compute and compare densities by group within each spatial unit and determine how each vessel group contributes to the total counts. This model transforms the table to pivot both (1) the vessel group data and the count data as well as (2) the vessel group data and the length data separately.
Step 4: Alter Field and Calculate Field—Customizing and Calculating Density Attributes
With your pivoted tables, use the Alter Field tool to rename or clarify field names, making them more descriptive for each vessel group’s metrics. Then, apply the Calculate Field tool to help fill any null values with zeros. These calculated fields are crucial for generating meaningful density rasters.
Step 5: Feature to Raster—Converting Summarized Data to Density Rasters
The Feature to Raster tool translates your summarized vector data into raster format. Specify the density attribute for each vessel group as the value field, set an appropriate cell size for your analysis resolution, and choose the output raster location. The result is a set of vessel density rasters, one per group for count and one per group for length, ready for visualization and overlay analysis.

Model Builder Workflow: Streamlining the Process
ArcGIS Model Builder enables you to chain these five tools—Summarize Within, Pivot Table, Alter Field, Calculate Field, and Feature to Raster—into an automated workflow. By encapsulating the process in a model, you can ensure consistency, save time on repetitive tasks, and easily update analyses when new vessel track data becomes available. The model can be parameterized for different vessel groups, years, or study regions, supporting scalable marine planning initiatives.
Applications: Vessel Density Rasters in Marine Spatial Planning
Density rasters derived from vessel tracks are powerful inputs for weighted raster overlay analyses. Marine planners can assign different weights to vessel groups based on their operational impact, potential conflicts, or conservation priorities. For example, overlaying vessel density with sensitive habitats or proposed infrastructure sites helps identify areas of concern and optimize site selection. This approach supports transparent, data-driven decision-making and facilitates stakeholder engagement by visualizing complex spatial patterns.
Conclusion: Efficient, Repeatable Vessel Density Mapping
By leveraging ArcGIS’s suite of tools and Model Builder, converting U.S. Vessel Traffic App vector line tracks into density rasters becomes a repeatable, efficient process. This workflow empowers GIS professionals and marine planners to perform advanced spatial analyses, supporting suitability modeling and long-term ocean management strategies. As vessel traffic datasets and planning needs evolve, this approach ensures your analyses remain robust, scalable, and actionable for years to come.


Article Discussion: