Populations living on transboundary watersheds are particularly vulnerable to the effects of climate change, and especially to water scarcity due to growing competition among water users. For example, the Okavango River Basin is a transboundary basin in Southern Africa that’s formed deep in the Angola highlands. The Okavango river flows through Namibia before eventually forming one of the world’s most valuable biodiversity hotspots, the Okavango Delta in Botswana. Increasing population, climate change coupled with agricultural and energy sector development needs in Angola and Namibia will negatively impact water resources in the Delta, affecting not only its rich biodiversity, but also a very strong eco-tourism industry that depends upon it.
In a transboundary watershed, the drainage area of surface waters such as rivers, lakes, wetlands, or reservoirs straddle international or regional borders.
How can we identify areas in which countries or international organizations can focus their efforts to help decrease water scarcity? Let’s focus on one of the water challenges faced in transboundary watersheds: the population living within each watershed. In this blog, I’ll show you how to use Living Atlas layers and tools in ArcGIS Pro to create a baseline to start addressing the water challenges in transboundary watersheds.
Rivers and watersheds
Open ArcGIS Pro and add the Esri Hydro Reference Overlay from Living Atlas and the Major Watersheds of the World from World Resources Institute (WRI).
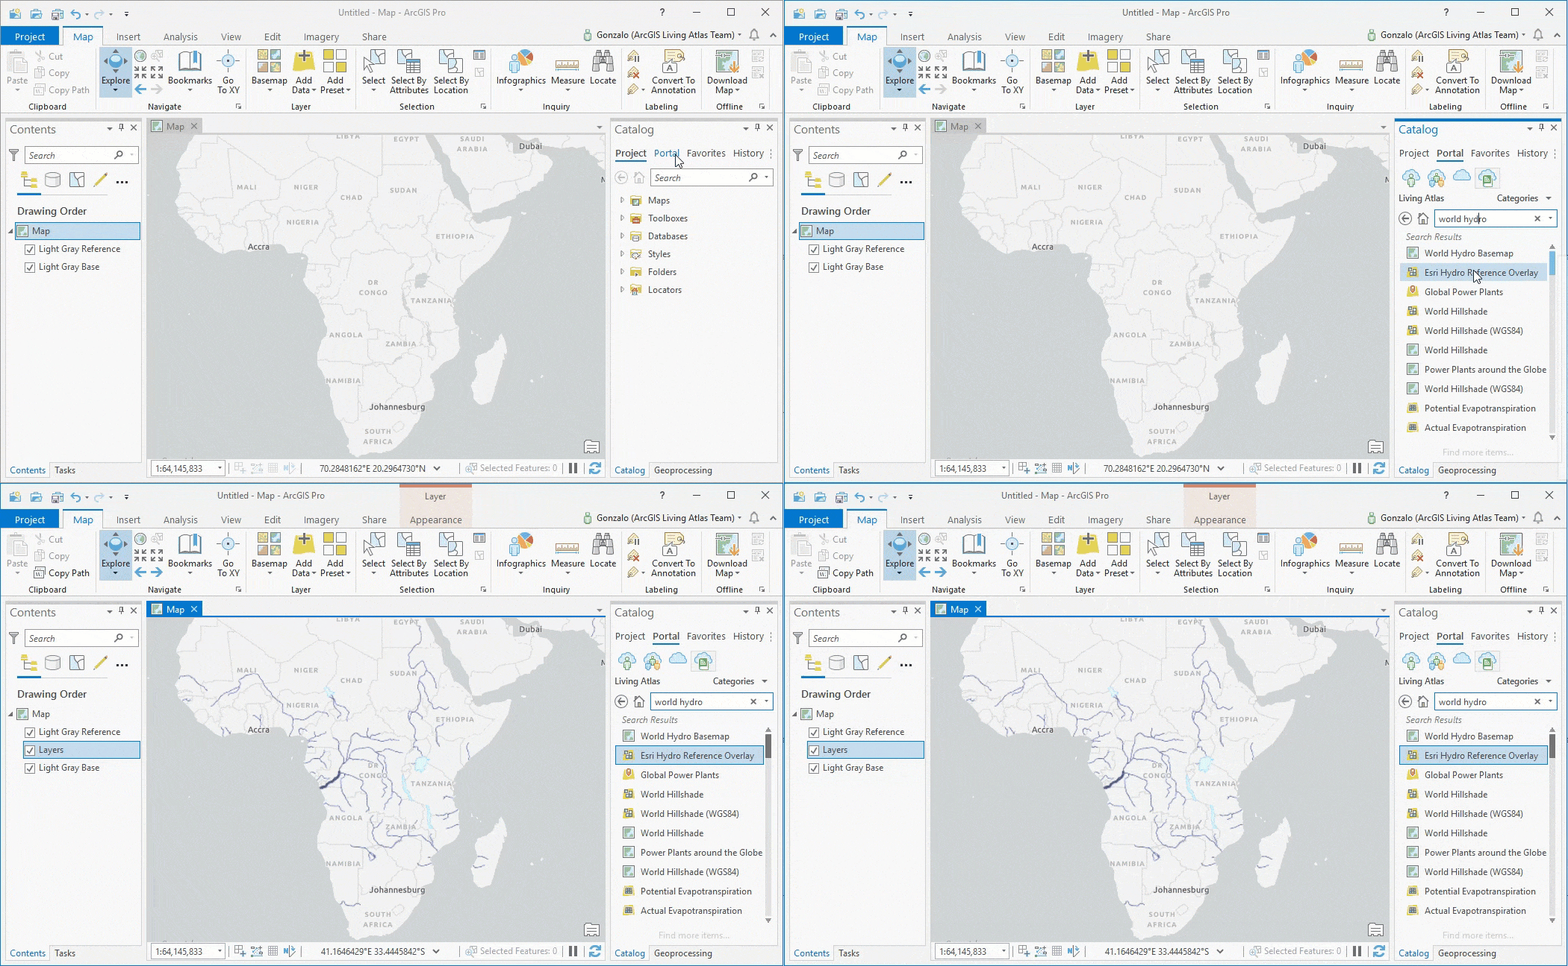
The Esri Hydro Overlay and the World Watersheds display the main hydrologic features of each the region.
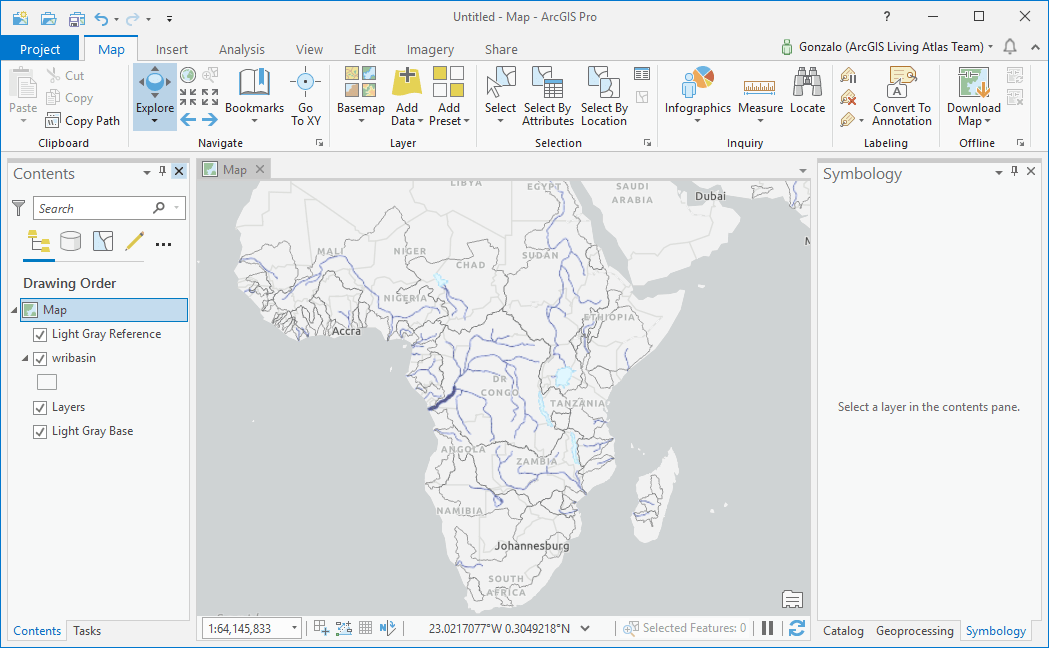
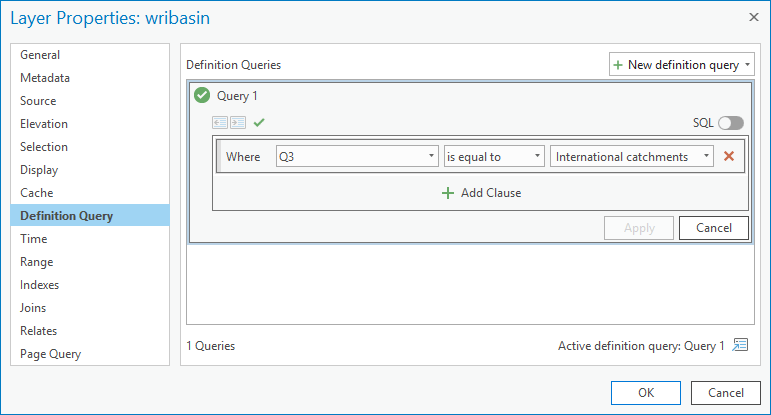
Moreover, we can filter out watersheds that are not transboundary using a definition query.
People
Use the World Population Estimate (WPE) layers to analyze population density as well as the total population within each watershed. The water challenges and solutions differ per region. For example, areas with higher-density urban settlements might have challenges related to water supply and sewerage, whereas low-density rural settlements might have challenges related to soil erosion and securing water resources for food production.

Note: before we use the WPE layers for analysis, we have to select the correct processing template. For each WPE layer, open its Properties and under Processing Templates, select None.
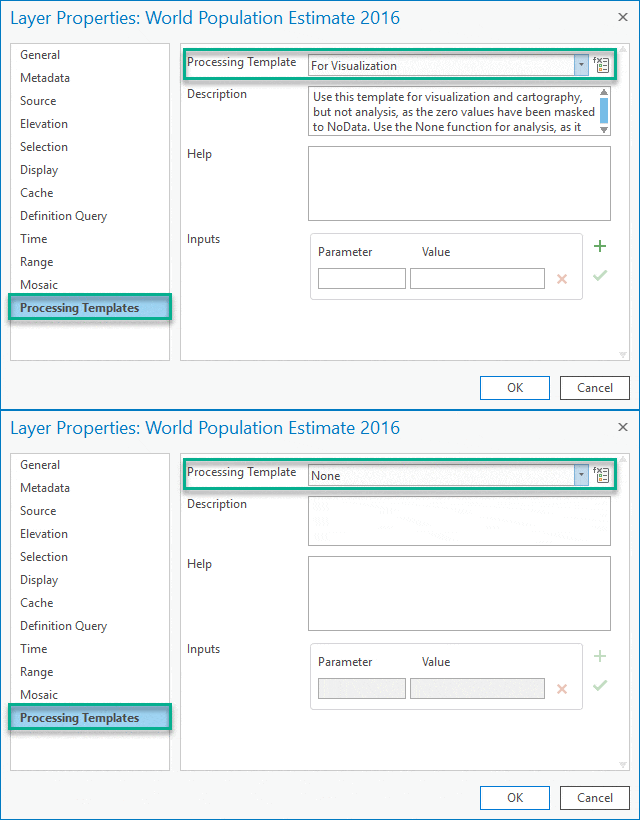
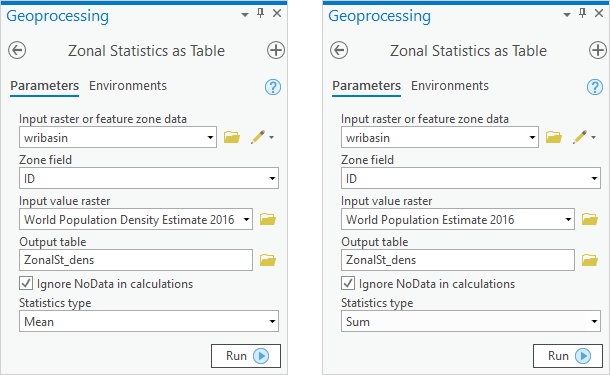
Use the WPE and WRI layers to calculate Zonal Statistics as a Table to estimate mean population density and total population per watershed. The Zonal Statistics as a Table tool computes statistical metrics such as the sum or mean of a raster, in this case population per area of interest within each watershed.
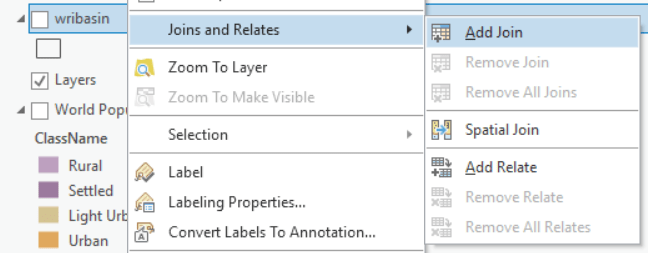
Join both population tables to the WRI watersheds layer using the ID field.
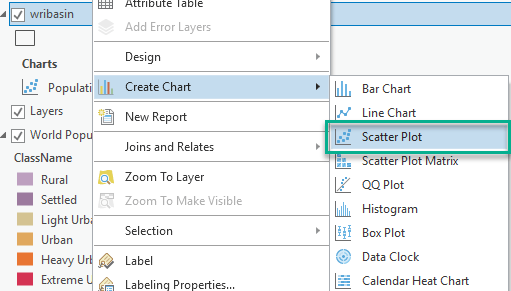
Create a Scatter Plot between the mean population density and the total population on a logarithmic scale.
The population layers combine information from multiple sources, allowing us to create a chart for each watershed beyond international borders. The WPE layer is a good approximation of the populations that are living within each transboundary watershed and their distribution. Notice that the plot is interactive and is linked to the map so that selection on either the map or the plot is displayed together.
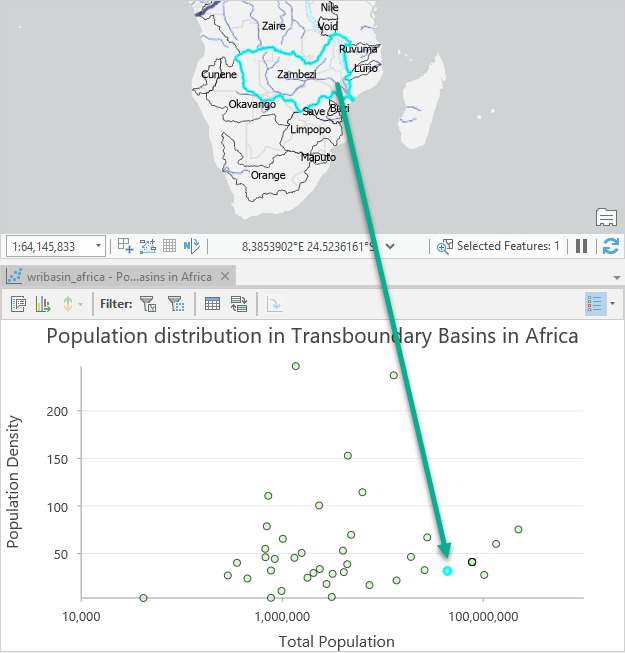
The plot shows population differences between watersheds. For example, neighboring watersheds like the Zambezi and the Okavango have contrasting types of dominant population settlements – such as urban versus rural. Total population also plays a key role. Largely populated watersheds are more vulnerable to water competition and scarcity, which should attract the interest of the international community to provide large-scale solutions.
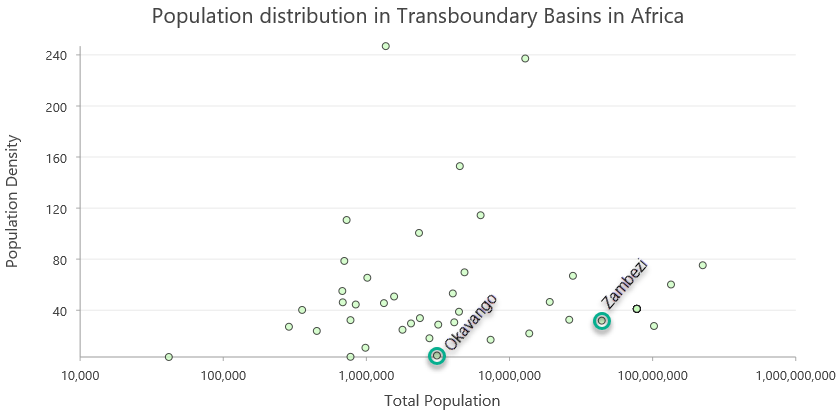
In the previous plot, each point represents a transboundary watershed in Africa from the Major Watershed of the World layer. This analysis is useful at a watershed or continental scale, but it can be refined at lower scales. Let’s see how we can improve our baseline information by delineating subwatersheds using the Zambezi watershed as an example.
Global to local actions
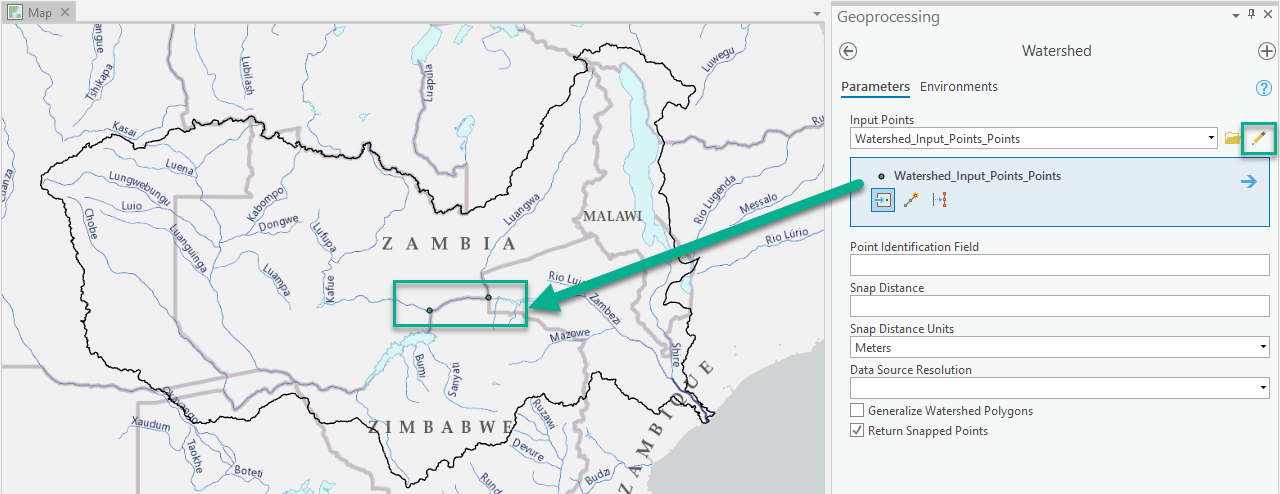
Let’s start to subdivide the Zambezi watershed into different regions using administrative areas or major tributaries to improve the baseline information at a local level. Use the Watershed tool with inputs of the major tributaries (such as the upper Zambezi, Chobe, Kafue or other rivers) to divide the Zambezi watershed into subwatersheds.
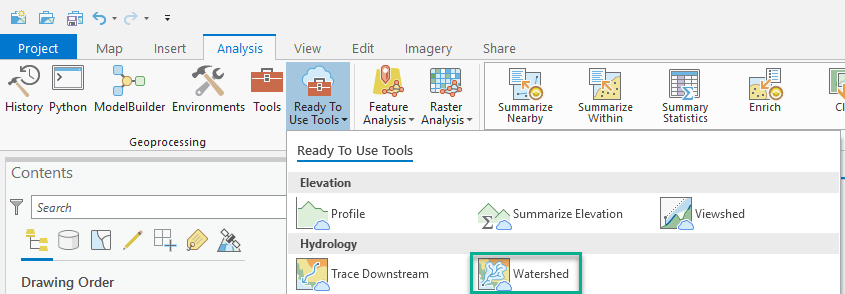
In ArcGIS Pro, under the Analysis tab click on Ready To Use Tools, and select Watershed under the Hydrology section.
Under the geoprocessing window, input the splitting points either by selecting a point feature class or adding them by clicking on the map. Try to click as close as possible to the rivers on the map. You can use the Esri Hydro Overlay layer as a reference.
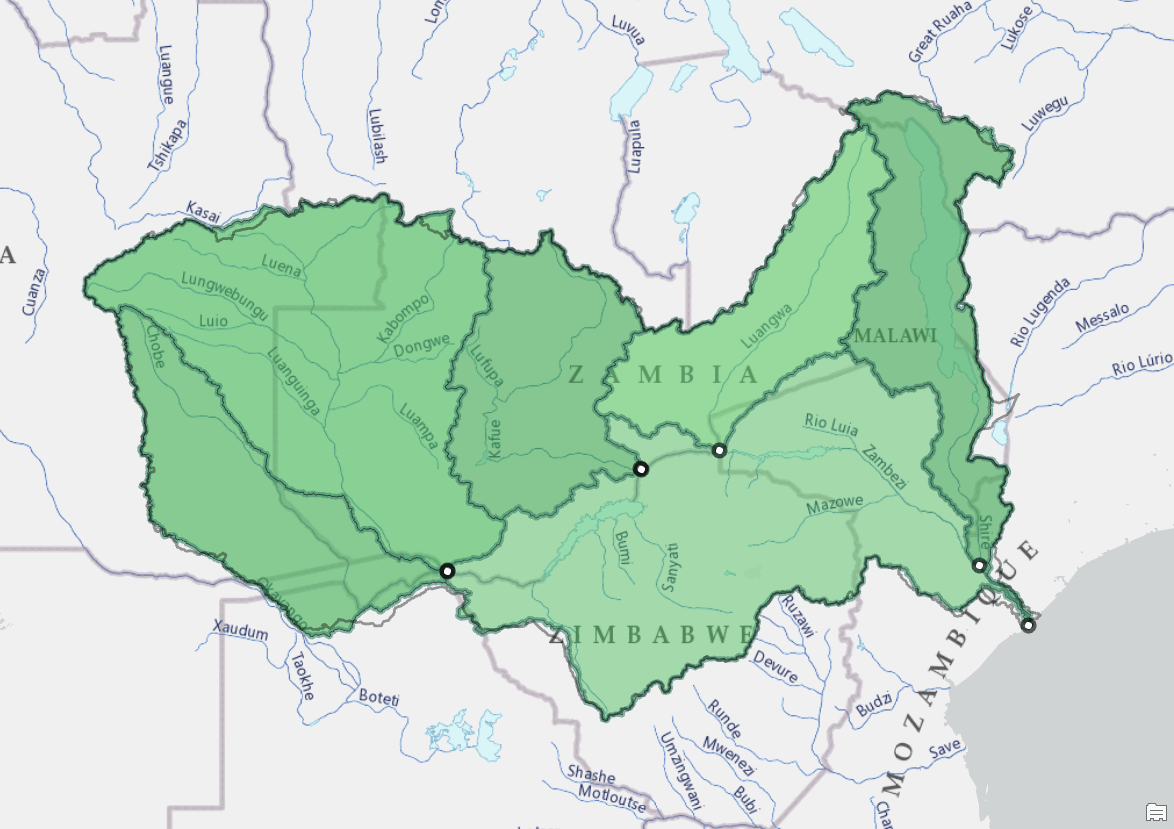
Each input point has a subwatershed associated to it. We can input many points at different locations to divide the watershed into drainage areas that make sense for diverse types of water related projects.
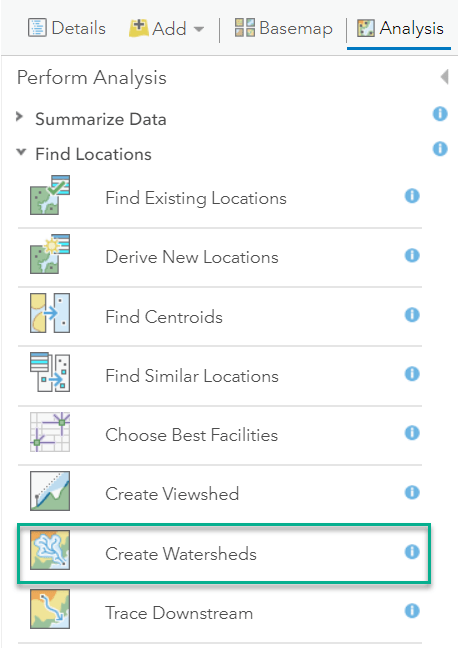
Note: The Watershed tool is also available in ArcGIS Online, under the Analysis tab and the Find Locations menu.
Summary
Populations living on transboundary watersheds are particularly vulnerable to water scarcity. Countries should work together to get the largest benefit (i.e. agricultural, environmental, or public-supply use) of every drop of water, especially under changing climate conditions. The population and water resources layers available in Living Atlas can help us plan better projects, switching from scenarios of water competition to scenarios of water cooperation.
More information?
Join GeoNet and ask a question to our community of experts.
References
Frye, C. et al., (2018). Using Classified and Unclassified Land Cover Data to Estimate the Footprint of Human Settlement. Data Science Journal. 17, p.20. DOI: http://doi.org/10.5334/dsj-2018-020.
Commenting is not enabled for this article.