Is the environment getting better or worse? Trick question. Where are you? What part of the Earth system are you referring to? Better or worse compared to when?
Addressing these questions requires a nuanced approach. Fortunately, the Yale Environmental Law and Policy Center along with The Center for International Earth Science Information Network at Columbia University’s Earth Institute are tackling this challenge.
For the last 22 years they have been compiling the best-available data from organizations around the world to create an Environmental Performance Index (EPI). The 2020 version of the EPI was just released and is now available in ArcGIS Living Atlas of the World.

Effective environmental policy requires data that can drive decisionmaking, hold governments accountable, identify leaders and best practices, and track progress toward science-based targets. The 2020 EPI offers a powerful tool for a variety of stakeholders interested in achieving a sustainable future
In the 2020 EPI release, the country that scored the highest was Denmark with an EPI score of 82.5 out of 100. The EPI team emphasized the fact that all countries have improvements to make, even those who are performing well. To better understand performance, you can view and analyze trends based on location, development and policy progress. The US ranked 24th, at the bottom of rankings for other developed countries. Within the Global South, Nigeria and India rank near the bottom. Drilling down into the individual scores, we can see air quality, biodiversity, and climate change offer the greatest areas for improvement.
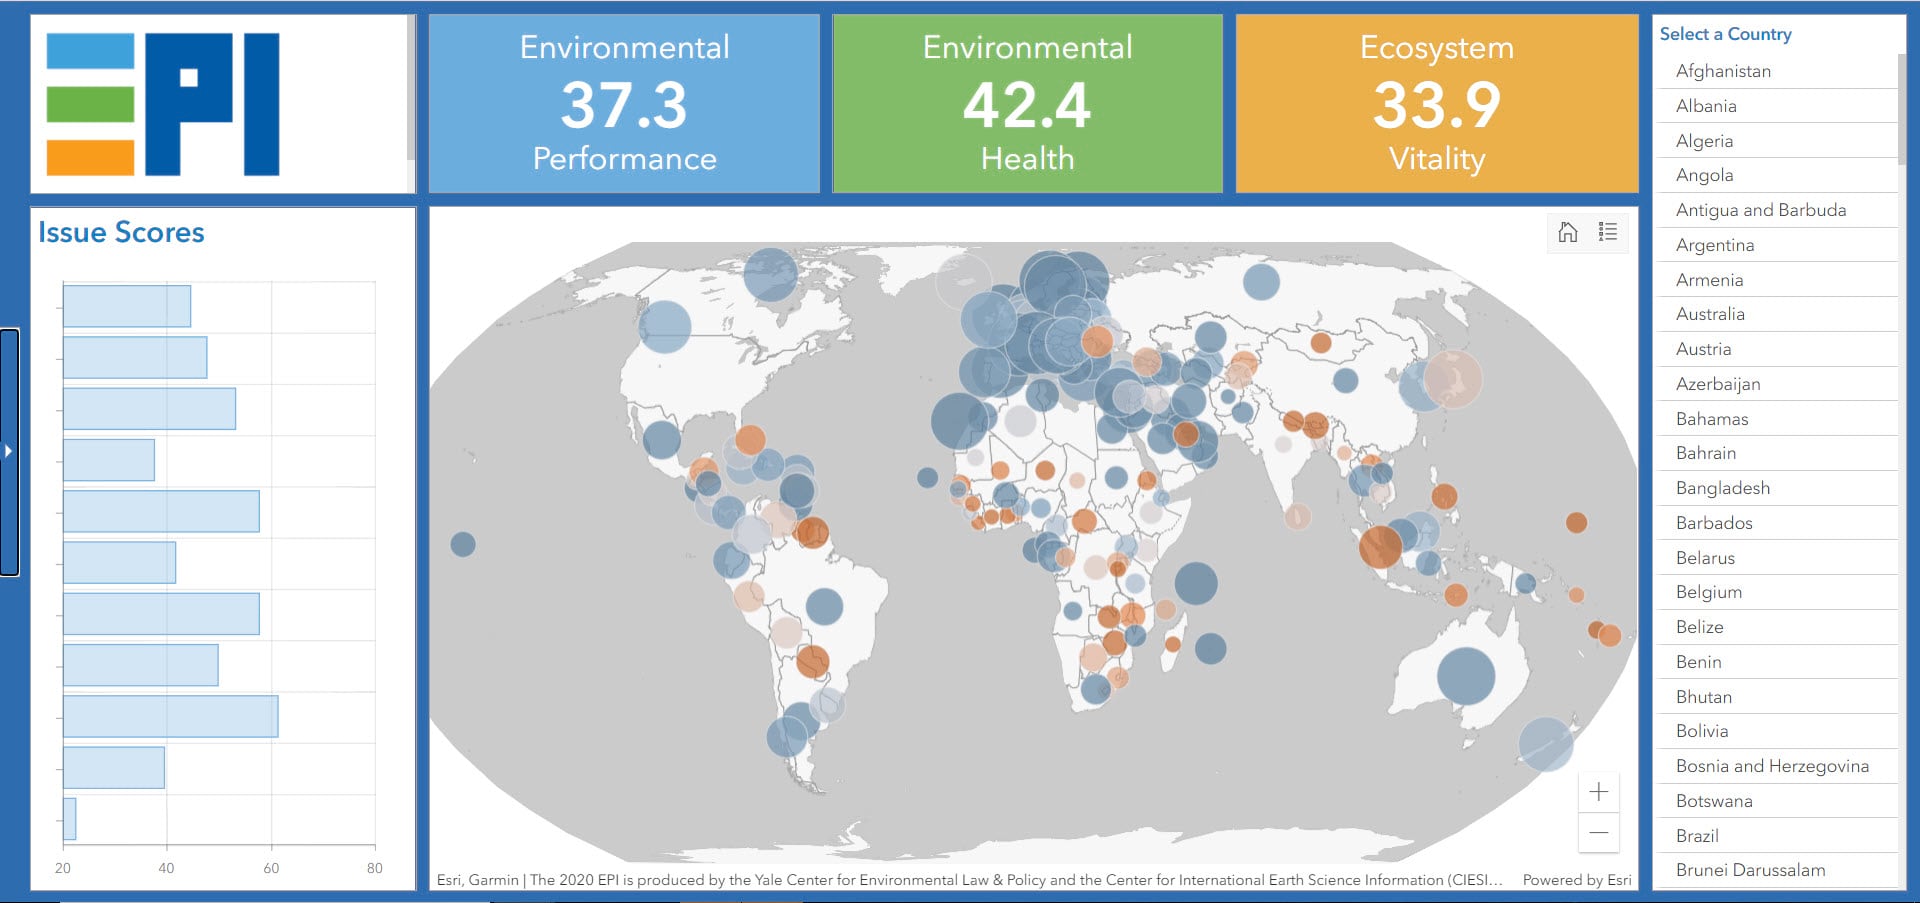
To create a wholistic EPI, the organization measures each country on a variety of individual scores covering environmental health, ecosystem vitality, and new metrics that assess waste management, carbon dioxide emissions from land cover change, and emissions of fluorinated gases. Each of the indicators is weighted to come up with the higher-level scores and rankings.
The EPI serves as a decision support tool, backing up complex conversations about global policies with real-world data. The score helps governments and policymakers understand if regulations and environmental commitments are working. By tracking trends across time, they are able to spot problems and areas of success.
You can add the EPI data to your analysis using the data page below. You can also download the data to use offline, or in other applications.


Article Discussion: