We are living in an era where extreme flooding happens far more than expected. Climate change is increasing the frequency and severity of these events. For the communities in the path of the water, the difference between preparation and disaster often comes down to how well they understand the risk, especially when dealing with climate events that no one has ever seen before.
For years, we have relied on static visualizations (usually blue polygons) to show flooding extents. They often fail to communicate the reality of a flood to non-experts because a blue shape on a map simply does not tell a resident how fast the water is moving or exactly where and when it is breaching. By the time water reaches the location you are trying to protect, it is often too late to act. Effective flood management is not about seeing the inundation; it is about understanding the source. You must know where the water comes from upstream to intercept or divert it before it becomes catastrophic.
In this post, I will show you how to use physics-based simulations in ArcGIS Pro to visualize water rushing through streets and around buildings in a model that helps decision-makers intuitively understand the data.
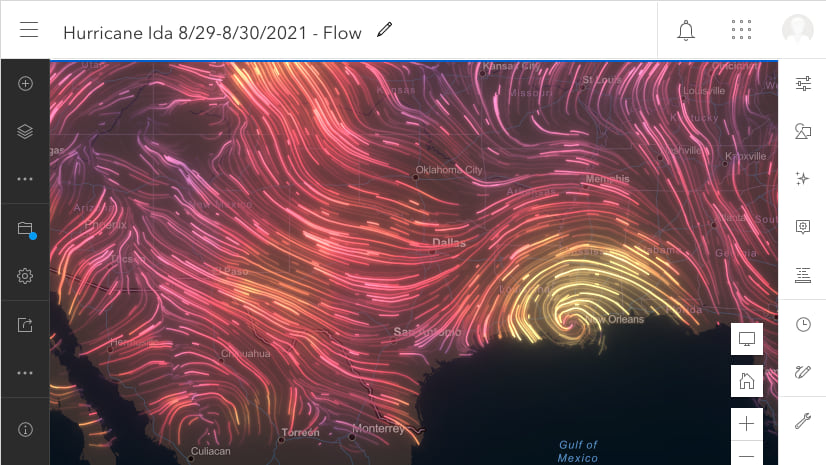
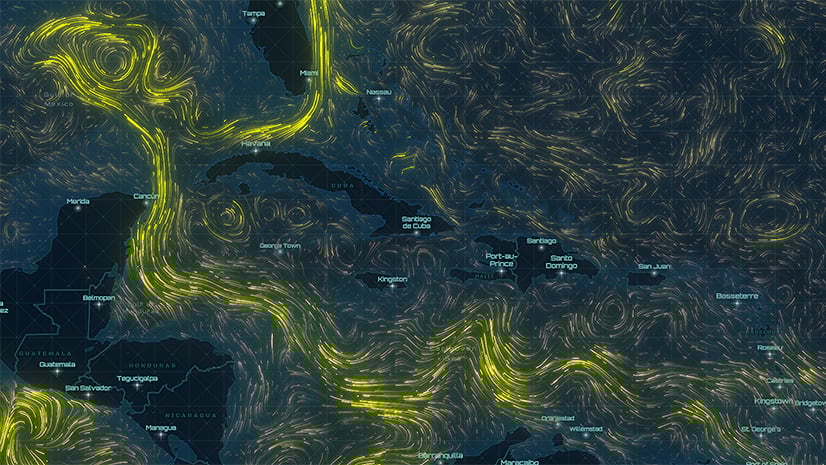
I will then take those high-accuracy simulation results and use FlowRenderer both in Scene Viewer and the ArcGIS Maps SDK for JavaScript to visualize animated streamlines that represent water movement and make them accessible in a browser.
Hurricane Helene in Boone, North Carolina, USA
On September 27, 2024, Hurricane Helene brought devastation to North Carolina.

The town of Boone experienced flooding that many locals had simply never seen before. Most people know how to respond to ordinary heavy rain, yet rare, severe events challenge the expectations we have of our surroundings.
When the water rises and moves that fast, “flood zones” on a paper map become abstract. A 3D simulation, however, doesn’t just show where flooding will occur, but it reveals where the water is coming from and how it will move through the landscape, so that people can clearly see which buildings and roads are impacted, at which elevations the risk is higher, and how low-lying areas will react to overwhelming amounts of water.
In this blog post, we will use the context of this specific flood in Boone to simulate the rainfall, watch the accumulation, and then publish those results to ArcGIS Online to visualize the water’s velocity and direction using the FlowRenderer in a 3D web scene.
Create a flood simulation in ArcGIS Pro
The Flood Simulation tool in ArcGIS Pro is powerful, and it applies shallow water equations within a defined Area of Interest (AOI) to model exactly how water moves across the landscape. You can adjust rainfall intensity, add barriers, and define infiltration rates. For more details and configuration options, check out Flood simulation in ArcGIS Pro Documentation and Flood Simulation Technical Paper. Here is a basic setup I created for this scenario.
Configuration
- Open ArcGIS Pro and create a Local Scene.
- For a local simulation like this, you want to minimize distortion. A Projected Coordinate System like UTM (Universal Transverse Mercator) preserves shapes and angles, which is important when you are calculating how water moves around physical obstacles (e.g., buildings). For Boone, I’m using WGS 1984 UTM Zone 17N.
- Navigate to the Analysis tab, then Simulation, and select Rainfall.
- Here you define your analysis extent or Area of Interest (AOI) by drawing a polygon around the area you want to simulate (e.g., downtown Boone).
- Once the AOI is set, you need to specify the conditions of the weather event. You can set among the others:
- Rainfall Rate: How many inches/millimeters per hour? (e.g., 2.5 inches or 65 mm per hour)
- Duration: How long does the event last? (e.g., 30 minutes)
- By default, the simulation takes into account all visible layers in your 3D scene, including your 3D buildings. This means the water will flow around houses and down alleyways.

Run
At this point, you can run the simulation. Depending on your hardware and the size of your AOI, this might take a moment. As it processes, you will see the water move and accumulate in your scene.
Export
With the simulation data ready, the next step is to visualize it on the web for easy sharing. Before doing that, I first need to export the results.
- Go to Simulation > Export > Export Analysis Results.
- Format: Select CRF (Cloud Raster Format). This is a multidimensional format that supports time and multiple bands.
- Start Time: Set the start time for the exported dataset. This can represent the actual time of a real event or a representative time for a hypothetical scenario. This is what links your exported time slices to the time slider in visualization tools, enabling temporal navigation through the simulation results.
- Select only the Water Velocity as your output option because FlowRenderer needs magnitude (speed) and direction. The “Water Velocity” export provides the U and V components (East-West and North-South vectors) required to draw animated streamlines.
Visualizing results on the web with FlowRenderer
Now that we have our .crf file, we are going to publish a Hosted Tiled Imagery Layer and then visualize the flood simulation as FlowRenderer in Scene Viewer.
Publish to ArcGIS Online
- Log into ArcGIS Online and go to your Content.
- Click New Item -> Imagery Layer.
- Select Tiled Imagery Layer (this ensures high performance).
- Select One Image.
- Drag and drop your exported .crf folder into the upload area.
- While all the files in the .crf folder are being loaded, click the Configure properties button. Here you will see a Source Type dropdown. You need to select Vector-UV.
Visualization using Scene Viewer
The easiest way to visualize and share your data is using Scene Viewer which supports flow style for imagery layers since October 2025.
- Open your new Imagery Layer in Scene Viewer.
- Initially, you will receive a warning that the default “Vector Field” is not supported. Open the Layer Style panel and select Flow.
- You will see the water rushing down the streets of Boone. You can modify the styling of the streamlines by controlling the
density, thelength, and thewidthof the streamlines, and how thecolorramps map to the water speed. To better understand how these parameters work, read the FlowRenderer API Reference. - Flood simulations typically involve low numerical magnitudes with high impact. For example, water velocities around 2 m/s are already considered dangerous in flood scenarios, even though they appear small compared to other vector datasets. To ensure these subtle but critical streamlines remain visible, Scene Viewer provides a length scale factor option. Enabling the 10× factor is therefore necessary to compensate for low magnitudes and clearly communicate risk and movement that would otherwise be difficult to see.
- Thanks to the time dimension of the tiled imagery layer, we can visualize the change in time. At the beginning, the ground is mostly dry. Then, water begins to accumulate in flat areas, gradually spreading across the landscape. By the end, the river breaches, sending fast-moving water through the main channels and significantly increasing flow velocity.
You can explore the visualization directly in Scene Viewer with this web scene with the flow parameters and layers already configured.
Visualization using ArcGIS Maps SDK for JavaScript
For those of you building custom apps, you can implement this programmatically using the ArcGIS Maps SDK for JavaScript. To see how the FlowRenderer is used in a 3D scene with an ImageryTileLayer (as published in the previous steps), check out these samples:
As we have seen, seeing water move in 3D changes how we think about risk. Velocity matters. Context matters. When you can watch the water rushing down a street you know, the numbers stop being abstract.
To show what that looks like, here is a short video: it begins with actual footage of the Boone flood and then transitions to the Scene Viewer simulation using FlowRenderer. The scene has the same camera angle, so you can see how closely the model matches reality.


Article Discussion: