ArcGIS Blog

3D Visualization & Analytics

ArcGIS Online

What’s New in Scene Viewer (February 2025)

By Jasmine Du

We’re excited to announce the first release of 2025! This update brings a host of powerful new features designed to enhance how you explore and share 3D stories. With key updates focused on improving layer support, Scene Viewer continues to evolve as the go-to tool for immersive 3D experiences.

View multiple BIM models

The experience of exploring Building Scene Layers (BSL) in Scene Viewer has come a long way since its initial release. With the new feature to toggle on or off “Show Full Model”, you’ll enjoy a more intuitive and detailed view of all BSL models in your scene. This enhancement makes it easier for you to compare and analyze structures, helping you make more informed decisions. Whether you’re managing assets, inspecting construction sites, or exploring expansive areas like campuses and airports, this update is designed to streamline your overall experience.
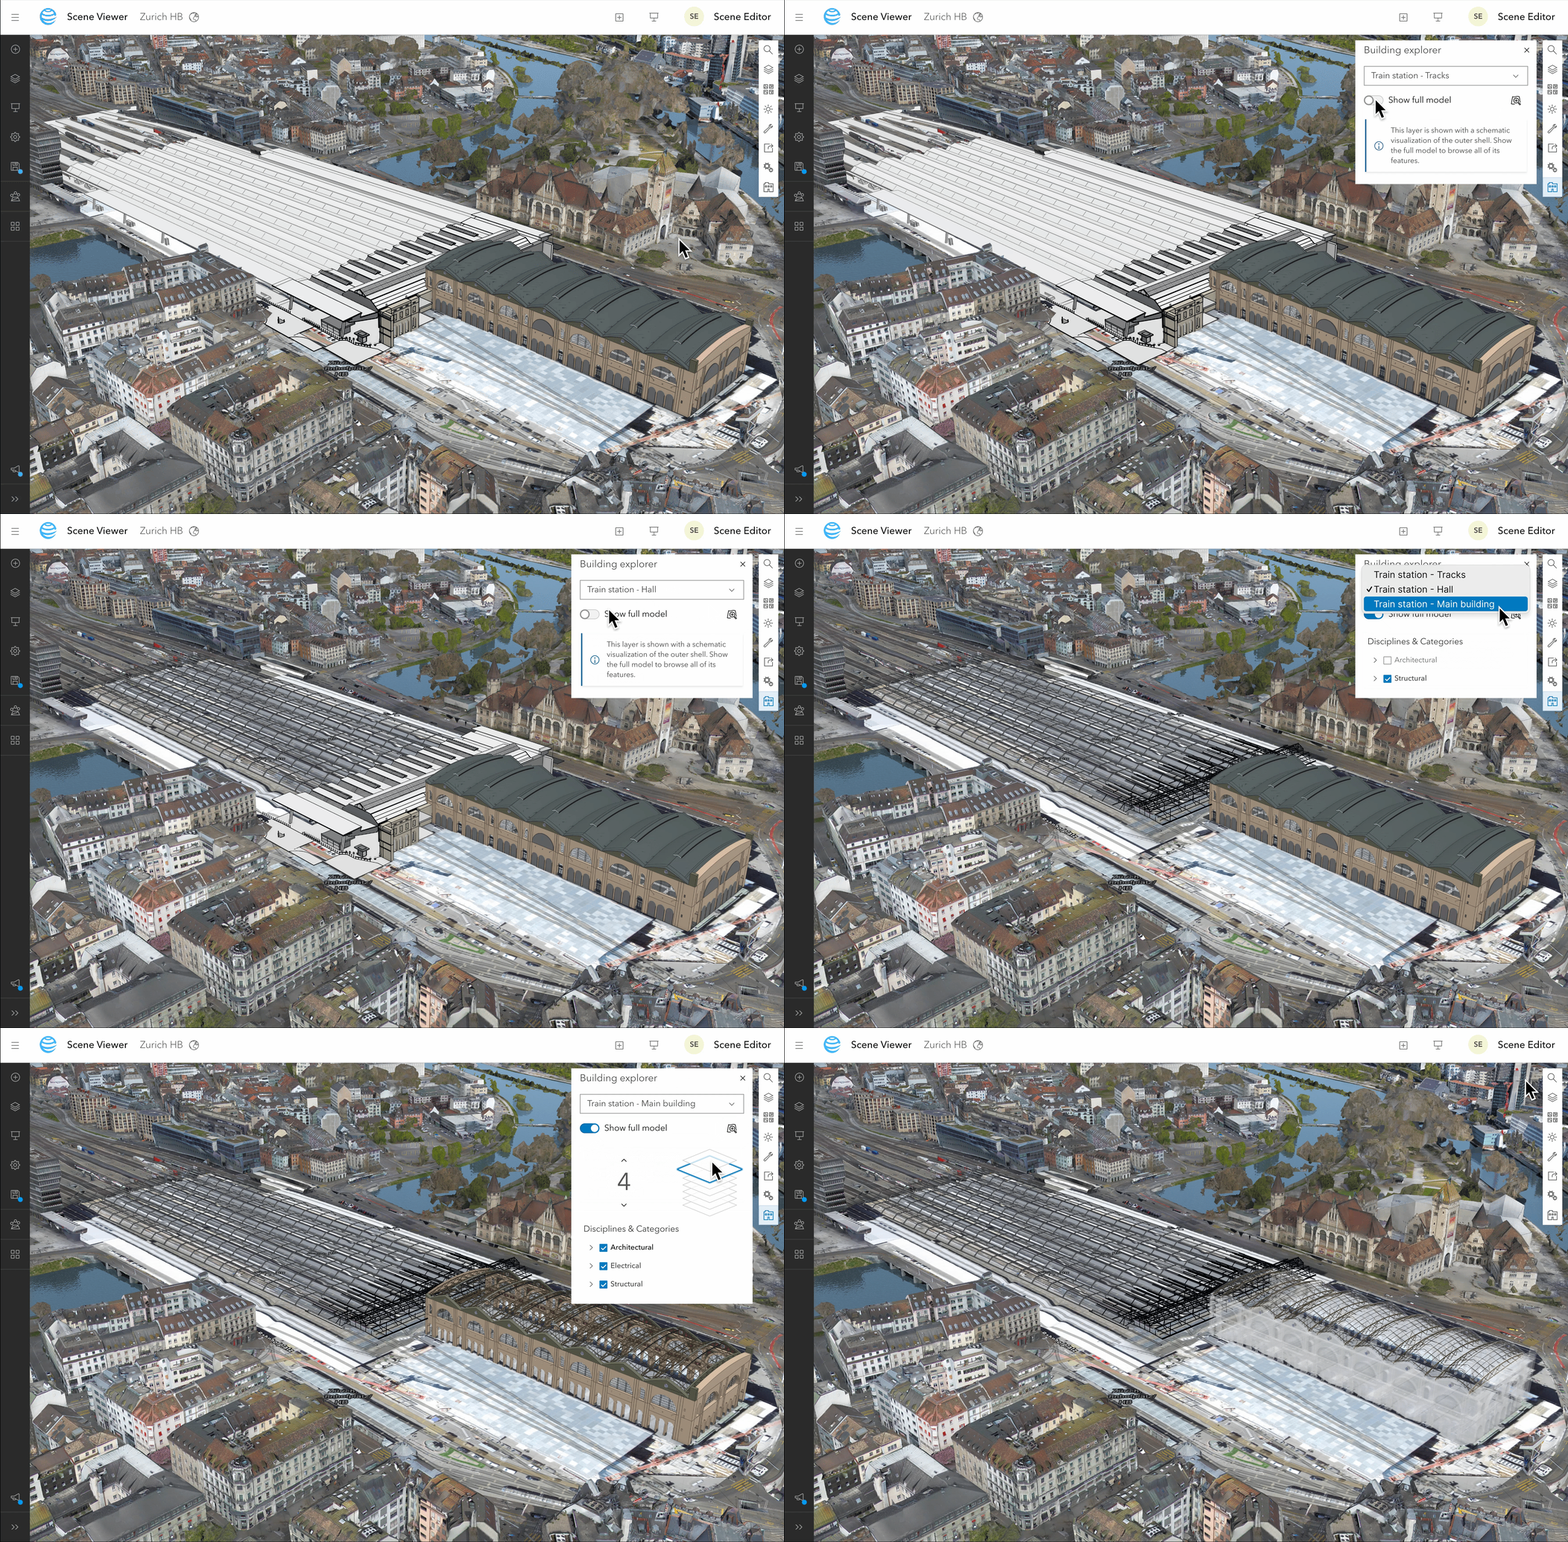
View multiple BIM models

Add Cover, Caption, and Legend in Presentation Mode

Scene Viewer’s updated presentation mode takes your presentations to the next level by letting you integrate rich, dynamic content. With new features such as the ability to capture legends, or adding slide descriptions as captions or cover, you can prepare your slides for an interactive and compelling 3D storytelling. Whether you’re showcasing a new urban design proposal or presenting analysis results, this enhancement helps you communicate your ideas more effectively.
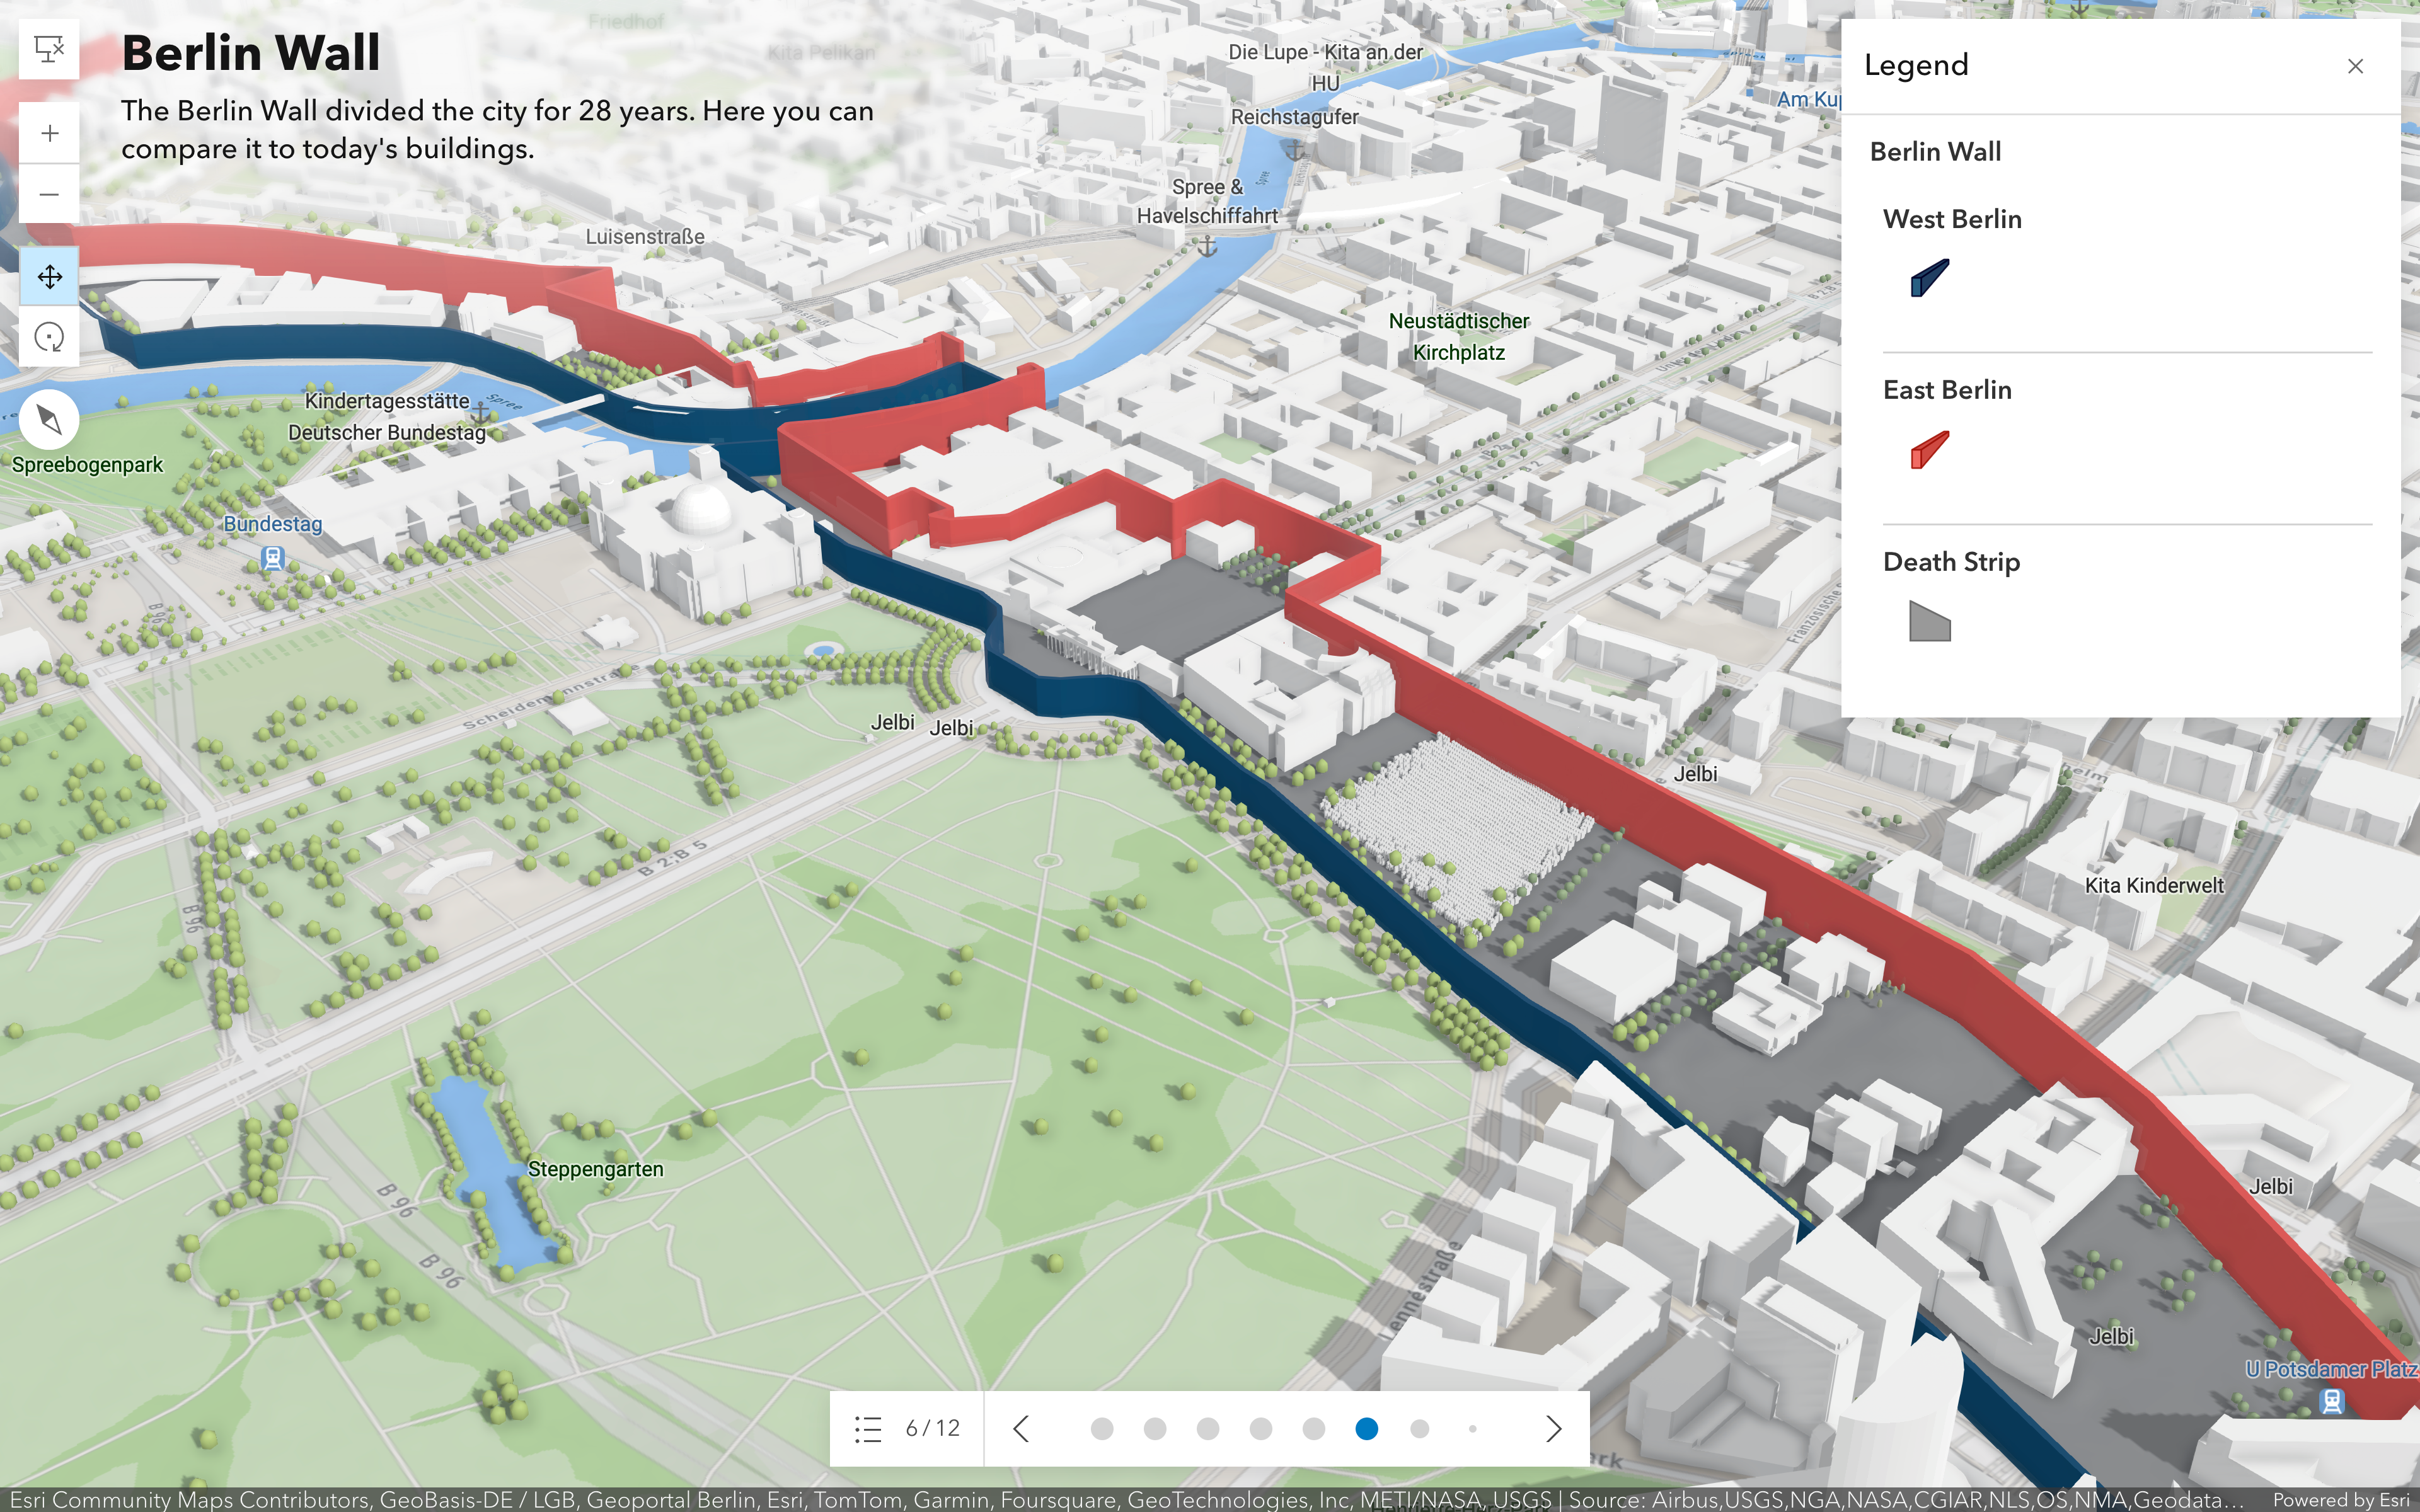
Explore the Berlin Wall's 28-year divide and compare it to today's cityscape in Scene Viewer.

New Mobile User Interface

We’ve also improved Scene Viewer’s mobile user interface to provide a more intuitive and streamlined experience. Now, you can easily navigate and access 3D content representing a small community to a massive city, even on a smaller screen. Explore the 3D Web Scene of Cantabria, Spain, featuring more than 51.9 billion LiDAR data points on your mobile device to experience the improvements.
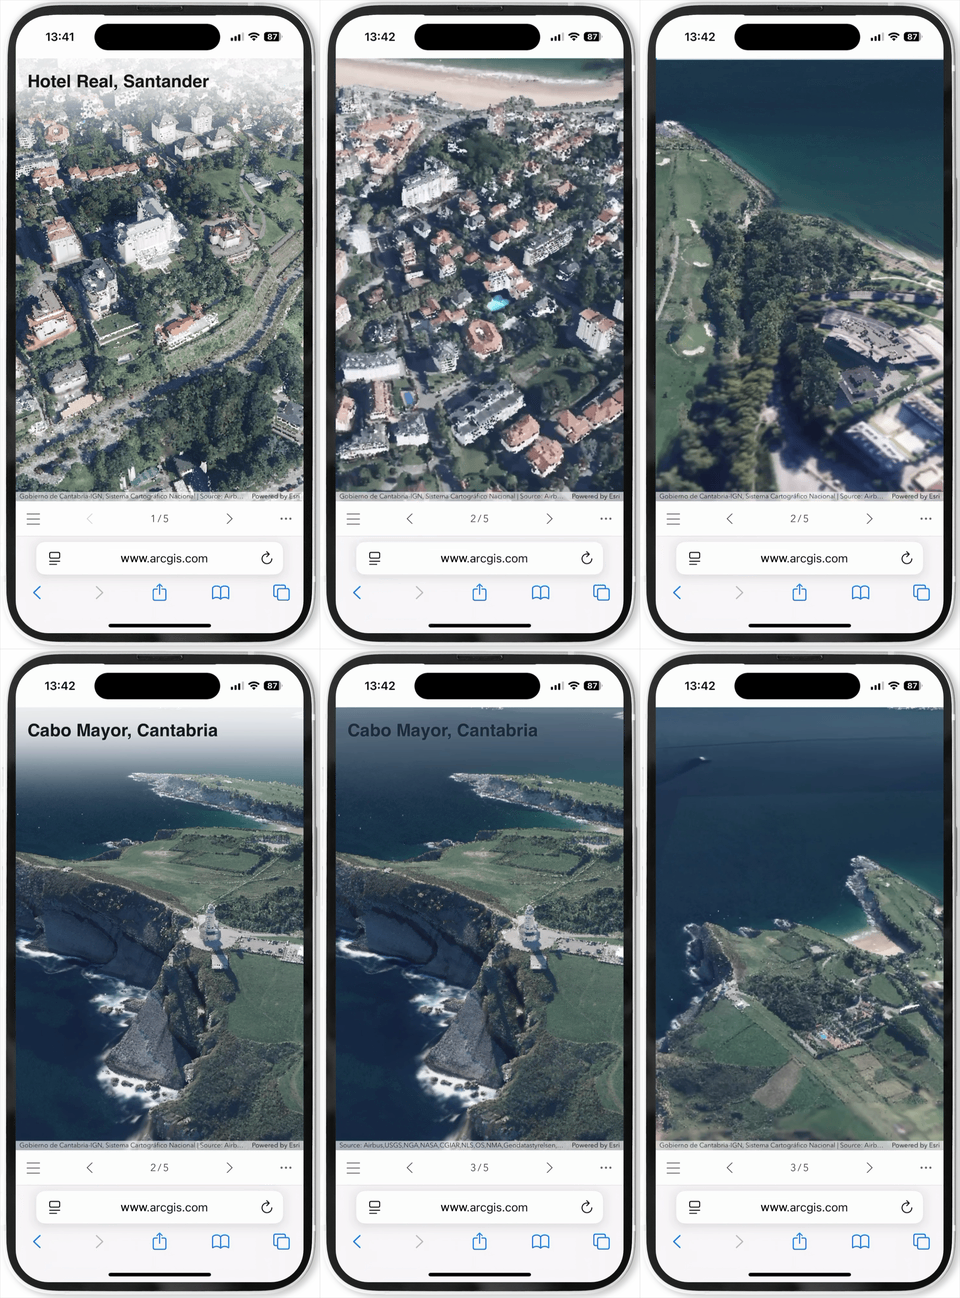
New mobile user interface

Support OGC Web Coverage Service (WCS) layer type

Esri’s open vision for advancing global geospatial interoperability is powerfully demonstrated by our expanded support for the OGC Web Coverage Service (WCS) layer type. The WCS standard enables seamless access to rich raster datasets—such as elevation values from digital elevation models (DEMs) or multispectral pixel values from satellite imagery—by delivering geospatial “coverages.” By integrating WCS support, we reinforces our commitment to open standards, ensuring users worldwide can connect effortlessly to the data they need.
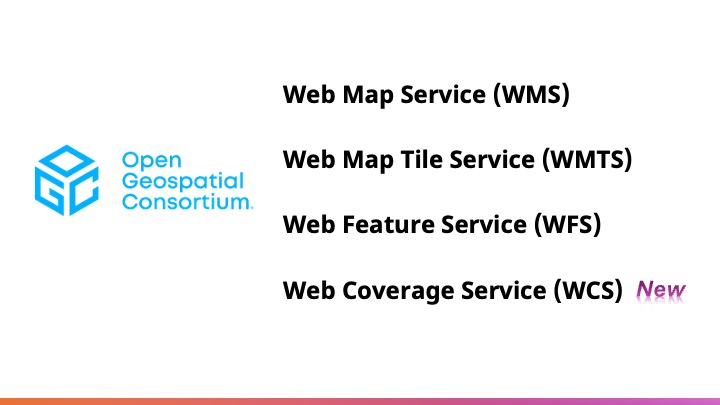
OGC Web Services supported in Scene Viewer

Duplicate Feature Layer and Scene Layer

The long-requested ability to duplicate Feature and Scene Layers in Scene Viewer is now here, making it easier to replicate work without starting from scratch. You can quickly create exact copies of layers, saving time and ensuring consistency across projects.
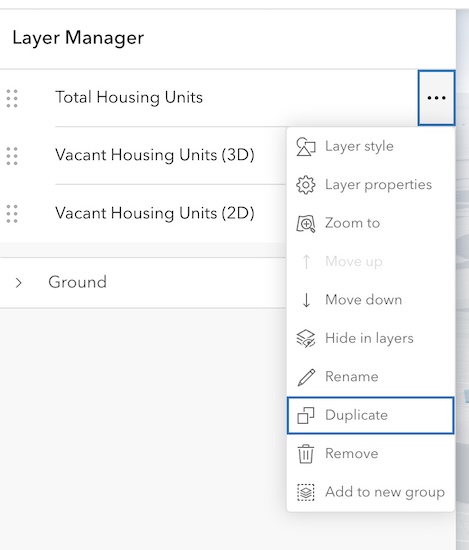
Duplicate Feature Layer and Scene Layer

Pop-up configurations for Voxel layer

Scene Viewer now supports Voxel layers pop-up configuration. When you click and highlight features in your scene, pop-ups display in-depth information about your features. In Layer Properties settings, you can configure pop-ups for point, line, polygon, 3D object and also Voxel layers. Customize the way pop-ups display so the important information stands out better.


Additional Editing tools

Another enhancement is the addition of a Drawing toolbar and shared templates in the Editor tool. The Editor now includes a draw toolbar in create workflows, making it easy to switch between different drawing tools when creating features. The new tools for polygons include freehand, rectangle, and circle, while freehand-polygon is available for polylines.

Drawing toolbar
Drawing toolbar

We’re excited to see how these new features and improvements will empower you to explore even more possibilities in 3D. Stay tuned for future updates and tutorials to help you get the most out of Scene Viewer!

Share this article

Subscribe
Notify of
6 Comments
Oldest
Newest
Inline Feedbacks
View all comments
Christopher Eby(@cebygeodecisions-com)
April 2, 2020 10:21 am

Will this data be coming to the Living Atlas any time soon?

David Coley(@dcoley_sarco-2)
April 2, 2020 11:00 am

Hi – the layer package for the data reads that it was created with Pro 2.6, which none of us have yet because it hasn’t been released? We’re all at 2.5

David Coley(@dcoley_sarco-2)
April 6, 2020 7:22 am
Reply to  Tanu Hoque

Will do thanks Tanu

Manoj Doss(@doss0044_umn)
April 3, 2020 6:44 pm

Hi Tanu

Great post. I’m not sure how you created the 3D map with total cases and exaggerated extrusions. Would you provide instructions? Thank you!

Manoj

Manoj Doss(@doss0044_umn)
April 6, 2020 2:52 pm
Reply to  Tanu Hoque

Tanu
I have the table joined and updated, but there is no attribute for total cases. The current field has cases for that particular day. When I try to make a 3D map is only extrudes based on the cases of the last date. Am I doing something wrong? I am able to make a chart because it give an option to aggregate values, but I see no option to do so in a map. Thank you

Manoj Doss(@doss0044_umn)
April 7, 2020 5:30 pm
Reply to  Tanu Hoque

Yes I did that. When you go from one day to the next it shows counties with cases that particular day. It doesn’t show the accumulation of cases for each county. The last day on the slider should be a thematic map with high concentrations in the expected area, but it only shows the case count for that day.

Brikkho Bangladesh(@brikkho)
April 6, 2020 1:06 pm

very helpful Tanu!
lovely work!

Andy Siegel(@andysiegel)
April 6, 2020 4:41 pm

How does this data differ from the Johns Hopkins University feature service? Are they compiling data from similar sources?

HRPDC Admin(@hrpdcgis-2-2-2-2-2)
April 15, 2020 10:07 am

I hope that you can help me understand the field mapping component of the Python script. I am trying to adapt to another CSV file but I don’t know what each part of the field mapping string represents (true, true, false, etc). I can sense what some of them are but I am not getting it right because my tables are coming over empty. It worked great with the NYT data but I would like to pull some other files as well. Thank you!

Chen, Peiming(@peimingciastate-edu_isugisf)
April 17, 2020 8:24 pm

Hi, when I join the data, the results from the county table are Null (Case, Date, etc). Do you know why?

Tia Lemon(@tialemon_nga)
April 21, 2020 10:47 am

~~~
arcpy.management.SelectLayerByAttribute(tableView, “NEW_SELECTION”, “county = ‘Unknown'”, None)
if int(arcpy.GetCount_management(tableView)[0]) > 0:
arcpy.management.DeleteRows(tableView)
~~~
I had to add this because I recieved the following:

~~~
2020-03-20,Unknown,Kentucky,,1,0
2020-03-20,Unknown,Louisiana,,5,0
2020-03-20,Unknown,Maine,,3,0
2020-03-20,Unknown,Massachusetts,,18,0
2020-03-20,Unknown,Missouri,,1,0
2020-03-20,Unknown,Nevada,,11,0
2020-03-20,Unknown,New Jersey,,3,0
2020-03-20,Unknown,Puerto Rico,,14,0
2020-03-20,Unknown,Rhode Island,,44,0
~~~

Tia Lemon(@tialemon_nga)
April 21, 2020 10:57 am

~~~
arcpy.management.SelectLayerByAttribute(tableView, “NEW_SELECTION”, “county = ‘Lac qui Parle’ And state = ‘Minnesota'”, None)
arcpy.management.CalculateField(tableView, “county”, “Lake of the Woods”, “PYTHON3″, ”)
~~~

Changed Lac qui Parle,Minnesota to Lake of the Woods,Minnesota to match feature class

~~~
OBJECTID 1 NAME Lake of the Woods STATE_NAME Minnesota

Line 8820: 2020-03-23,Lac qui Parle,Minnesota,27073,1,0
Line 10119: 2020-03-24,Lac qui Parle,Minnesota,27073,1,0
Line 11541: 2020-03-25,Lac qui Parle,Minnesota,27073,1,0
Line 13138: 2020-03-26,Lac qui Parle,Minnesota,27073,1,0
Line 14863: 2020-03-27,Lac qui Parle,Minnesota,27073,1,0
Line 16693: 2020-03-28,Lac qui Parle,Minnesota,27073,1,0
Line 18625: 2020-03-29,Lac qui Parle,Minnesota,27073,1,0
Line 20659: 2020-03-30,Lac qui Parle,Minnesota,27073,1,0
Line 22791: 2020-03-31,Lac qui Parle,Minnesota,27073,1,0

Todd McNeil(@runmd)
April 24, 2020 8:32 am

Section 2: Join time series table with county layer is a confusing section since you are joining multiple covid records to a single county. That a 1 to many relationship but a simple join doesn’t handle that. That’s a relate and as much as I’ve gone through, reread and applied a join, it still does not show multiple joined records when selecting a single county with the identify tool. Is there something I am doing wrong in Pro or is there something missing in Section 2?

Joy Christine Nduta Kimani(@kimani-joy)
April 26, 2020 6:23 am

@Tanu Hoque Hi, I’m having trouble running the code.
import arcpy
ModuleNotFoundError: No module named ‘arcpy’ this is the error from Python

Mohammed Dhanish(@dhanish)
July 5, 2020 3:47 am

some of fields shows after joining data
hiw to sort this error ? thank you.

Tim Keenan(@keenant7)
July 21, 2020 1:40 pm

Tanu,

Excellent tutorial. Can you tell me where/how you got the other data used in your map? It looks like your final map has 4 tables. Additionally, you have a rolling count field showing changes accumulated in the last several days. The NYTimes data does not include population, which will be necessary to symbolize the data appropriately.

Cheers.

Ricardo Marques(@halorhodospin)
October 21, 2020 1:20 pm

Hope you can help understand this section of the python code.
In the “outGDB=…” section, what exacly should I place here? I understant it is the path for an existing gdb file. However I’m failing to understant which gdb file, as, at this point, I have no gdb file in my folder.
Thanks in advance for your help.