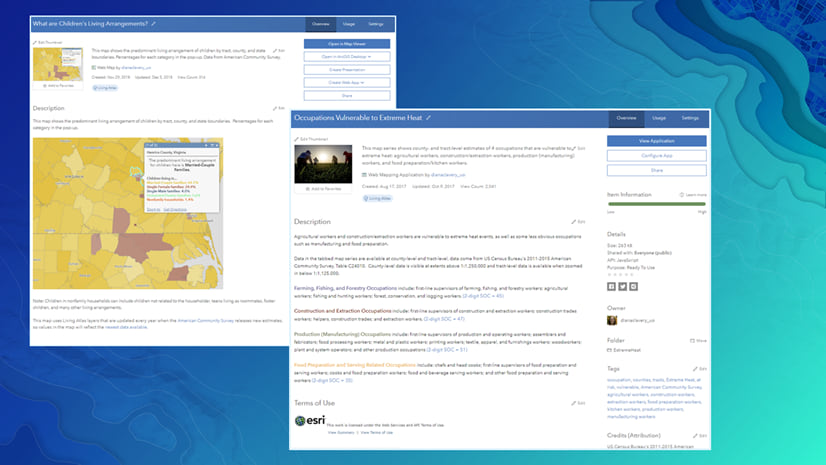
Have you ever wondered where that small source information that appears at the bottom of the Map Viewer comes from? It’s from the basemap, and the feature layers’ sources listed in the Credits (Attribution) section on its item page. Let’s take a closer look using this feature layer of monthly unemployment from ArcGIS Living Atlas. The Credits (Attribution) section lists “U.S. Bureau of Labor Statistics (BLS), Local Area Unemployment Statistics (LAUS)” as the source of the data behind this layer.
 shows up on the right side underneath Tags.")
This comes through in the Map Viewer
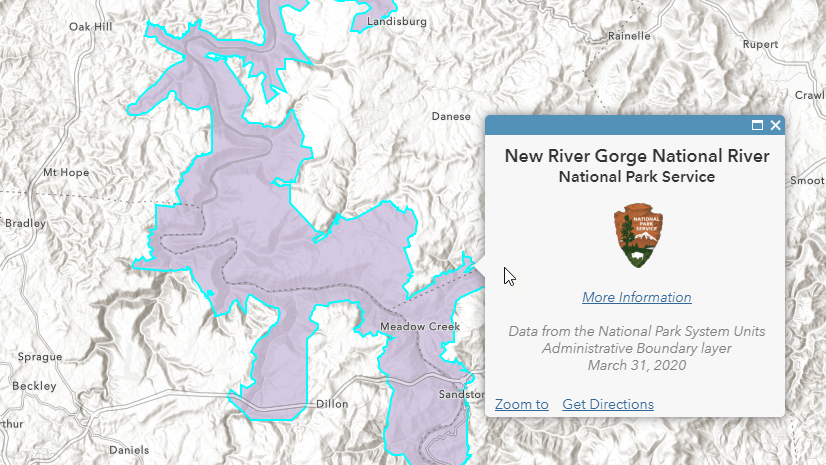
When viewing this layer in Map Viewer, it appears on top of the Topographic basemap as the default. The sources listed in the fine print at the bottom first come from the basemap, and then from the layer. Whenever the layer is within the map’s current extent, you will see the source listed in the Credits (Attribution) section. As we zoom in and out, and as we change the basemap, we will see different sources appear in the first part of that fine print. Pieces of the source are delimited with a | symbol, and the last part comes from the layers in the web map. In this case, “U.S. Bureau of Labor Statistics (BLS), Local Area Unemployment Statistics (LAUS)” shows up after the final | symbol.
With the default Topographic basemap, zoomed out to state level:
, Local Area Unemployment Statistics (LAUS)\"")
With the default Topographic basemap, zoomed into the Continental United States:
 Local Area Unemployment Statistics (LAUS)")
Notice the text for NRCan (Natural Resources Canada) goes away, since Canada is no longer in the extent.
Using basemaps thoughtfully
Also, notice how the labels for large cities are covered by the polygons in the feature layer with this basemap. Let’s change it to one that is more appropriate for thematic maps, such as Light Gray Canvas, or Human Geography. These basemaps create a “map sandwich” ensuring that labels and other details will appear on top of your map. You’ll notice the sources change slightly, but the last bit that comes from the layer remains the same.
With the Light Gray Canvas basemap:
 Local Area Unemployment Statistics (LAUS)")
City labels such as Phoenix, Dallas, and Atlanta are visible on top of our layer’s symbology, just as these neutral basemaps have been designed to do. Another basemap that does a nice job of putting labels on top is the Firefly Imagery Hybrid basemap. Let’s change to this basemap for a completely different look. The source in the fine print updates again.
With the Firefly Imagery Hybrid basemap:
 Local Area Unemployment Statistics (LAUS) | Esri, HERE, Garmin, FAO, NOAA, USGS, EPA")
The text about the unemployment data remains the same in all of these, since it’s coming directly from the source listed in the layer’s item page. As the layer’s owner, you can take the guesswork out of your data’s source and show your integrity as a scientist by filling this out.
Completely separate from analysis credits
We hear you. The phrase “Credits (Attribution)” can be confusing, especially when ArcGIS Online has this whole other construct of “credits” that ArcGIS Online administrators manage. Think of this one as credits at the end of your favorite movie, listing the people involved who deserve attribution. The hint that appears says “Acknowledge this item’s source.”
 section has blue text that reads \"Acknowledge this item's source.\"")
To link or not to link?
In our world of online linking, it can be desirable to make the source a link so that someone who comes across your layer can get back to the original source quickly. There’s no link formatting available in the Credits (Attribution) section, so if you’d like to do this, start your link with “https://” and it will create a live link within the Item Page. The full link will also appear in your map’s fine print, although it will not be clickable from there. Weigh these considerations when deciding to include the link back to the original source here, or in the item’s Description, which does have link formatting (display text vs. URL). The Description is also the best place for any scientific works cited, DOI (digital object identifiers), or other information that might not be desirable in the Map Viewer.
The layer’s source flows to web maps
Another benefit to including your data source on your feature layer is that it flows to all web maps that use this layer. Any web maps that use your layer will then have this source listed automatically, even if the creator is outside your organization. A web map’s source is visible in the same type of fine print that appears in the Map Viewer in Instant Apps, Dashboards, and stories.
It is possible for the web map (or other item) to list something else in the Credits (Attribution) section of the web map, app, or story. Map Viewer Classic respects the web map’s Credits info only, however, this will not affect the fine print at the bottom of the map in the New Map Viewer. The source information of the basemap and the layers used is what comes through in a web map’s source that’s displayed at the bottom in Map Viewer.
Wrap up
If you find yourself creating layers for your organization in ArcGIS Online, take the time to fill out that Credits (Attribution) section. It takes the guesswork out of the data’s source in all web maps containing this layer. Furthermore, it inspires trust in you as a professional GIS content creator.
Photo by Joshua Woroniecki on Unsplash


Article Discussion: