Many state and local government organizations have the need to develop foundational GIS data. Hosting and analyzing large volumes of imagery is vital to the creation of this data. At the UC 2021 plenary, Juhan Yoon and Kate Hess showed a demo that showed how the island nation of Grenada used ArcGIS Image for ArcGIS Online to develop GIS data from imagery provided by the Government of Grenada, supplied by the United Kingdom Government. This blog post shows how this was done using ArcGIS Image for ArcGIS Online.
Grenada shared their country-wide Lidar and high-resolution imagery with us, to develop data products that could be used for urban planning, economic development, emergency management and natural disaster planning. A landslide susceptibility map, for instance, could be used to gauge how infrastructure will be affected by landslides. The complete process involved hosting the imagery, creating GIS layers for the country using AI, and generating the susceptibility map using raster analytics. In this blog post, we’ll walk through each of the steps.
Step 1: Hosting the imagery in ArcGIS Online
Grenada shared with us the topographic Lidar and 60 gigabytes of high-resolution imagery for their whole country. The data was stored on local drives. ArcGIS Image for ArcGIS Online has made hosting and sharing imagery easier than ever. In a few clicks, we were able to upload our local data and create imagery layers in ArcGIS Online.

Imagery can be hosted as a static Tiled Imagery Layer for efficient viewing and optimal analysis performance, or as a Dynamic Imagery Layer that supports dynamic-mosaicking and on-the-fly server-side-processing. With its support for different raster types, ArcGIS Online makes it easy to ingest imagery that is specific to sensors and data providers.
For this scenario, we created a dynamic layer that enabled us to author processing templates with the imagery layers. Additionally, we created a tiled imagery layer for better performance with visualization and feature extraction (more on that below). In addition to the aerial imagery, the DTM data was also uploaded as a tiled imagery layer. This was used for landslide susceptibility analysis.

Step 2: Extracting features using AI models
Once the imagery layers were hosted in ArcGIS Online, we worked on creating foundational GIS layers by performing feature extraction on the imagery. Digitizing features for this landmass would be a tedious and longwinded task that would take days or months of manual labor. We turned to deep learning to automate, expedite and optimize this process.
ArcGIS Image for ArcGIS Online comes with a collection of raster analysis tools, which includes tools to perform deep learning. The Detect Objects Using Deep Learning and Classify Pixels using Deep Learning tools in ArcGIS Online were used to generate the GIS layers, with the tiled imagery layers being used as input data sources. Users can also train deep learning models using tools and APIs in ArcGIS. However, training your own models can be a challenging task given the amount of training data and compute resources required.

To ease the process, the Living Atlas provides access to a library of pretrained deep learning models that work seamlessly with ArcGIS. There is a large and growing collection of pre-trained models that you can use for extracting features from imagery and point clouds. This includes models that can be used for extracting building footprints and roads, classifying land cover, and detecting objects like swimming pools, cars, and solar panels from imagery.
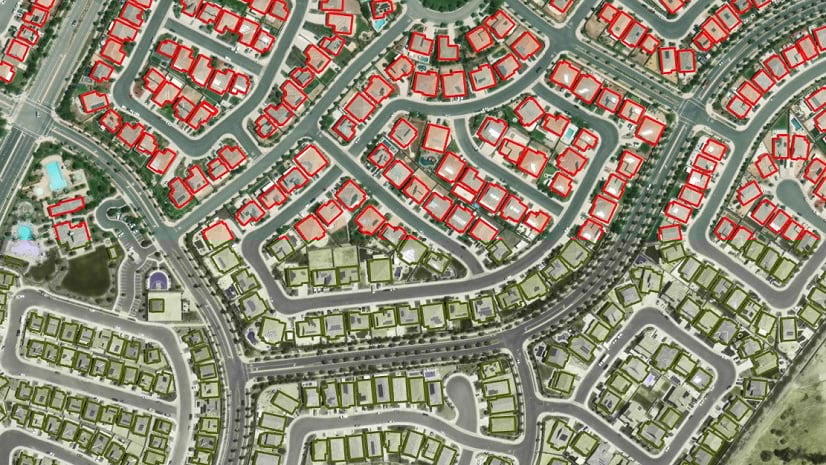
We used the pretrained models to extract building footprints and roads across the island, and a complete land cover classification layer.

Step 3: Creating the landslide susceptibility map
Grenada has rugged topography and faces frequent tropical storms. As a result, it regularly experiences landslides that can damage homes and businesses, disrupt transportation and even lead to injuries and death. To identify infrastructure that’s potentially at risk, we generated a landslide susceptibility map using raster analytics in ArcGIS Online.
For the analysis, we used the tiled imagery layers hosted in ArcGIS Online, as well as the land cover layer classified from imagery, the digital terrain model (DTM layer), the soil type, and the distance to river features. The landslide susceptibility layer was created using raster functions – all within the Map Viewer in ArcGIS Online.

The Map Viewer provides you with access to a function editor and over 150 raster functions out-of-the-box. These functions can be chained together to create new raster function templates for more complex operations such as the one to generate a landslide susceptibility map.

This processing chain takes in the 4 layers in the map and normalizes them to a common value range, and then it takes a weighted sum to identify areas susceptible to landslides. The processing chain can be previewed, and when deemed satisfactory, you have the option to create a persisted product.

The red areas indicate areas at high risk, and the areas least likely to see a landslide are dark green.
Bringing the landslide layer and the foundational GIS layers that were generated into a 3D scene, gets us a better understanding of what infrastructure may be at risk. In the following 3D scene, it is evident that the road that falls in an orange area would be impassible if there were any significant landslide above it on the hillside.

This is just the beginning of what we can do with hosted imagery layers and deep learning models in ArcGIS Image for ArcGIS Online. All of this was created in the cloud, so we didn’t need to set up any infrastructure to run the analysis.
Step 4: Creating a 3D Basemap
We used the 3D Basemaps solution with point cloud data to bring the buildings into 3D. The 3D Basemaps solution has recently been enhanced to leverage the pre-trained deep learning models for classifying and extracting trees. We also extracted utility poles and power lines from the point cloud data using the Power Line Classification model. The Classify Point Cloud Using Trained model tool in ArcGIS Pro was used to perform this feature extraction.

This helped us create a 3D basemap for the entire country. As a result, we have a building inventory for census planning, and an approach to natural disaster response that is data-driven. With these foundational GIS layers and the 3D basemap of the country, urban development can now be more intentionally planned and sustainable.
Resources to get you started
Introducing pretrained deep learning models


Article Discussion: