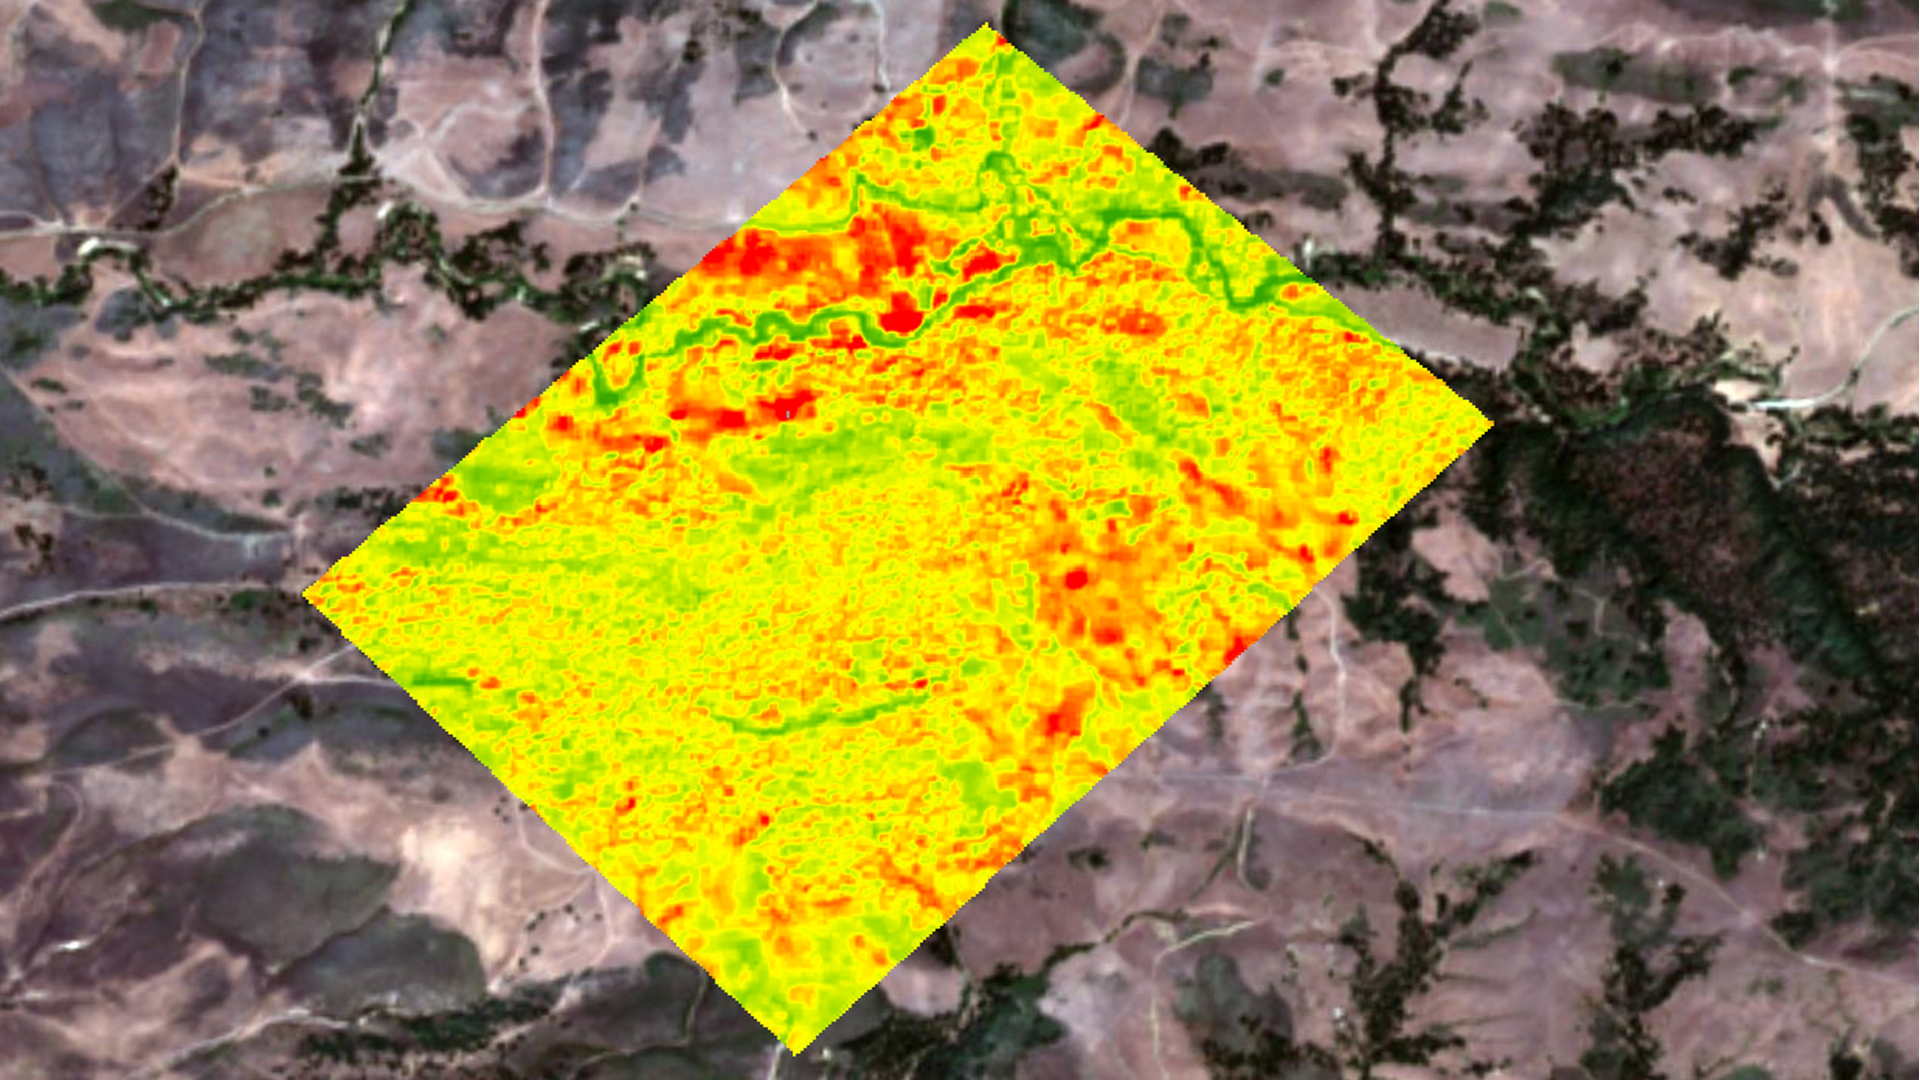
Living Atlas imagery layers provide a rich collection of multispectral imagery that can be used to create cloud-free composites, monitor vegetation conditions, and analyze environmental change over time. By combining multitemporal imagery with raster analytics in ArcGIS Online, you can move beyond simple visualization and generate meaningful insights about vegetation health, productivity, and ecosystem dynamics.
One of the most widely used measurements of vegetation condition in remote sensing is the Enhanced Vegetation Index (EVI). EVI is a vegetation index designed to quantify the density and vigor of green vegetation while minimizing the effects of atmospheric conditions and soil background influence. Unlike NDVI, which can become saturated in areas of dense vegetation, EVI maintains sensitivity in regions with high biomass, making it especially valuable for monitoring forests, wetlands, and intensive agricultural systems.
Typical EVI values range from -1 to 1, with healthy and actively growing vegetation commonly falling between 0.2 and 0.8. Higher values generally indicate dense, healthy vegetation with strong photosynthetic activity, while lower values may suggest sparse vegetation, stressed crops, bare soil, or non-vegetated surfaces.
EVI is commonly used for:
- Monitoring crop health and agricultural productivity
- Assessing forest canopy condition and biomass
- Detecting vegetation stress caused by drought, disease, or environmental disturbances
- Tracking seasonal vegetation cycles
- Supporting ecosystem and climate change studies through long-term trend analysis
ArcGIS Online makes it possible to calculate and visualize EVI across time using multidimensional imagery layers. These layers allow you to analyze the same geographic area through hundreds of image acquisitions, revealing how vegetation conditions evolve from season to season or year to year. Multidimensional imagery layers contains raster data representing multiple time periods, depths, or heights for a specific geographic area.
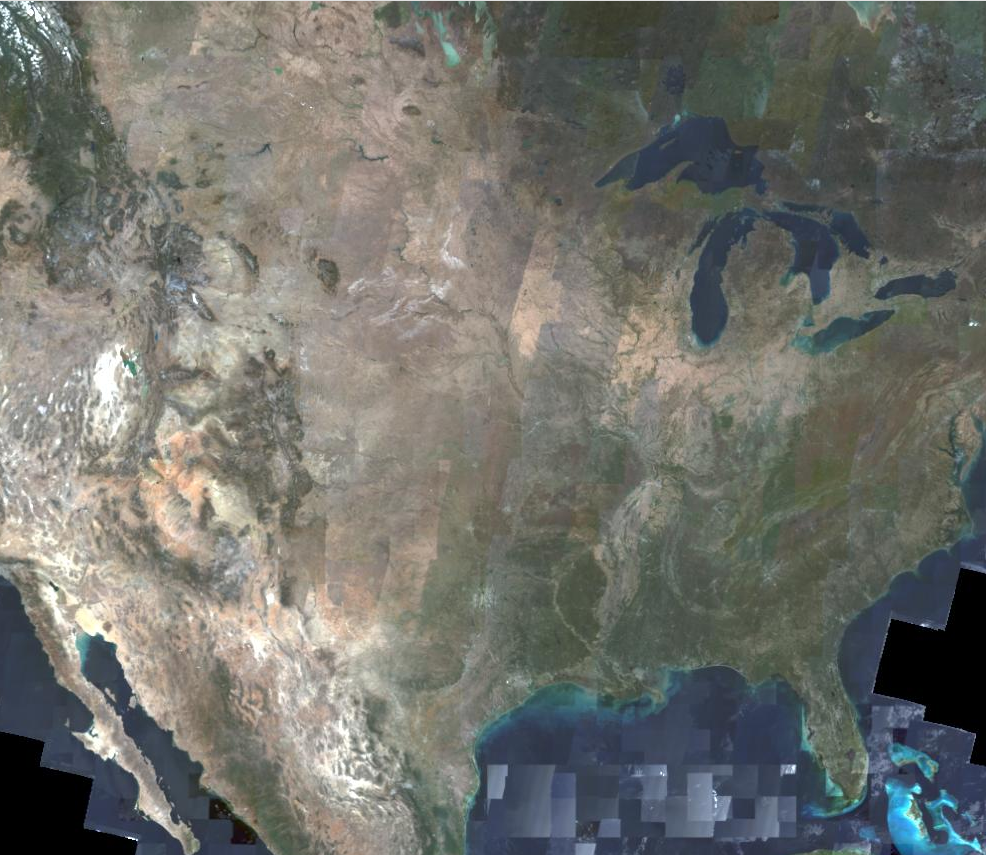
The Sentinel-2 Level-2A imagery layer in ArcGIS Living Atlas is particularly well suited for this analysis. The layer contains globally available, analysis-ready satellite imagery dating back to 2015 and is continuously updated with new acquisitions. With its relatively high spatial resolution and multispectral bands, Sentinel-2 provides an excellent foundation for generating cloud-free composites and vegetation health products such as EVI.
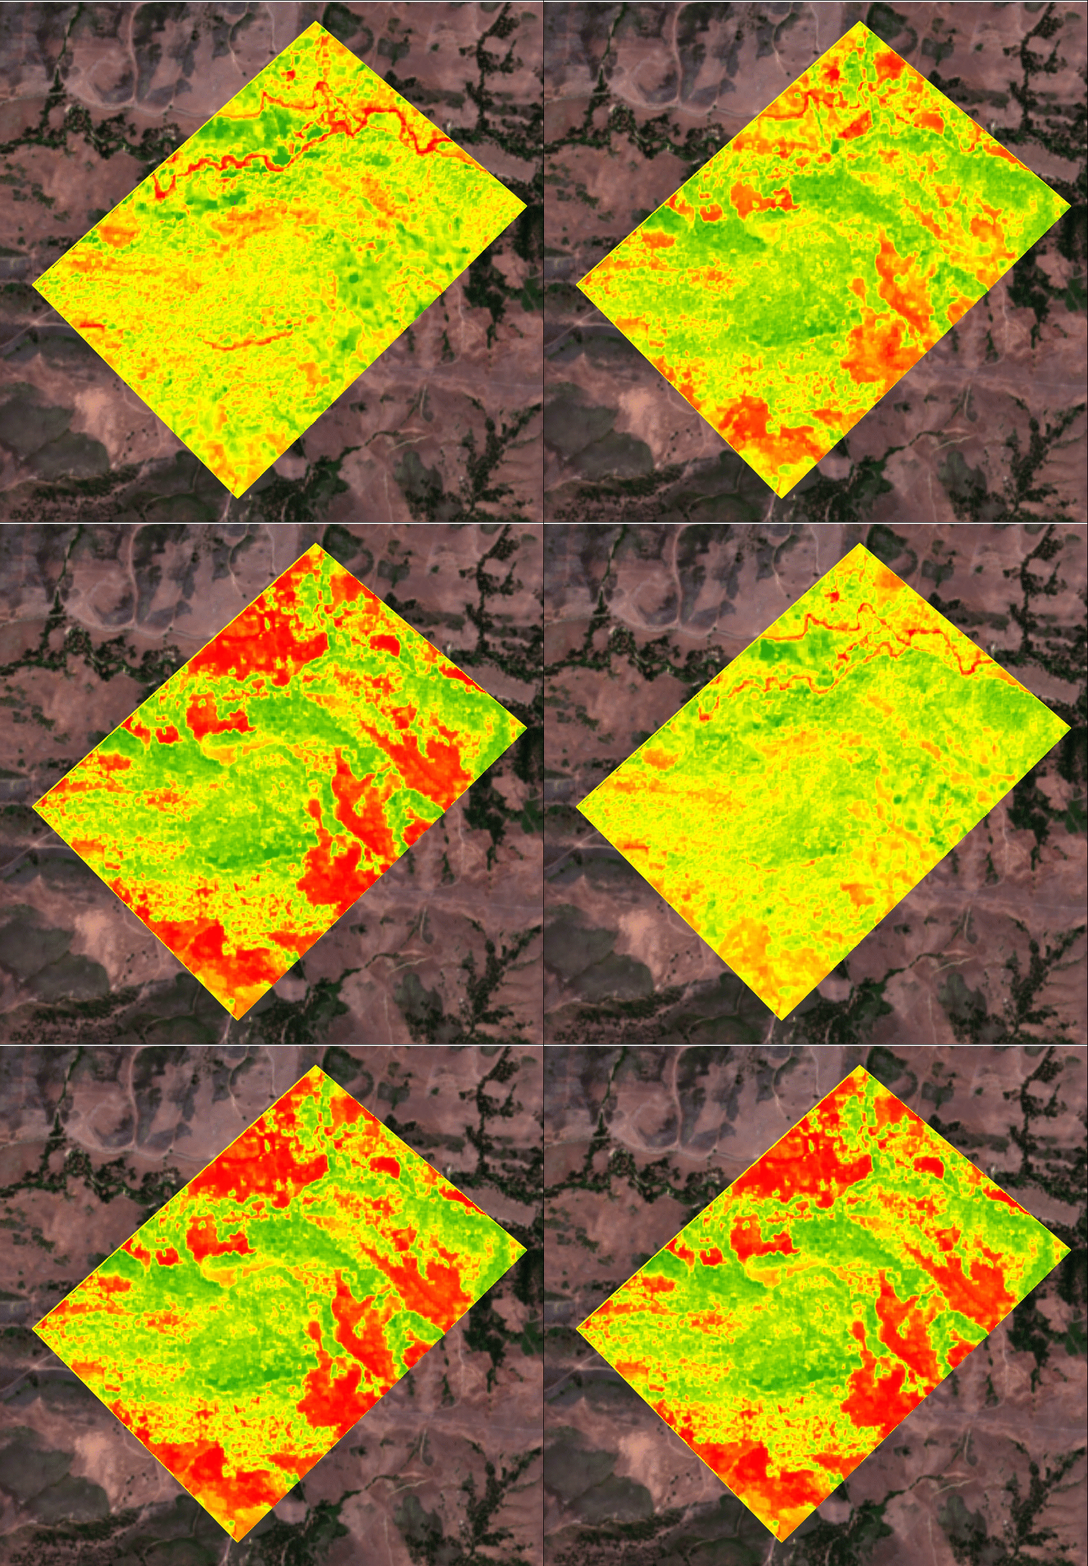
In this blog, you’ll use the Sentinel-2 Level-2A imagery layer from ArcGIS Living Atlas together with a raster function template to create monthly cloud-free EVI composites for a study area through spring and summer 2023. The resulting multidimensional imagery layer will allow you to visualize seasonal vegetation patterns, identify periods of peak growth, and explore how vegetation health changes over time.
Key steps:
- Remove the Default Processing Template
- Apply the Raster Function Template
- Visualize Vegetation Health
- Explore Change Through Time
Completion:
One hour to complete and one credit used.
Data used:
- Sentinel-2 Level-2A Imagery Layer (Living Atlas)
Provides multispectral imagery used to create cloud-free composites and calculate EVI. - PreserveAOI Feature Layer
Defines the study area and limits processing to the area of interest. - Sentinel2-L2A Create Cloud-Free EVI Composite Raster Function Template
Automates cloud filtering, image compositing, and EVI generation into a single repeatable workflow.
Together, these resources streamline the process of producing a time-enabled vegetation health dataset that can be visualized, analyzed, and shared across your organization.
Steps
- Open a browser, and sign in with privileges to create, update, and delete content; publish hosted feature layers; and perform spatial analysis.
- Open a new web map by clicking the Map tab in the ribbon.
- In the Layers pane, click Add, and from the My content drop-down, select Living Atlas.
- In the Search window, type Sentinel 2a, and click Add to add the Sentinel-2 Level-2A to the map.
The imagery will be added to the map and will appear using the Natural color with DRA processing template by default. Each imagery layer has a default visualization that can be adjusted once it has been added to the map.
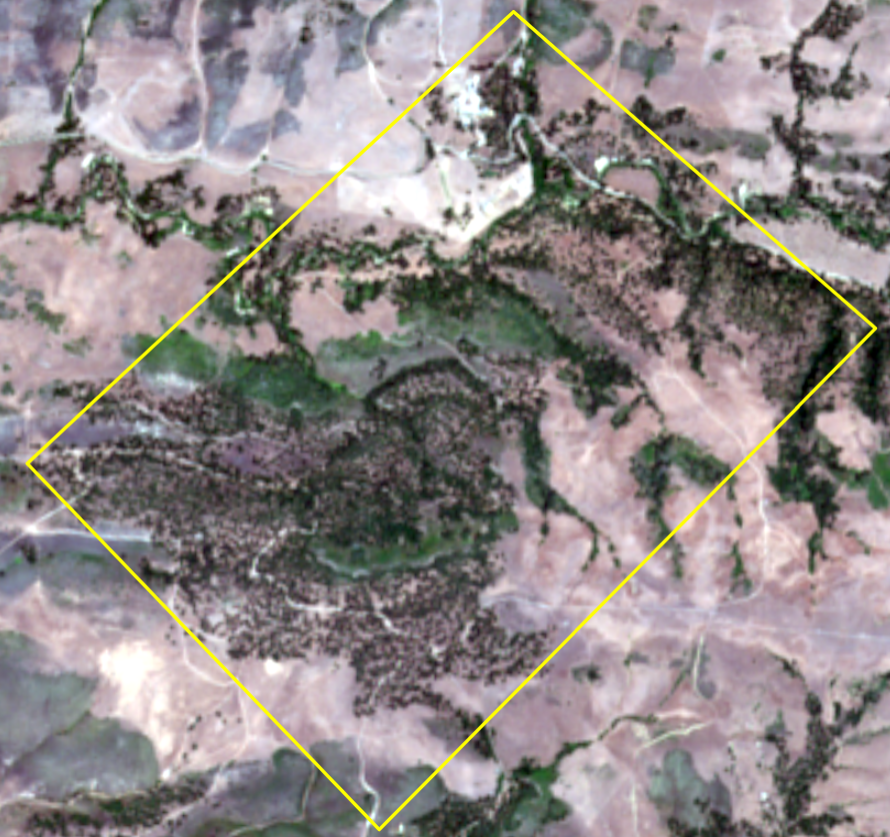
- From the Add layer pane, change the drop-down to ArcGIS Online and type preserveAOI owner:Imagery_Development_Team and click Add for this layer.
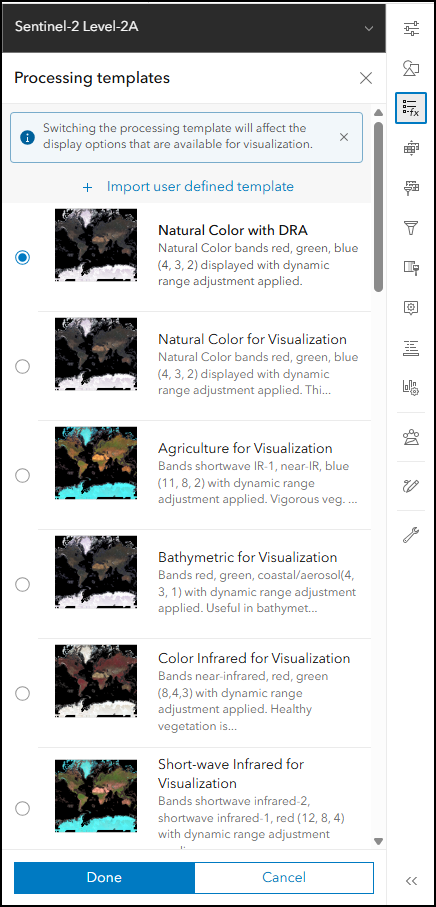
- With the Sentinel-2 Level-2A layer selected in the Layers pane, click the Processing Templates button on the right side of the map.
Remove the Default Processing Template
The Sentinel-2 Level-2A imagery layer is added to the map using the Natural Color with DRA processing template. While this template provides an excellent visualization experience, it limits access to the full set of source bands required for EVI calculation.
By removing the processing template, raster analysis tools gain direct access to the underlying multispectral imagery, allowing the raster function template to perform the required band operations and generate accurate EVI values.
- From the available options, scroll to the bottom and select the None option to remove the processing template and click Done.

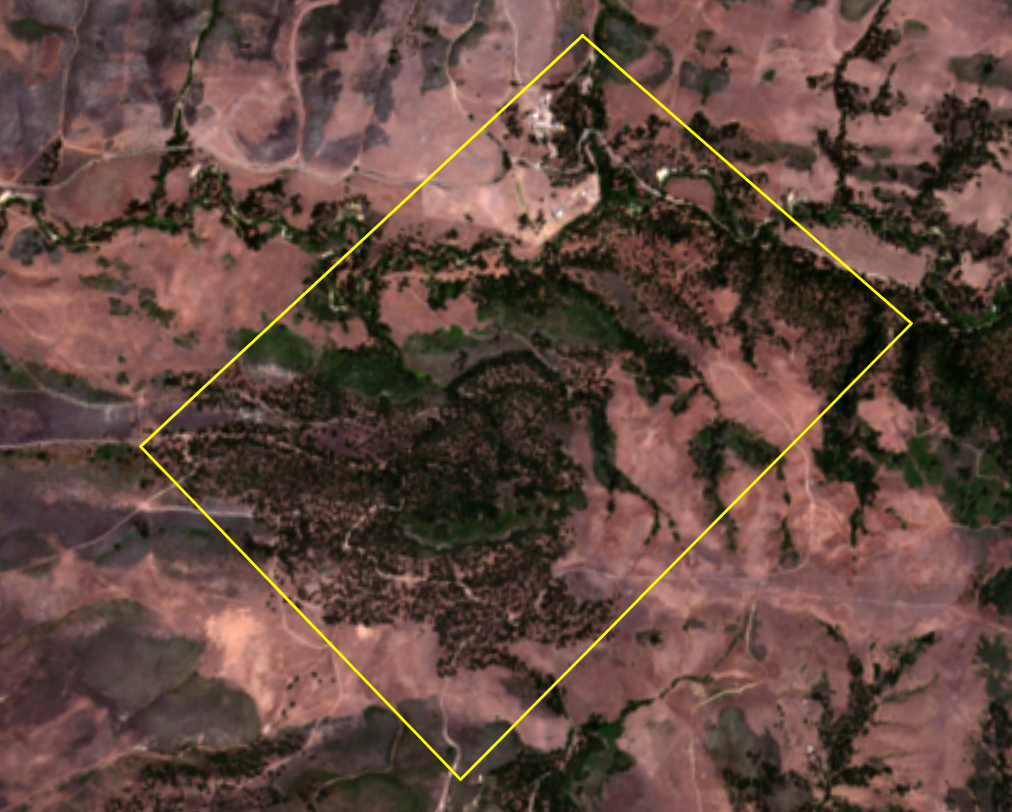
Initially, the imagery may appear gray after removing the template. This is expected and simply indicates that the visualization settings need to be updated. Once the layer styling is restored, the imagery will display normally while continuing to expose all available bands for analysis.
- Click the Styles button on the right side of the map to open the style options, select Style options under RGB confirm that the Stretch type is set to Percent clip, Apply dynamic range adjustment is turned on, and click Done. Click Done again to minimize the Style pane.
The visualization of the imagery layer will return to the Natural color visualization. Now that you have removed the original processing template to create a cloud free multidimensional EVI imagery for 2023.
Apply the Raster Function Template
The Sentinel2-L2A Create Cloud-Free EVI Composite raster function template combines multiple raster functions into a single workflow that performs two critical processing tasks:
- Maps the Sentinel-2 imagery to calculate EVI and identify cloud-free observations.
- Reduces the mapped observations into a cloud-free monthly EVI composite.
This approach eliminates the need to manually filter imagery while automating cloud masking, vegetation-index calculations, and the organization of individual outputs. The resulting imagery layer is both analysis-ready and multidimensional, enabling efficient time-series investigations.
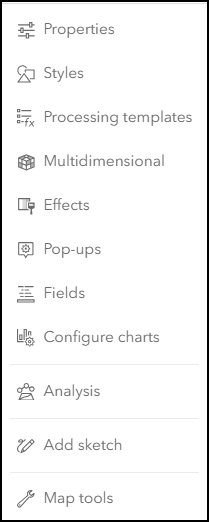
- On the right side of the map, click the Analysis button to open the Analysis tools, select the Raster Function Templates button to look for raster function templates.
- Click the Browse button on the right side, change the drop-down to ArcGIS Online, type cloud free owner:Imagery_development_team in the Search window, select the Sentinel2-L2A Create Cloudfree EVI Composite raster function template from the list, and click Confirm.
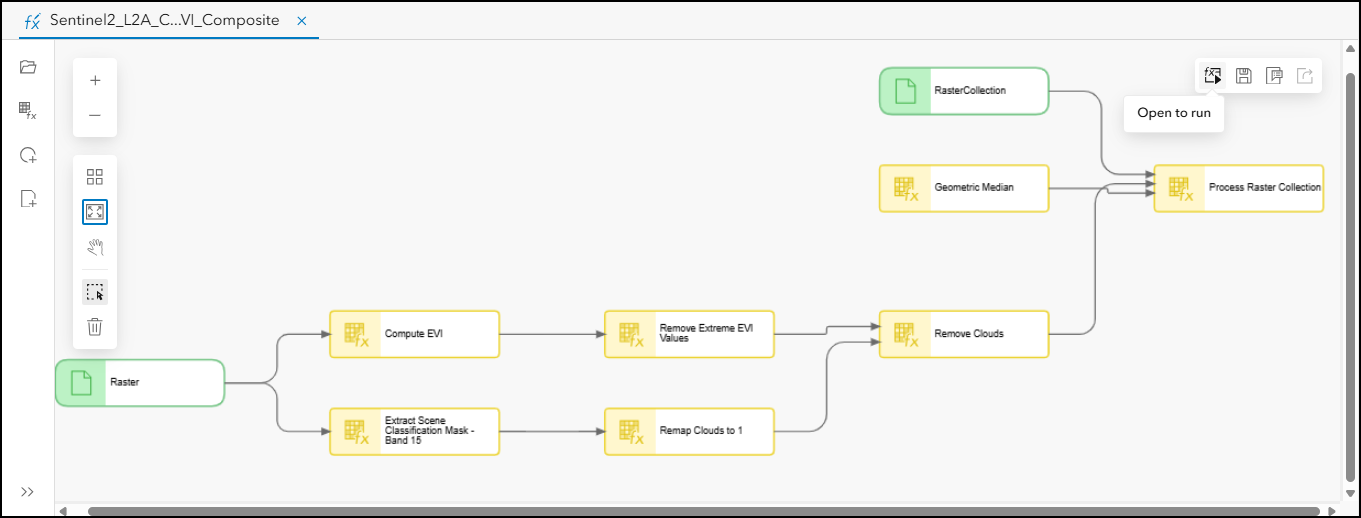
Review the raster function template to see how the different raster functions are combined to create the cloud free composite and then the band combinations are used to create the EVI visualization. You can click on any of the raster functions to see the parameters set and see what choices have been made.
- Once you are done reviewing the raster function template, click the Open to run button to open the raster function like a raster tool and close the Raster function template editor.
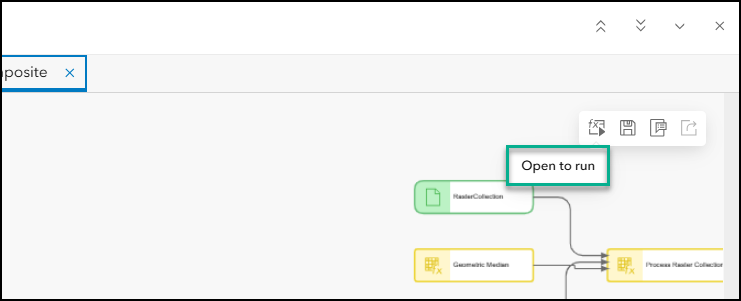
- Enter the following parameters in the raster function template:
- Raster : Sentinel-2 Level-2A
- Dimension : acquisitiondate
- Type : Internal Keyword
- Unit : Monthly
- Where clause: year = 2023 AND cloudcover <= 60 AND month BETWEEN 3 AND 6
- Query Geometry : PreserveAOI
- Use input features for clipping geometry : Enabled
- Output name : EVI Monthly values for 2023
Note about the filter clause:
You can type in the clause or copy and paste it in the field.
This filter limits processing to imagery acquired during the spring and summer seasons while excluding scenes with excessive cloud cover. Although the raster function will create cloud-free composites, restricting the search criteria can help reduce processing costs and improve the overall quality of the resulting imagery.
Depending on your study area, you may want to adjust the date range to target different growing seasons, drought periods, or years of interest.
- Once you are done entering the parameters, click Estimate credits.
It is a good practice to click Estimate credits to confirm how much your processing will cost in credits. For this analysis it will be 1 credit.
- Confirm that the estimate is 1 credit. If it is not, then confirm that the clipping geometry and filter are set correctly. If both are set, then open the Environment settings and confirm that the Processing extent is set to Layer > PreserveAOI.
- Click Run to create the new imagery layer.
Note: Depending on your connection, the processing time should be under five minutes.
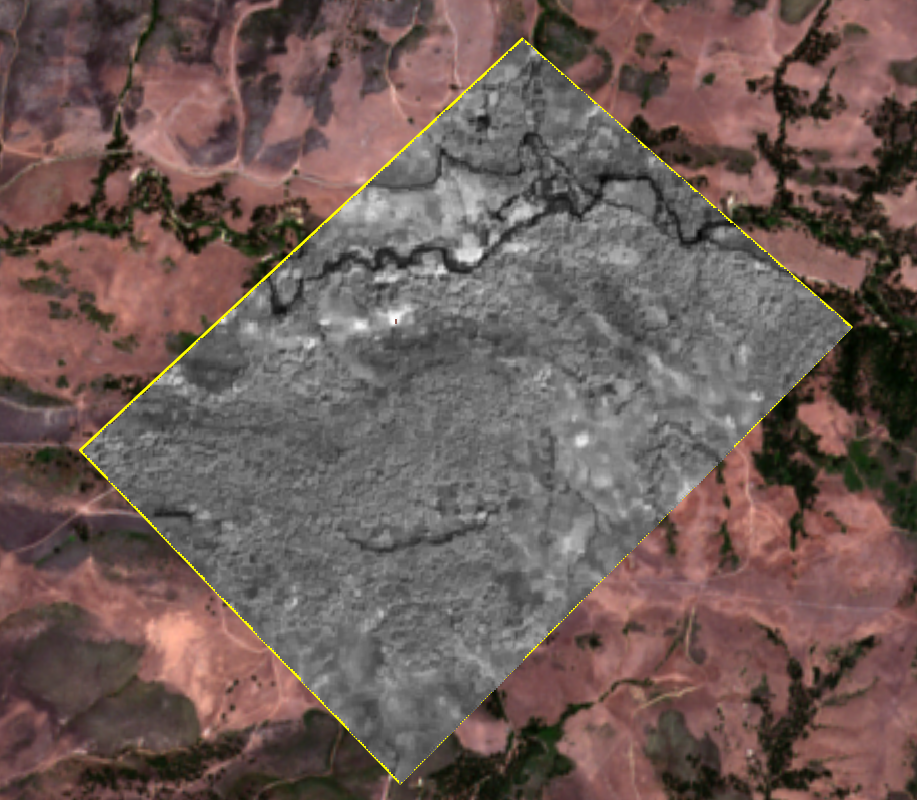
Visualizing Vegetation Health
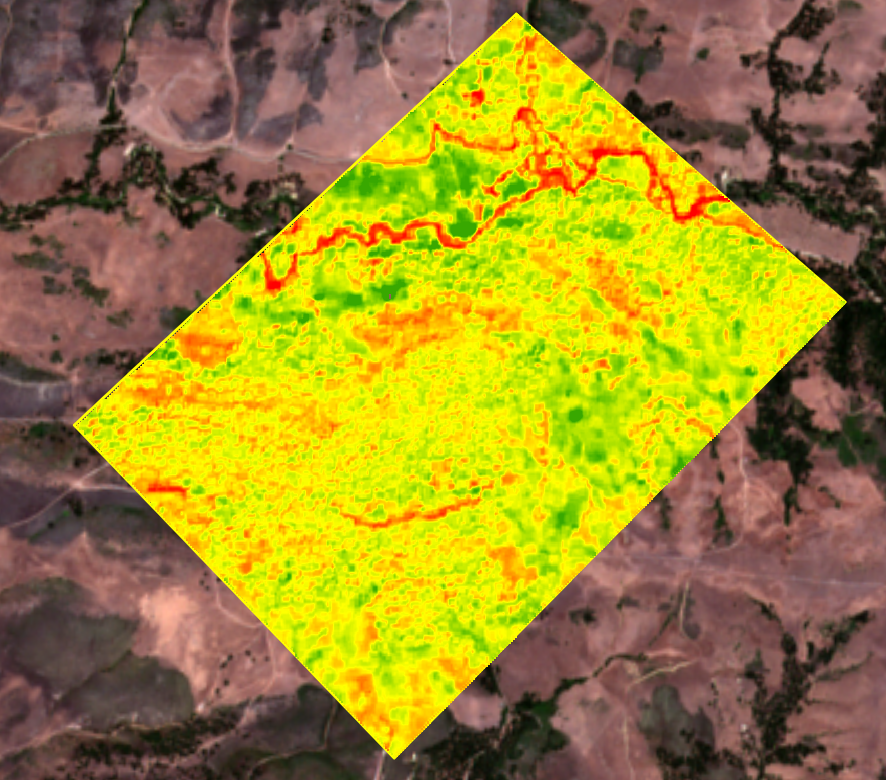
After the new imagery layer is created, the EVI values can be styled using a color ramp to highlight spatial differences in vegetation health.
Areas with higher EVI values typically represent dense, vigorous vegetation, while lower values may indicate sparse vegetation, exposed soil, or areas experiencing environmental stress.
The resulting visualization provides an intuitive way to identify patterns that may not be visible in natural color imagery alone.
- In the Layers pane, select the new imagery layer and on the right side of the map, click Styles button.
- Click the Style options for Stretch, and modify the following parameters:
- Stretch type : Percent clip
- Color scheme : Slope and Flip ramp colors
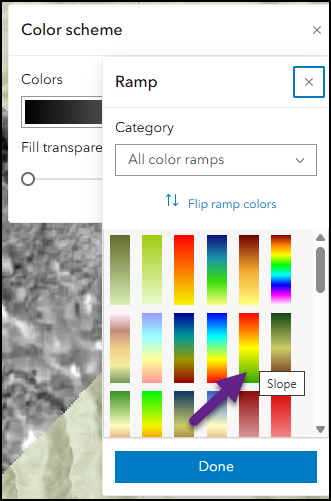
- Click Done and Done.
Explore Change Through Time
One of the most powerful capabilities of multidimensional imagery layers is their ability to visualize change through time.
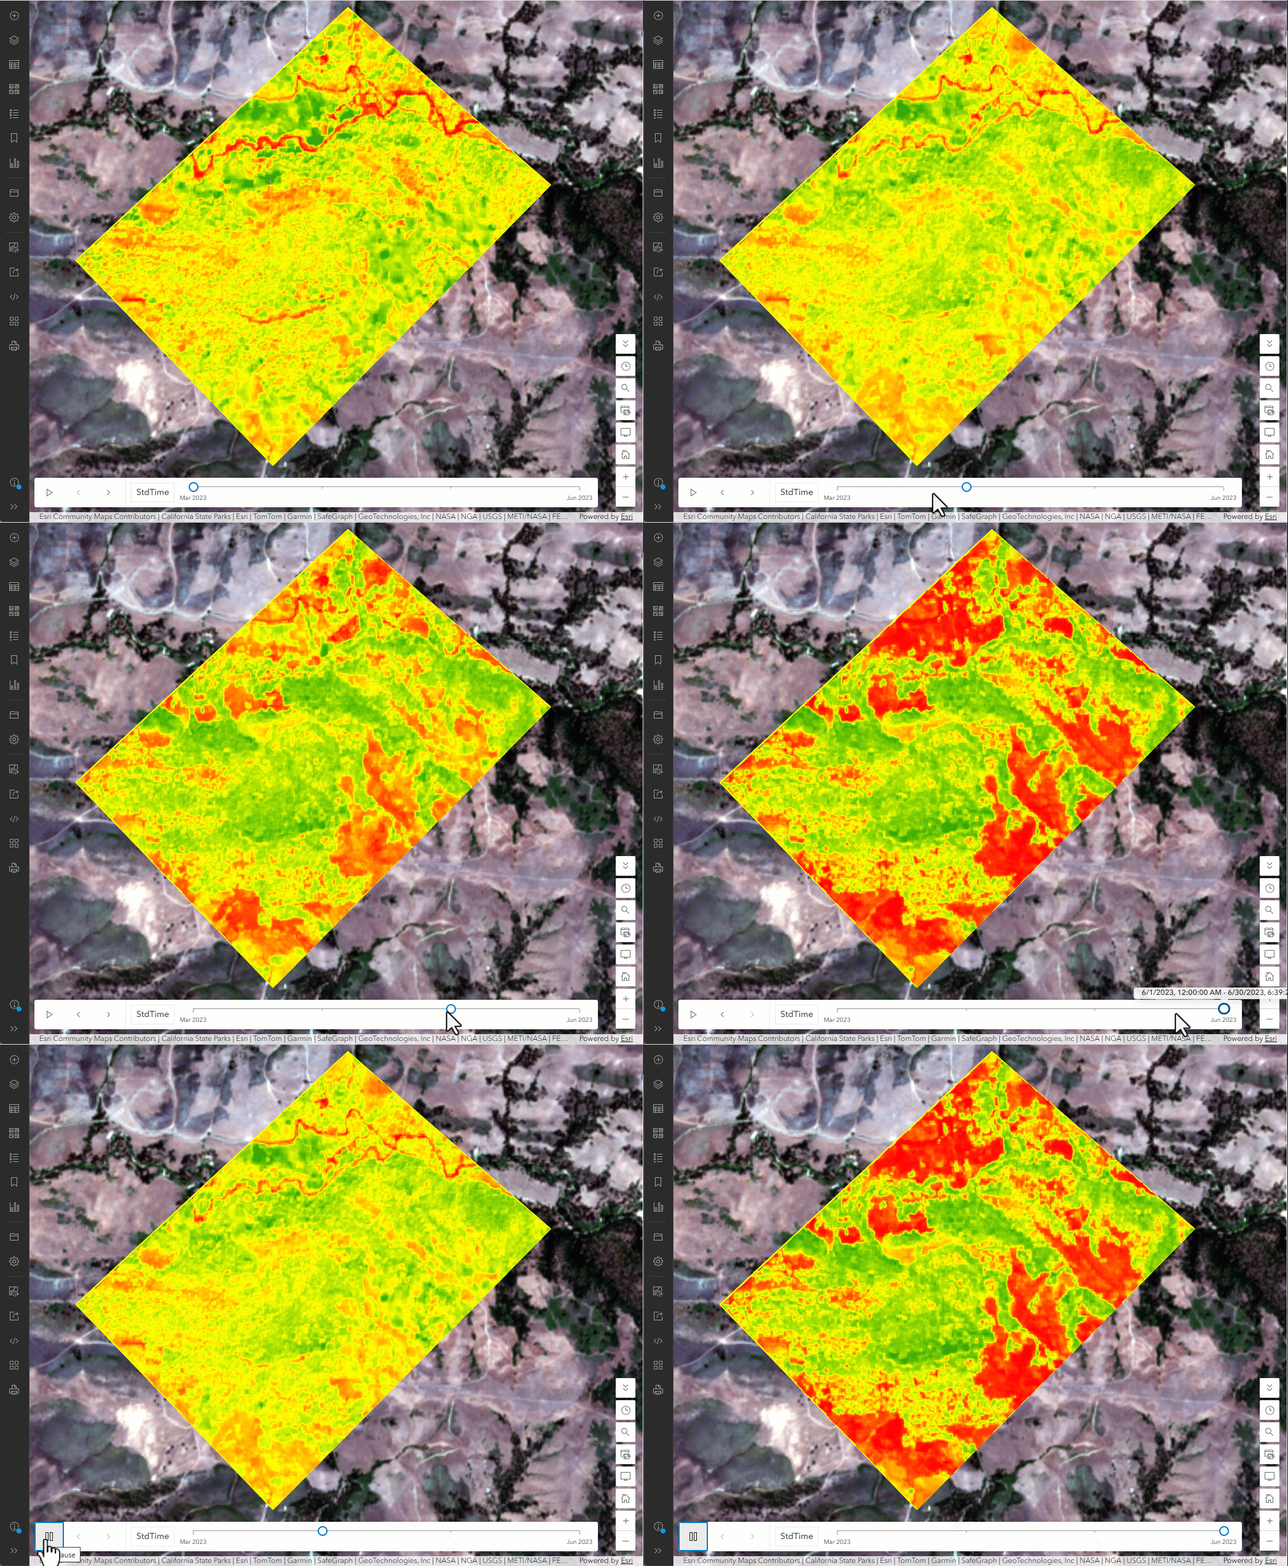
Using the Dimension Slider, you can step through each monthly EVI composite and observe how vegetation conditions evolve throughout the year. Areas of rapid green-up, seasonal growth, disturbance, and recovery become immediately apparent when animated across time.
This temporal perspective transforms a collection of individual images into a dynamic environmental record, allowing analysts to better understand vegetation trends and changing landscape conditions.
- In the Layers pane, select the new imagery layer and click on the Multidimensional settings button to see the Dimension slider.
The multidimensional imagery layer displays one slice at a time, which you can choose from the drop-down in the multidimensional settings or by using the Dimension slider.
- Click the play button on the Dimension slider to animate the imagery layer.
- Once you are finished, be sure to save the webmap to remember the processing steps for further analysis. Click Save and Open button and type in a name for the web map and save in the desired folder location.
The imagery layer visualization will shift between the different dimension values showing the different time periods, in this case each month. You can select any of the time slices within the dimension values and also animate the imagery to shift between each slice in succession. The values in the mulitdimensional imagery layer can be used for raster analysis and additional visualizations and different time slices can be accessed for analysis with the Multidimensional filter raster function.
Recap
Now that you have created the multidimensional imagery layer, you can use this imagery layer in further analysis, add it to other maps in other applications like ArcGIS Pro or ArcGIS Dashboards or ArcGIS Storymaps. Imagery layers in ArcGIS Online can be the final results to be displayed in various forms, or used in further analysis to quantify the values or perhaps select a range of values to focus on them. There are a world of possibilities for you to continue your research. I would encourage you to consider where else you can take this workflow.
In this workflow, you used a raster function template to generate cloud-free monthly EVI composites from the Sentinel-2 Level-2A imagery layer in ArcGIS Living Atlas. The resulting multidimensional imagery layer provides a powerful way to visualize and analyze vegetation health through time without the need for complex preprocessing workflows.
Because the workflow is driven by a reusable raster function template, it can easily be adapted to new study areas, time periods, and monitoring objectives. Whether you’re assessing crop productivity, monitoring forest health, tracking seasonal vegetation cycles, or supporting environmental research, this approach provides a scalable and efficient way to extract vegetation insights from satellite imagery.
We encourage you to adapt the workflow to your own area of interest and share your results and experiences in the comments. We’re excited to see how you’re using ArcGIS Online and Living Atlas imagery to better understand our changing landscapes.



Article Discussion: