In the June 2026 release, ArcGIS Online introduced Parquet feature layer (Beta), and we are excited to support them in Map Viewer. Parquet feature layers provide a scalable way to visualize and explore large, read-only datasets. Created using ArcGIS Data Pipelines and built on Apache Parquet, they leverage a columnar storage format and are spatially optimized for efficient storage and fast visualization. By bringing the powerful capabilities of Parquet to the ArcGIS Online platform, Parquet feature layers enable interactive mapping experiences through familiar visualization and exploration workflows in Map Viewer.
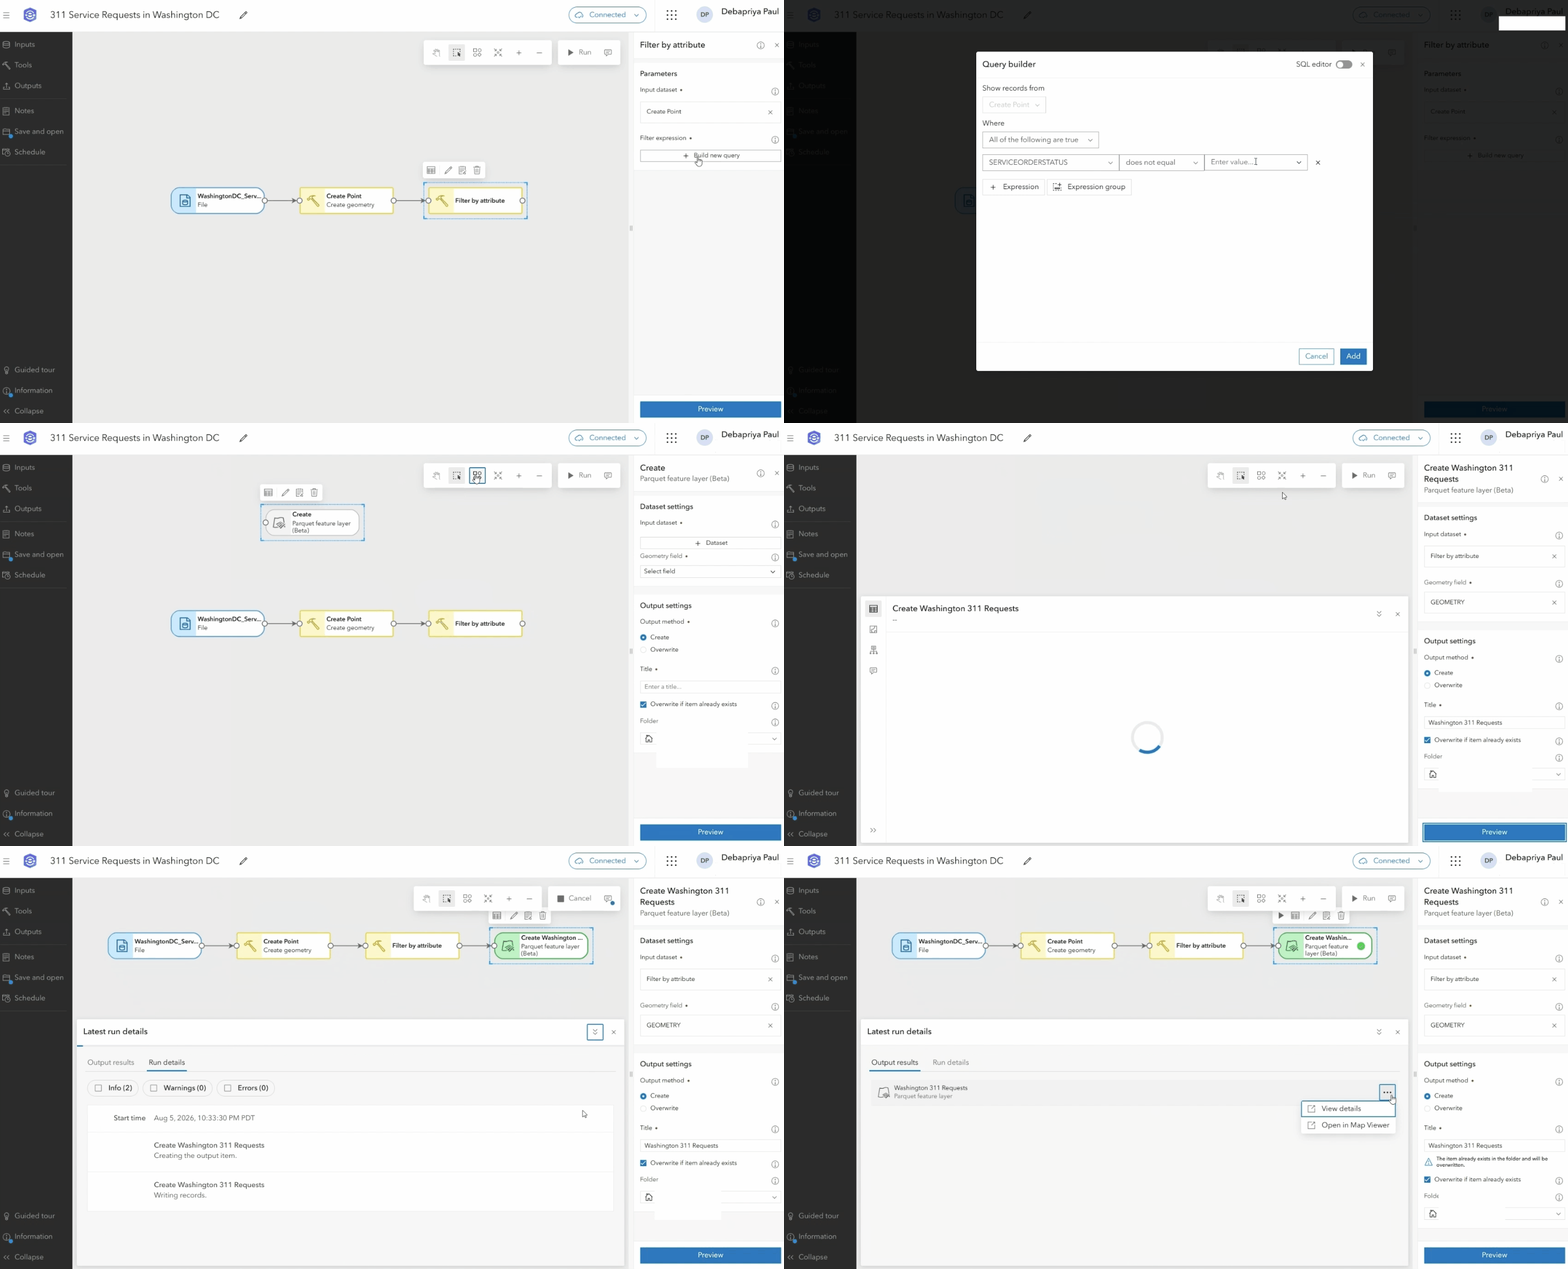
Let’s look at an example using 311 Service Requests in Washington, DC, where new requests are added each month. The goal is to create a read-only layer that enables map audiences to visualize the spatial distribution of service requests across the city and identify areas with higher concentrations of activity. Using ArcGIS Data Pipelines, I:
- Selected the 311 Service Request (CSV) file as an input
- Created point features using location attributes (latitude and longitude columns)
- Filtered out requests that were Canceled
- Published the output as a Parquet feature layer
Once published, Parquet feature layers can be opened directly in Map Viewer to start exploring the data. If you are already in Map Viewer, take advantage of the new Parquet feature layer filter to quickly find the layers you want to work with.
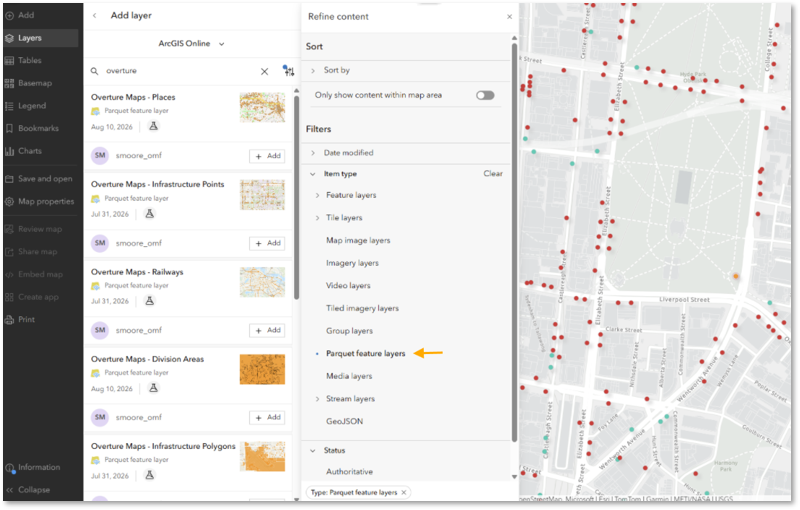
Configure Parquet feature layers in Map Viewer
Parquet feature layers integrate seamlessly with Map Viewer and support the familiar visualization and configuration workflows available for other layers that contain feature data. You can style the layer, configure pop-ups and labels, apply feature effects to highlight features on the map, and aggregate dense features to reveal meaningful patterns using Map Viewer.
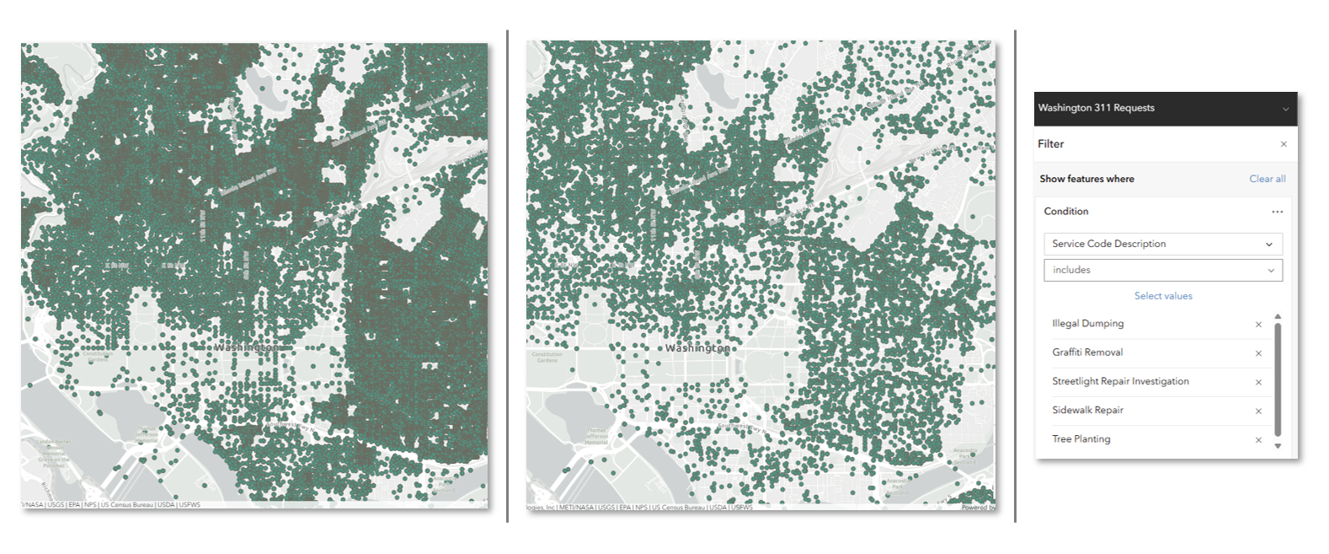
Let’s explore the 311-service requests Parquet feature layer in Map Viewer. Rather than displaying every service request type, I used an attribute filter to focus on five public service categories of interest: Illegal Dumping, Graffiti Removal, Streetlight Repair, Sidewalk Repair, and Tree Planting.
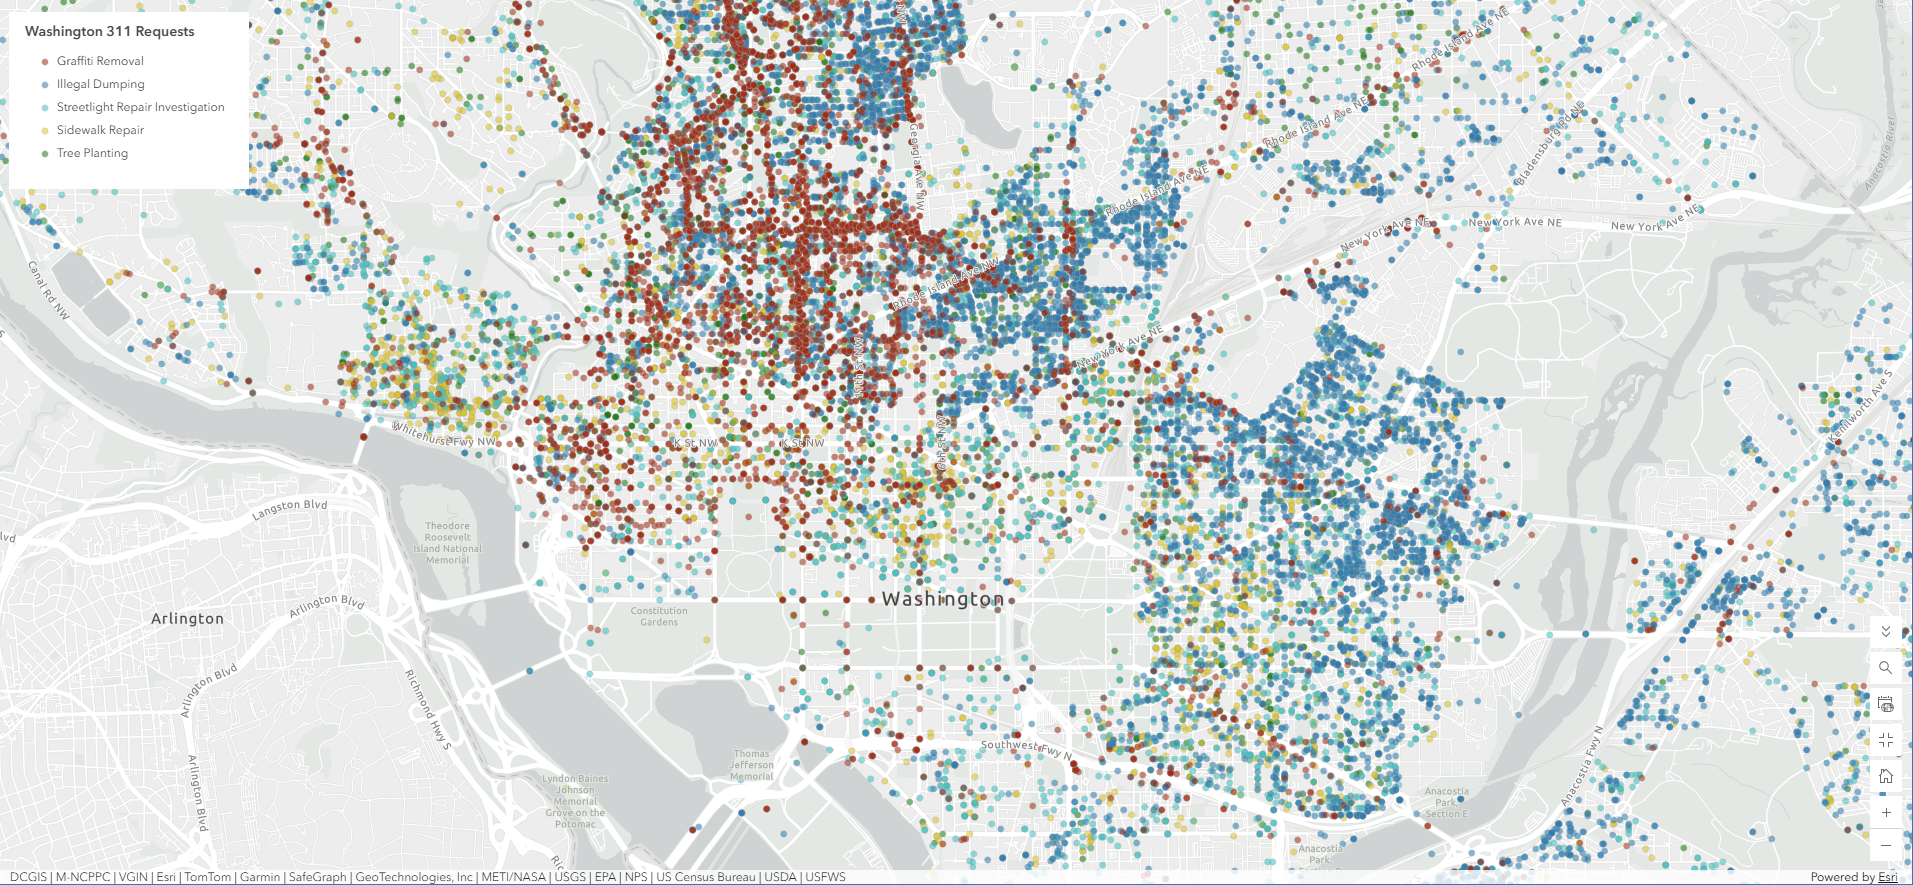
Using the types (unique symbols) smart mapping style, each category is represented in a unique color, making it easier to compare spatial patterns across the city.
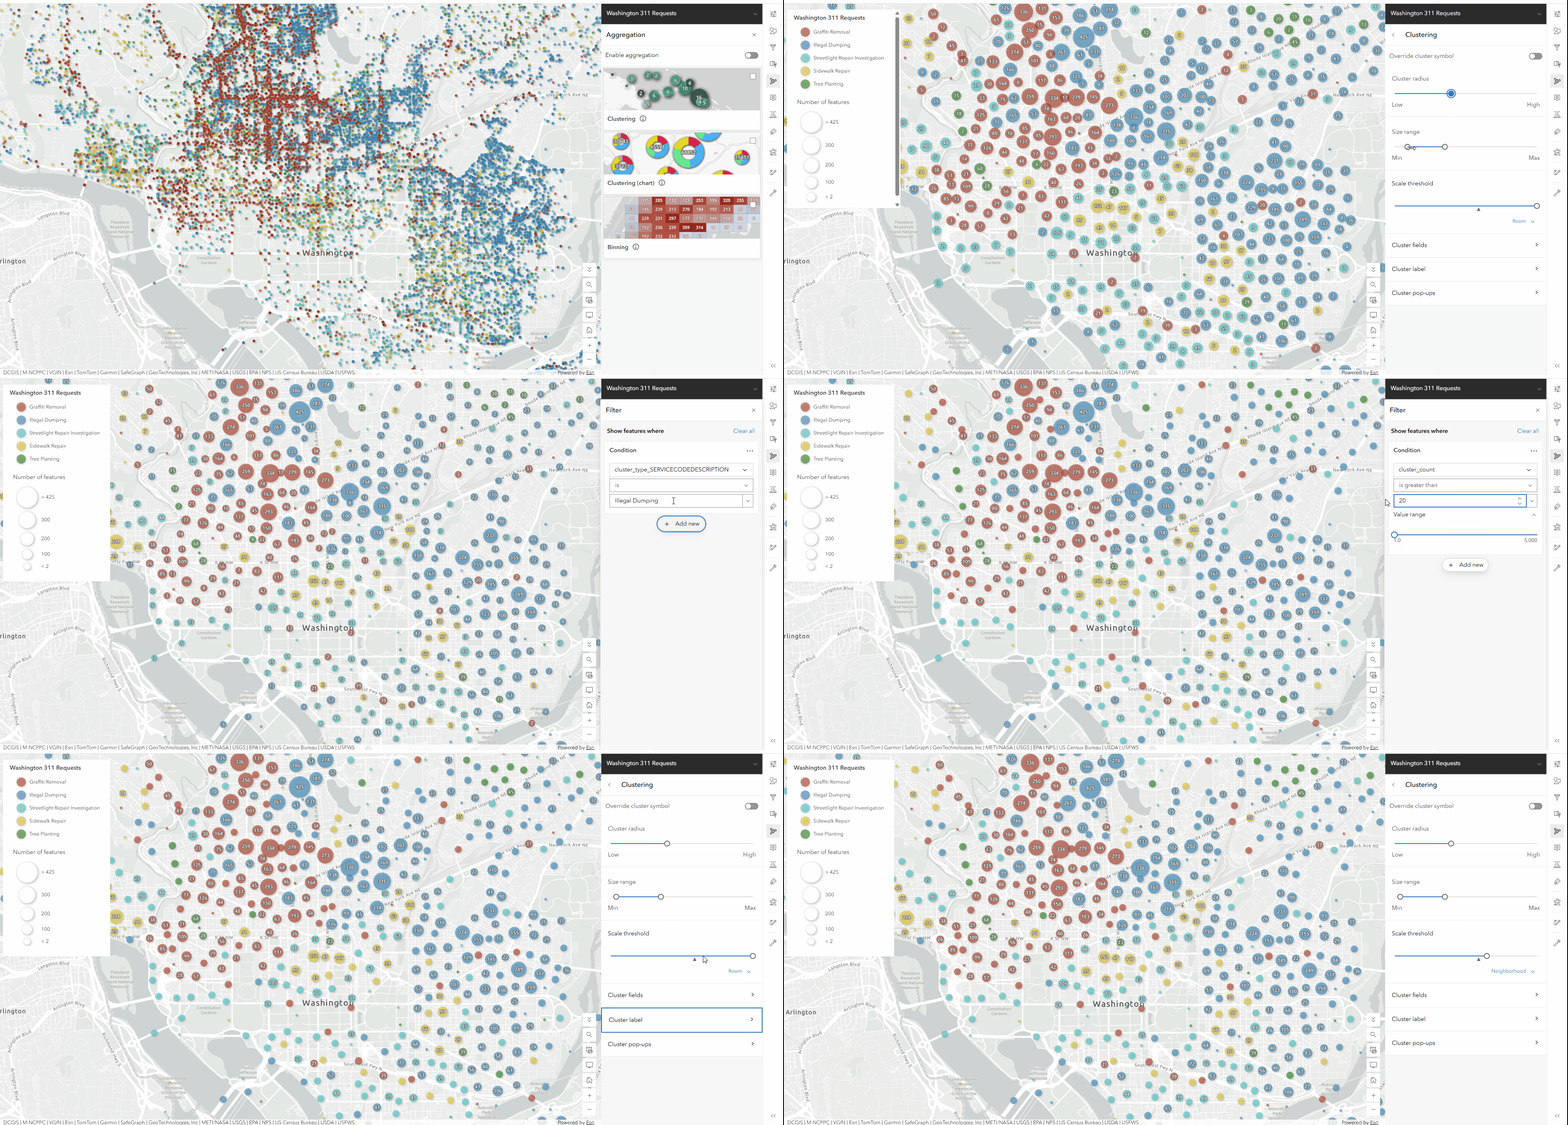
The filtered dataset still contains many overlapping features, so I enabled Clustering to highlight areas with higher concentrations of requests. Adding a scale threshold on the clusters supports two levels of storytelling on the map: clusters provide a city-wide view of 311 activity, and then automatically transition to individual features when zooming in to explore specific neighborhoods.
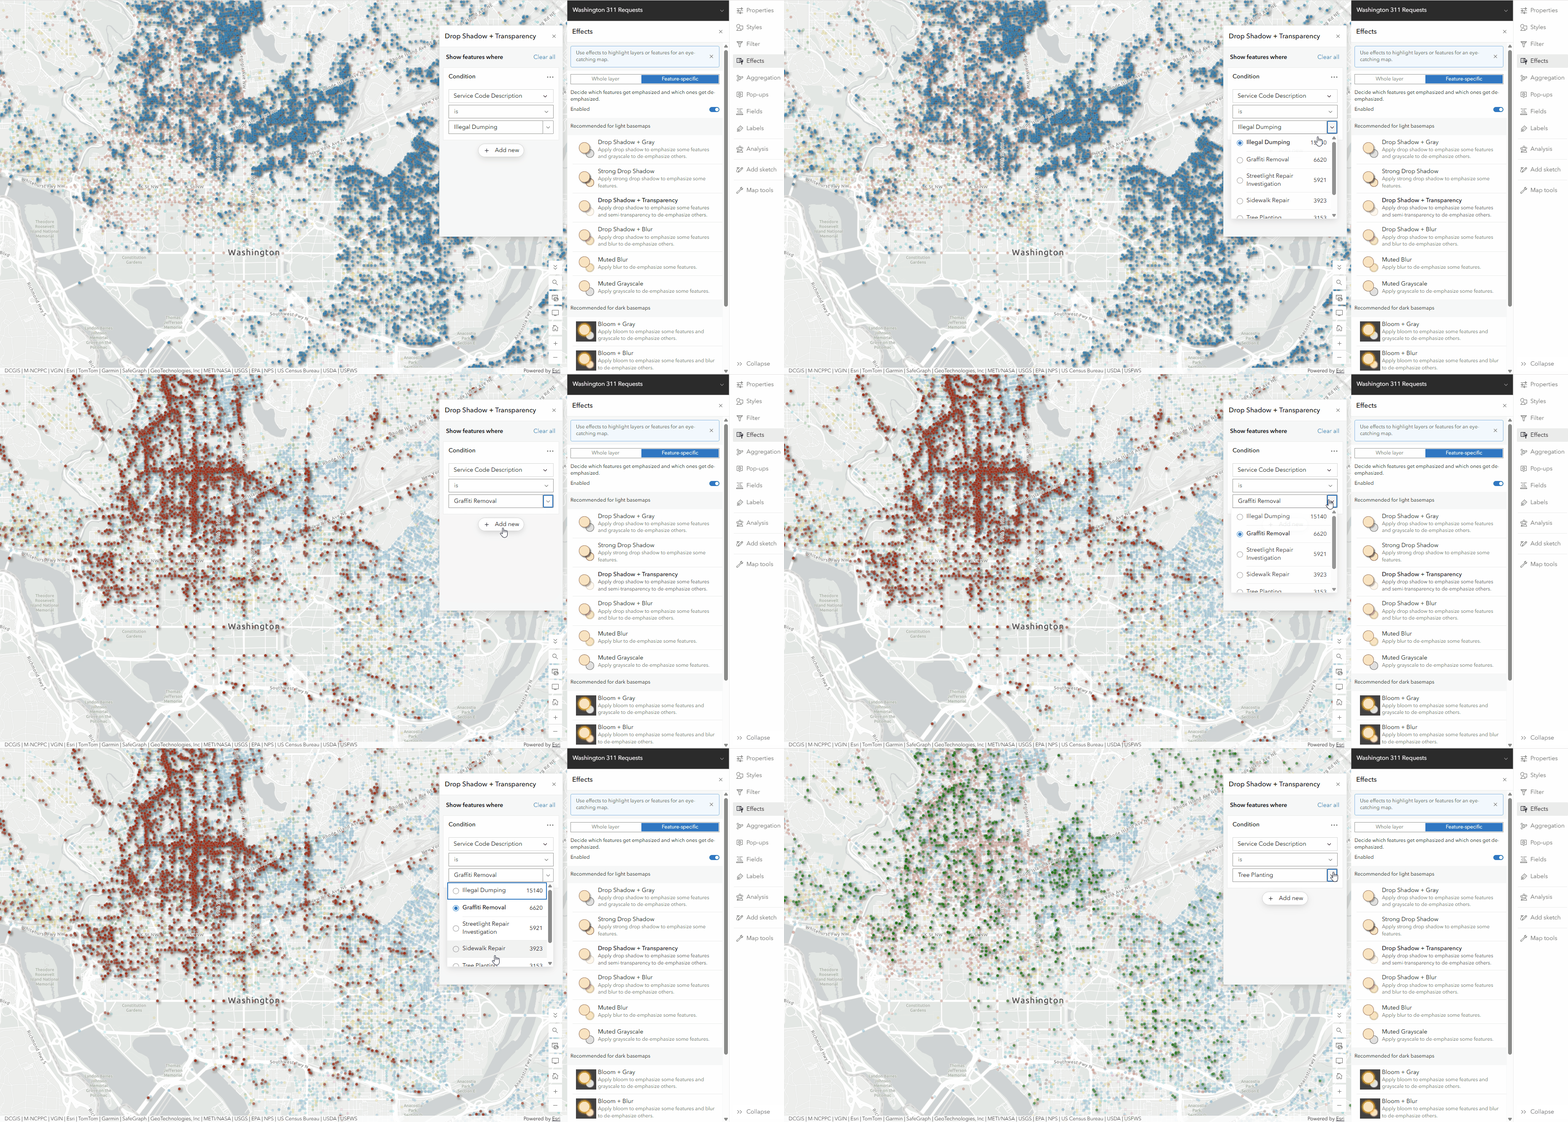
Feature-specific effects bring spatial patterns in the layer to life. In this example, a Drop Shadow + Transparency effect was applied to make each 311-request type stand out on the map. While some request categories, such as Illegal Dumping and Graffiti Removal, form noticeable clusters in certain parts of the city, others, such as Tree Planting, are more broadly distributed throughout Washington, DC.
Overwrite Parquet feature layers
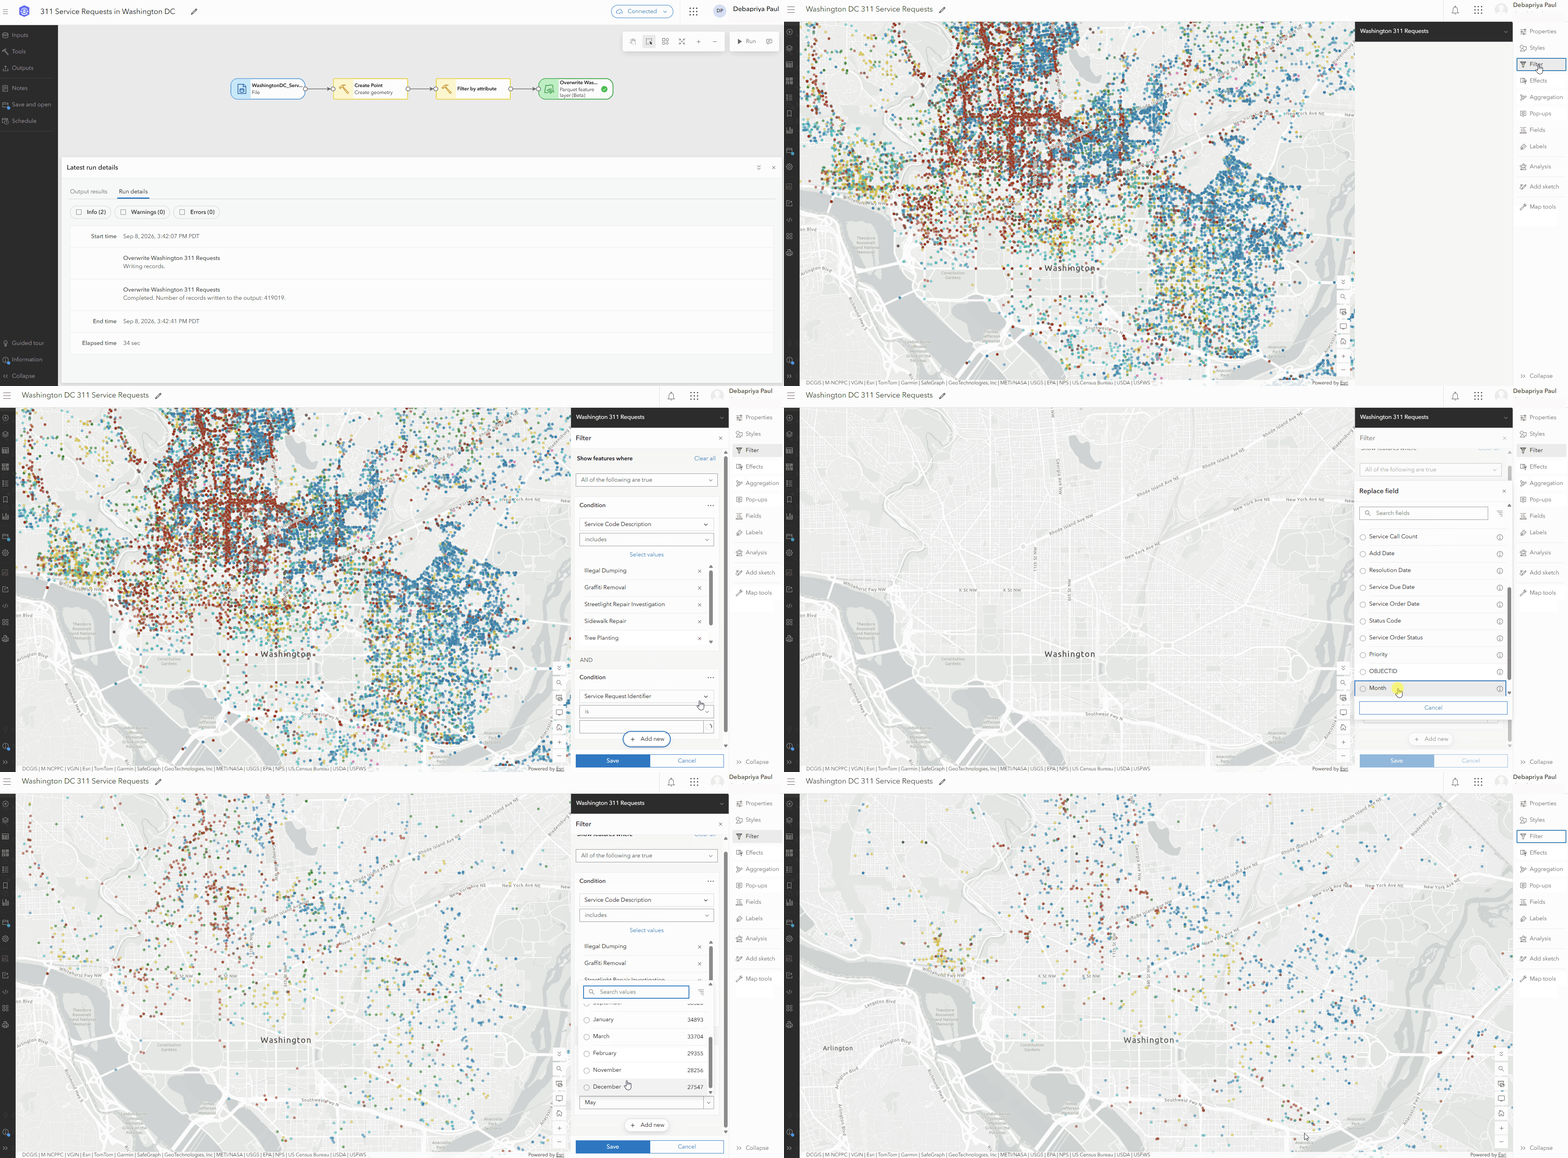
As new data becomes available, existing Parquet feature layers can be easily updated using ArcGIS Data Pipelines. In this example, I used ArcGIS Data Pipelines to overwrite the existing 311 Service Requests Parquet feature layer with the latest data for December.
Once the overwrite is complete and the web map is reopened, it automatically reflects the updated requests while preserving the existing visualization settings. By filtering the data to specific service request categories and the month in which they were reported, I could easily highlight spatial patterns in recent activities and create maps that tell focused stories.
Use Parquet feature layer as a reference layer
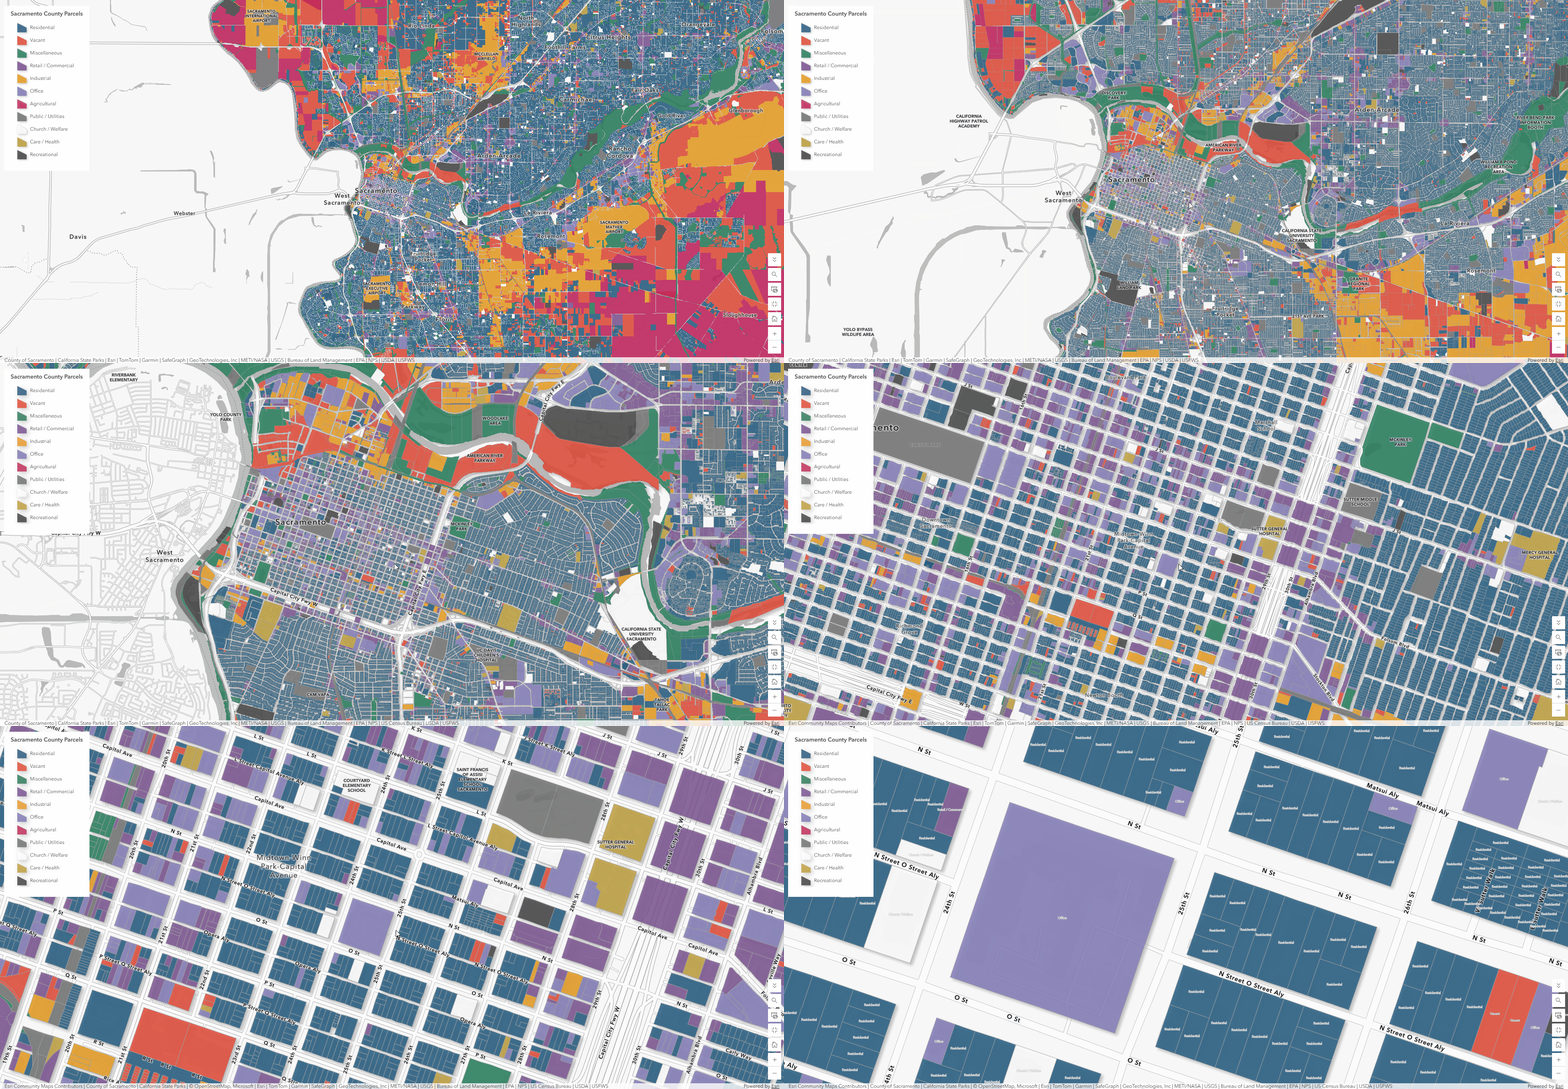
Parquet feature layers can also serve as efficient reference layers that provide geographic context in web maps. Here’s an example of Sacramento County parcel data containing thousands of features that are frequently referenced but not regularly edited. Publishing this dataset as a Parquet feature layer makes it easy to bring dense parcels as a reference layer into Map Viewer. To better visualize the data, I styled the parcels by land use type and applied a subtle outline to distinguish parcel boundaries. Scale-dependent labels appear as users zoom in, helping provide additional context when exploring individual parcels.
Integrate Parquet feature layers with contextual data in the map
Parquet feature layers can also be integrated with other layers to provide valuable context and support data exploration in a web map. For this example, I’ve published the Global Earthquake Archive as a Parquet feature layer and combined it with ArcGIS Living Atlas layers showing active earthquake faults, recent earthquakes, and earthquake shake intensity. By organizing these layers into a group layer, I can compare related datasets and uncover meaningful patterns on the map. For example, when comparing the earthquake archive with active fault lines, many historical earthquake events appear to align closely with major tectonic boundaries, helping explain concentrations of seismic activity in regions such as Indonesia and along the Pacific Ring of Fire. Enabling exclusive visibility for the group layer allows the map audience to focus on one layer at a time, making it easier to explore the relationship between earthquake events, fault lines, and areas of seismic intensity.
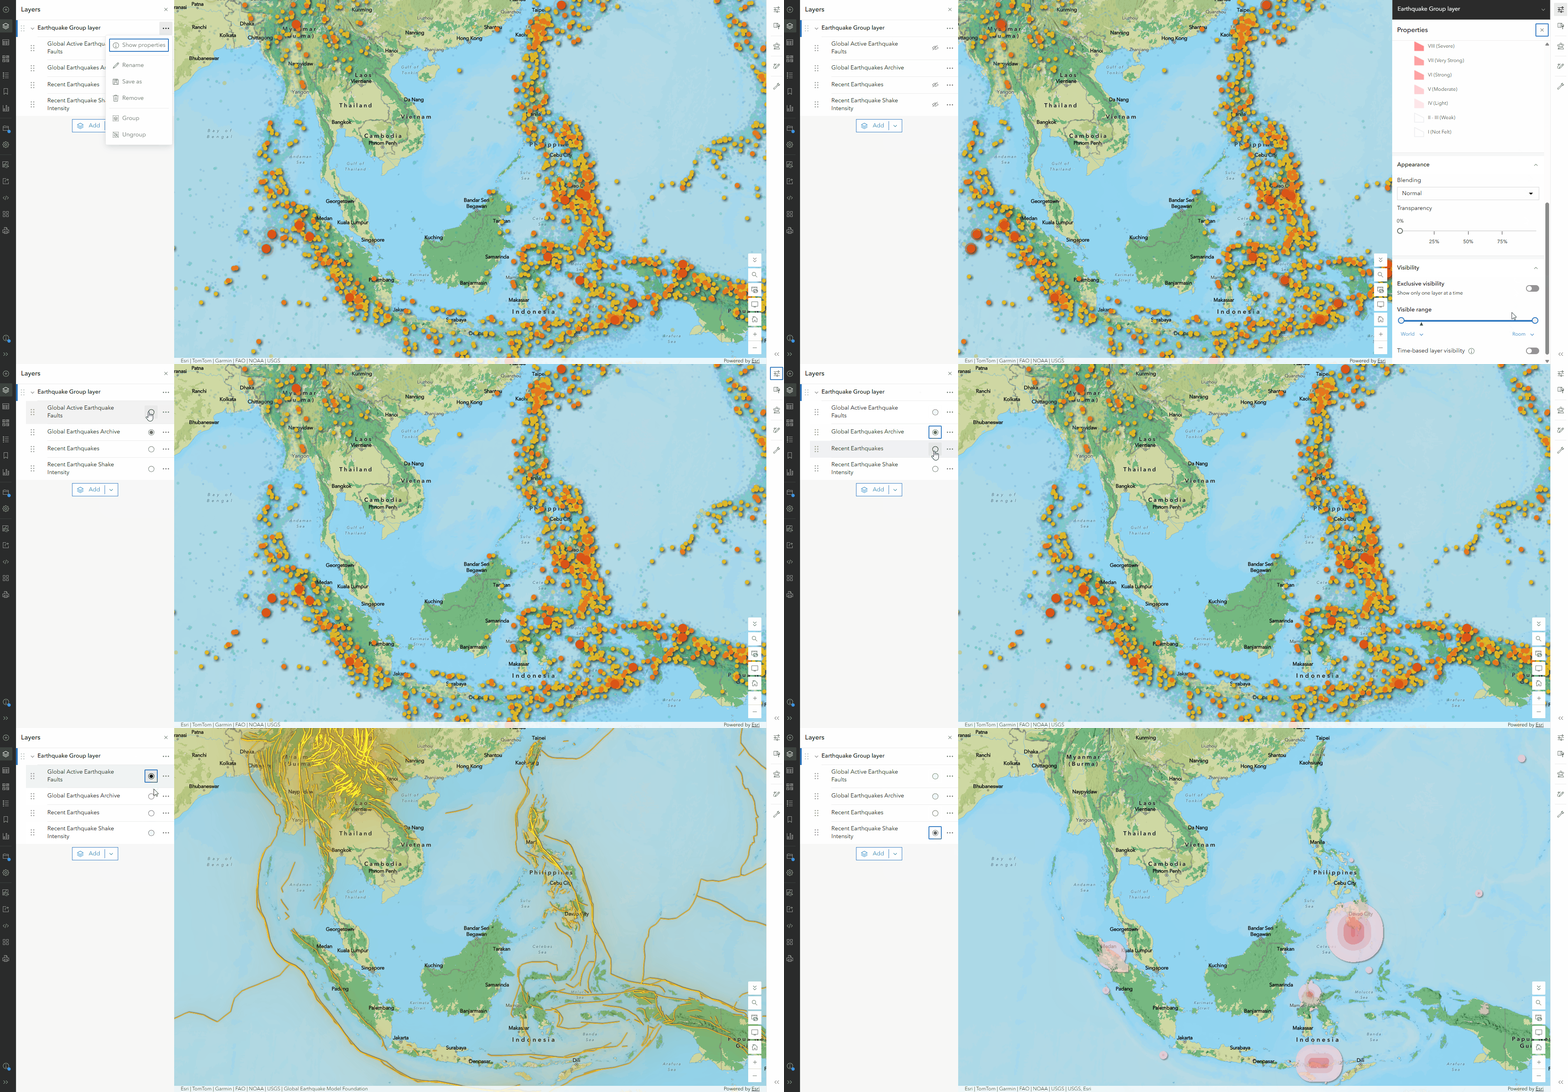
Map Viewer offers familiar capabilities for configuring Parquet feature layers, including symbology, filters, effects, aggregation, pop-ups, and labels. These configurations are stored in the web map, preserving the authored map experience when reopened or shared.
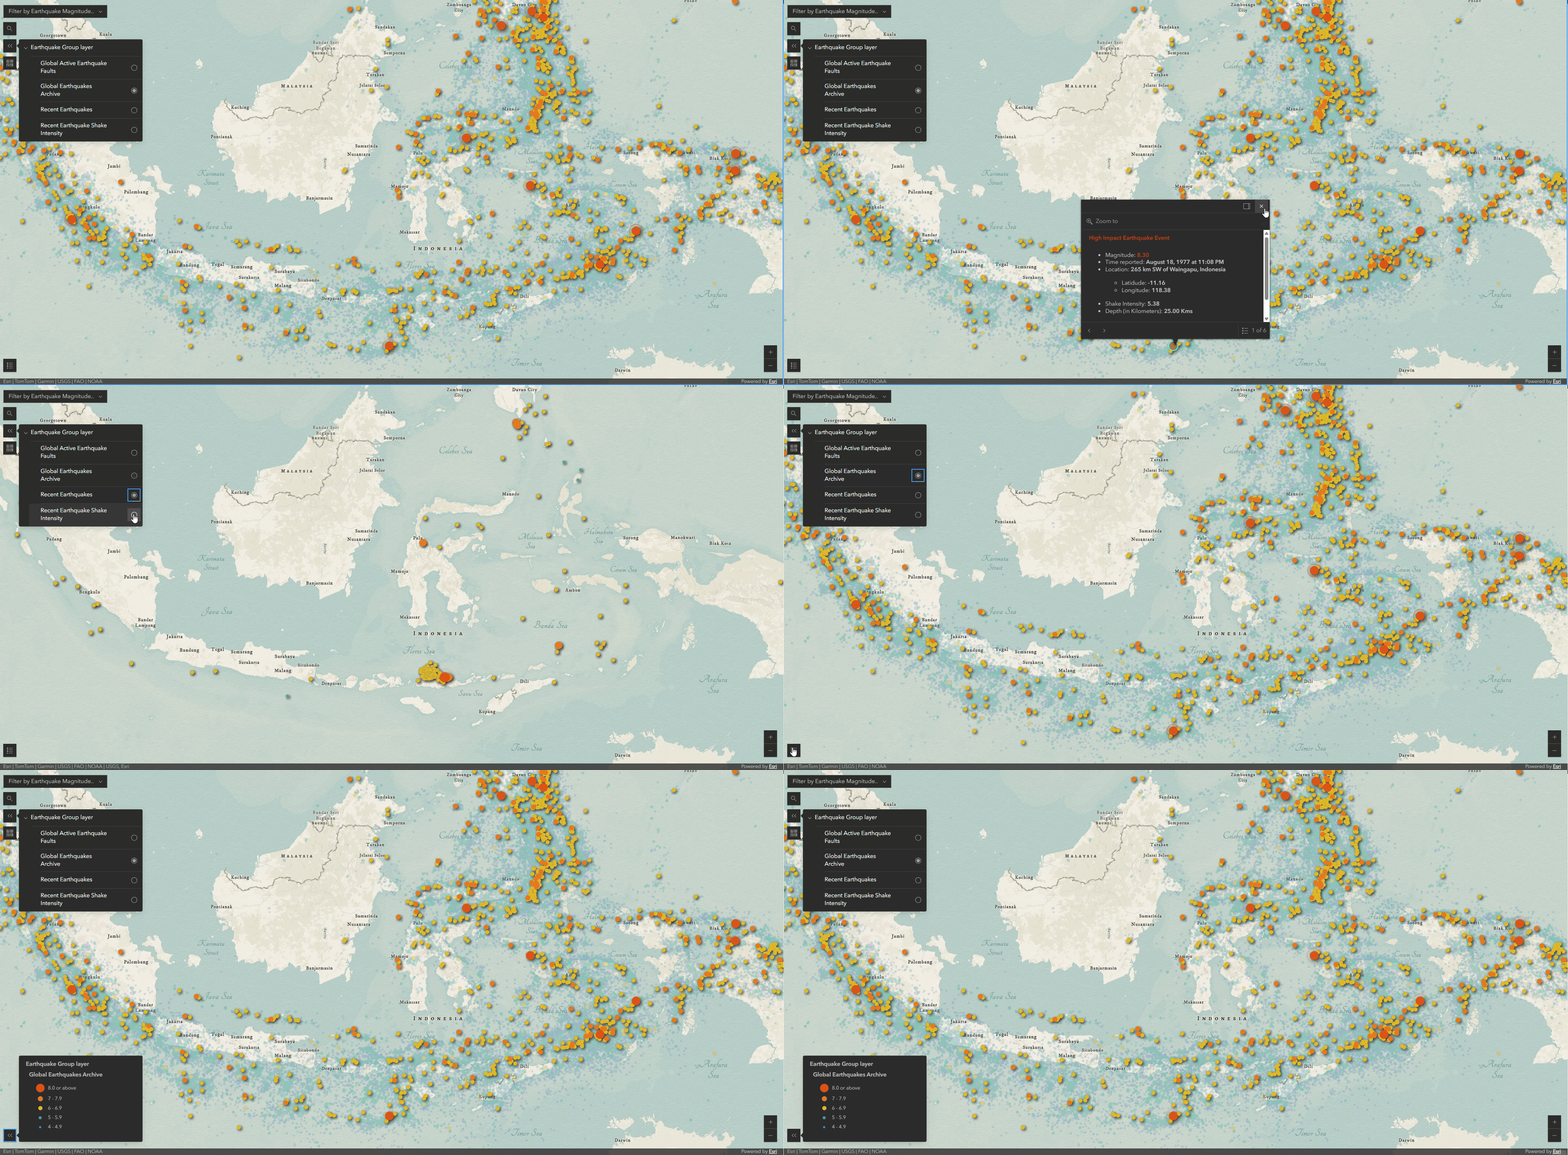
In the example below, I’ve used the web map that I configured in Map Viewer earlier. The map combines the Global Earthquake Archive Parquet feature layer with ArcGIS Living Atlas layers in a group and uses exclusive visibility to explore one layer at a time. I then used ArcGIS Maps SDK for JavaScript to build a custom application that consumes the web map and further enhances the user experience with event filtering by magnitude, legend support, and a dark mode theme. Because the layer configurations are stored in the web map, settings such as styling and pop-ups travel with the web map and are automatically available in the application. This creates a consistent experience across Map Viewer and web applications that consume the web map.
Road Ahead for Parquet Feature Layers in Map viewer
This is just the beginning! We are excited to continue enhancing Parquet feature layer capabilities and support deeper integrations across the ArcGIS platform. Enhancements planned for future releases:
- Support additional date and time field types
- Time series configuration based on field values
- Support for Charts to enhance data visualization
- Persisting layer configuration directly to Parquet feature layer items
- Data and Visualization tab support in the item page
Map Viewer brings Parquet feature layers to life through familiar data visualization and exploration capabilities, enabling map authors to identify patterns, uncover insights, and create engaging mapping experiences from their data.

Commenting is not enabled for this article.