When discussing scale-based sizing, reference scale cannot be overlooked. It’s been a part of cartographic workflows since ArcMap. For printed maps, reference scale’s single scale approach is integral to map design. However, because of the multi-scale nature of web maps, reference scale struggles due to its focus on a single-scale. For that reason, Map Viewer introduced adjust size automatically into Smart Mapping. Instead of referencing a single scale, adjust size automatically works by calculating optimal symbol sizes for a range of scales, rather than a single scale. Feature sizes are bounded at exceptionally large and small scales, ensuring they are consistent and legible as you zoom in and out on the map.
With the October 2025 and the upcoming 12.1 release we are happy to support adjusting size automatically for Subtype Group Layers. You can now handle scale based sizing through enabling adjust size automatically on a sublayer. In this post we’ll go over how adjust size automatically works, how to apply it in Map Viewer, how to achieve a similar look and feel for labeling, its differences to reference scale, and why adjust size automatically is intended for the web. By the end of this blog, you’ll have an informed grasp of why adjust size automatically works better with the interactive nature of web-based mapping.
Adjust Size Automatically Explained
First, let us go over adjust size automatically and how to apply it to your sub-layers. By default, layers published from ArcGIS Pro have static feature sizes applied. This can create issues when moving between scales. For example, applying a symbol size at a larger scale will look applicable for that scale, however, moving to a smaller scale results in overlapping features; on the other hand, setting the size to something smaller works at small scales but zooming back in results in overly tiny features. Adjust size automatically works by dynamically changing the feature size for multiple scales, subtly balancing feature sizes between large and small scales. Check out the maps below to see how static symbol size compares to adjust size automatically and reference scale.
Map With Static Symbol Size
This map has a static symbol size set. The size of the features is fixed, zoom in and out to see how the symbols behave at large and small scales.
Map With Adjust Size Automatically Enabled
This map has adjust size automatically enabled on the sub-layers. Test out different scales to see how the features automatically change size.
Reference Scale on a Multi-Scale Web Map
Below is a custom app using the ArcGIS Maps SDK for Javascript to create reference scale online. Zoom in and out of the map to see how reference scale works on the web.
Under the Hood
Adjust size automatically functions by adding a size visual variable to the layer’s renderer. The size visual variable can be applied to point, poly-line, and polygon outline features. Three variables make up the size visual variable object: type, valueExpression, and stops. Type stores the type of visual variable, valueExpression holds the current scale in the map view, and stops contains multiple scale levels each with a computed size.
"visualVariables": [
    {
      "type": "sizeInfo",
      "valueExpression": "$view.scale",
      "stops": [
        {
          "size": 7.5,
          "value": 1129
        },
        {
          "size": 6,
          "value": 9028
        },
        {
          "size": 3,
          "value": 72224
        },
        {
          "size": 1.5,
          "value": 577791
        }
      ]
    }
  ]
Stops drives the magic that is web based dynamic scale sizing. Each stop is calculated algorithmically and contains a scale as well as a feature size for that scale level. Take the provided example below. The first stop specifies that while the view’s current scale is equal to or greater than 1:1129, symbols will be rendered at a size of 7.5. This makes certain that the symbol size is fixed at 7.5 when zooming past 1:1129. For scales between 1:1129 and 1:9028, the size will be linearly interpolated; such that, as you move further away from 1:1129 and closer to 1:9028, the size of the symbol will gradually shrink from 7.5 to 6. When the view’s scale is less than 1:1129 or greater than 1:577791, symbols will remain fixed at 7.5 and 1.5 respectively. This guarantees balance and fluidity as you zoom in and out on the map. As you approach extremely large and small scales, the symbol size will reach it’s bounds, making certain that symbols remain moderately sized.
Another great advantage of this approach is that handling the sizing at differing scales is simplified for you. You don’t need to worry about setting multiple scales or the sizes at each scale. The algorithm handles all the complexity for you. All you need to do is check a box.
How to Enable Adjust Size Automatically In Map Viewer
Let’s look at how to apply dynamic sizing in Map Viewer.
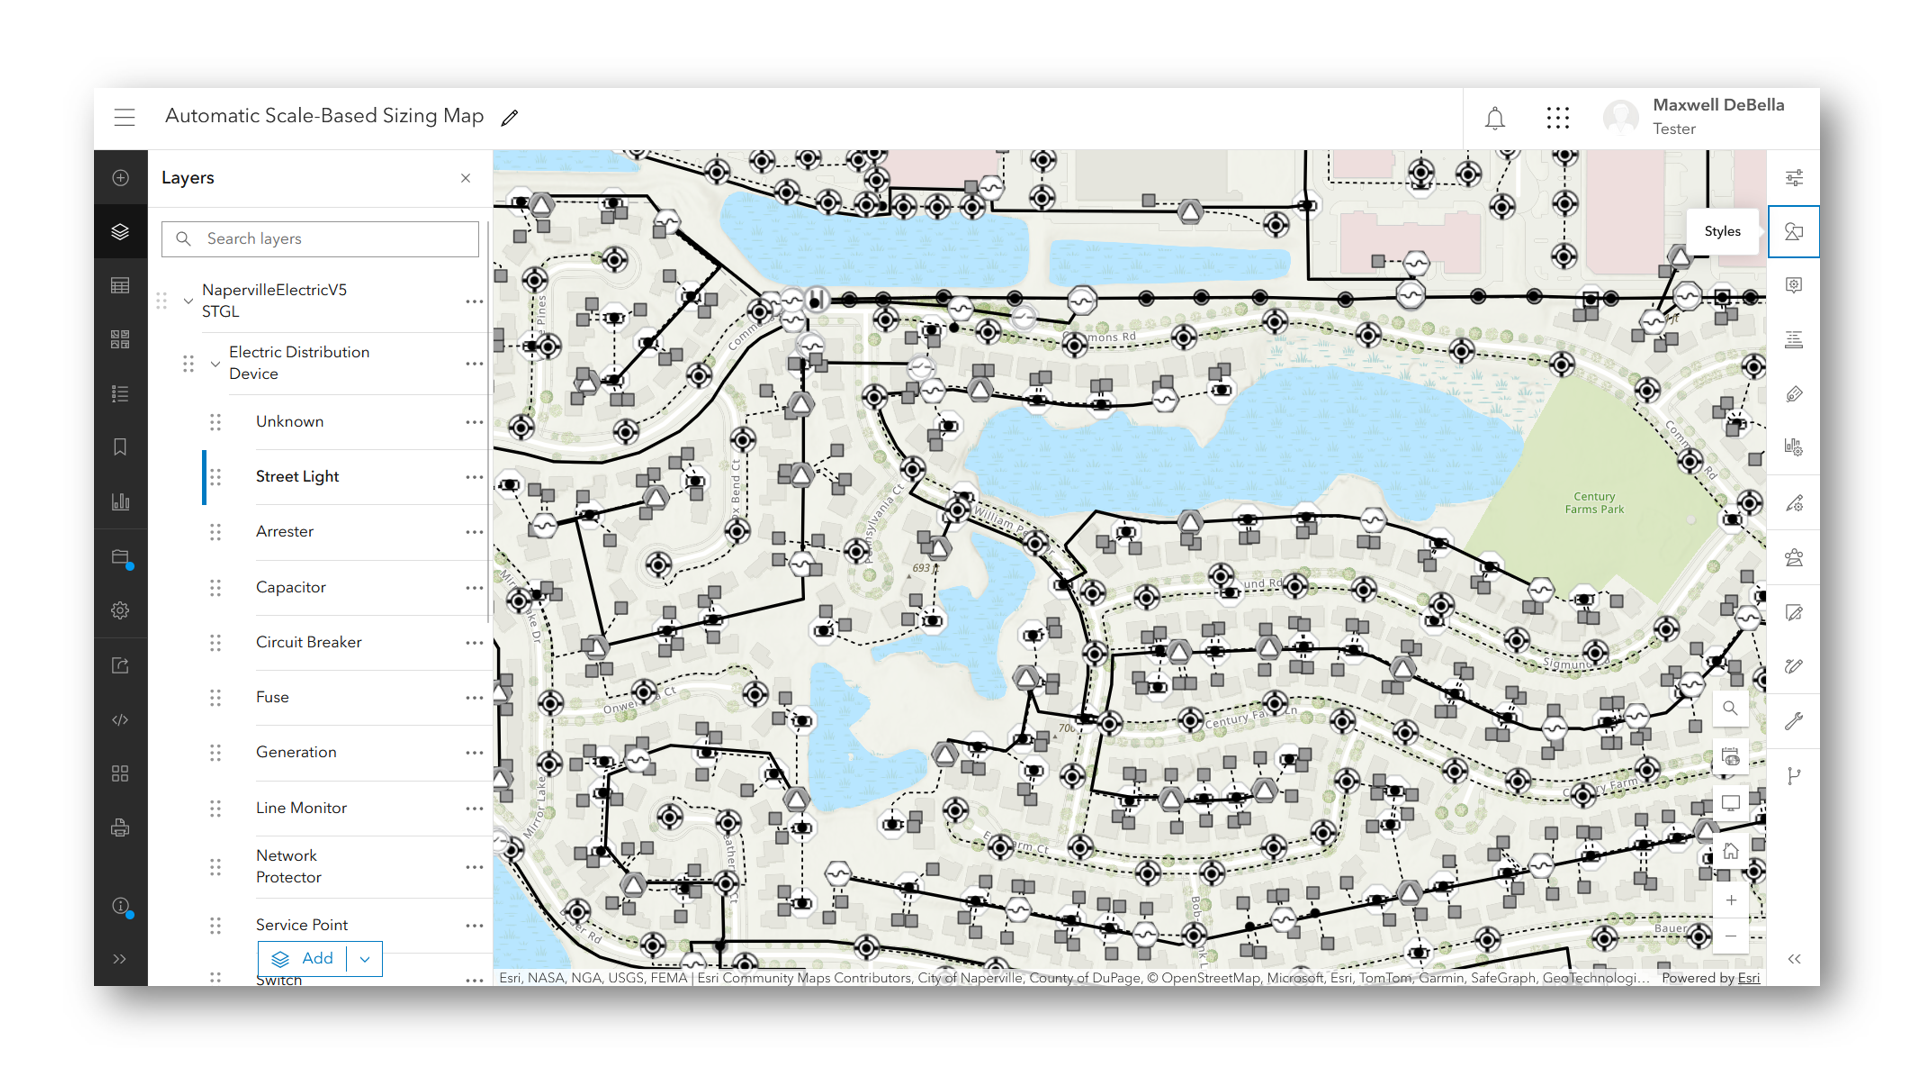
1. Start by selecting a sublayer
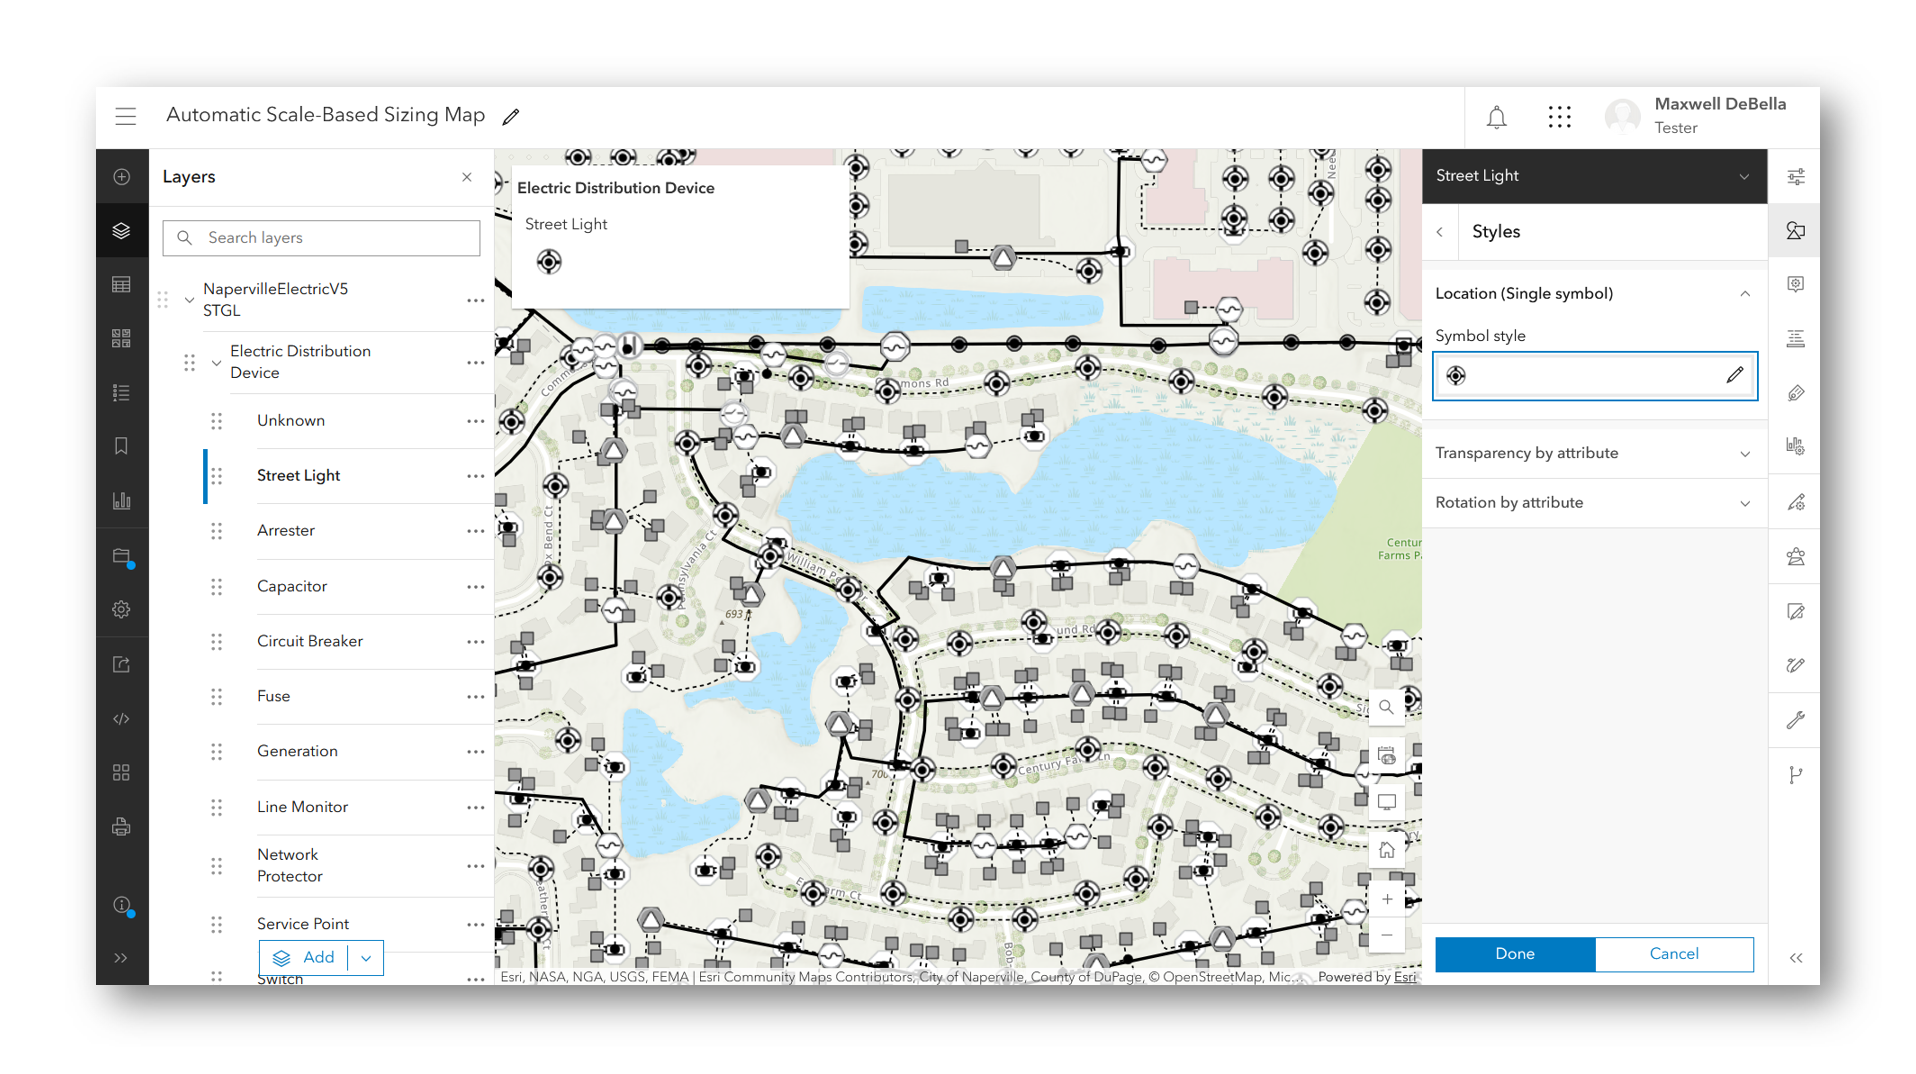
2. Once the sub-layer is selected, click the Styles button on the right action bar.
3. Here you can change the renderer. We are going to stick with the default simple renderer.
4. Open the symbol styler.
5. Zoom to the scale you would like to start with.
6. Click the box right below the size slider that says adjust size automatically.
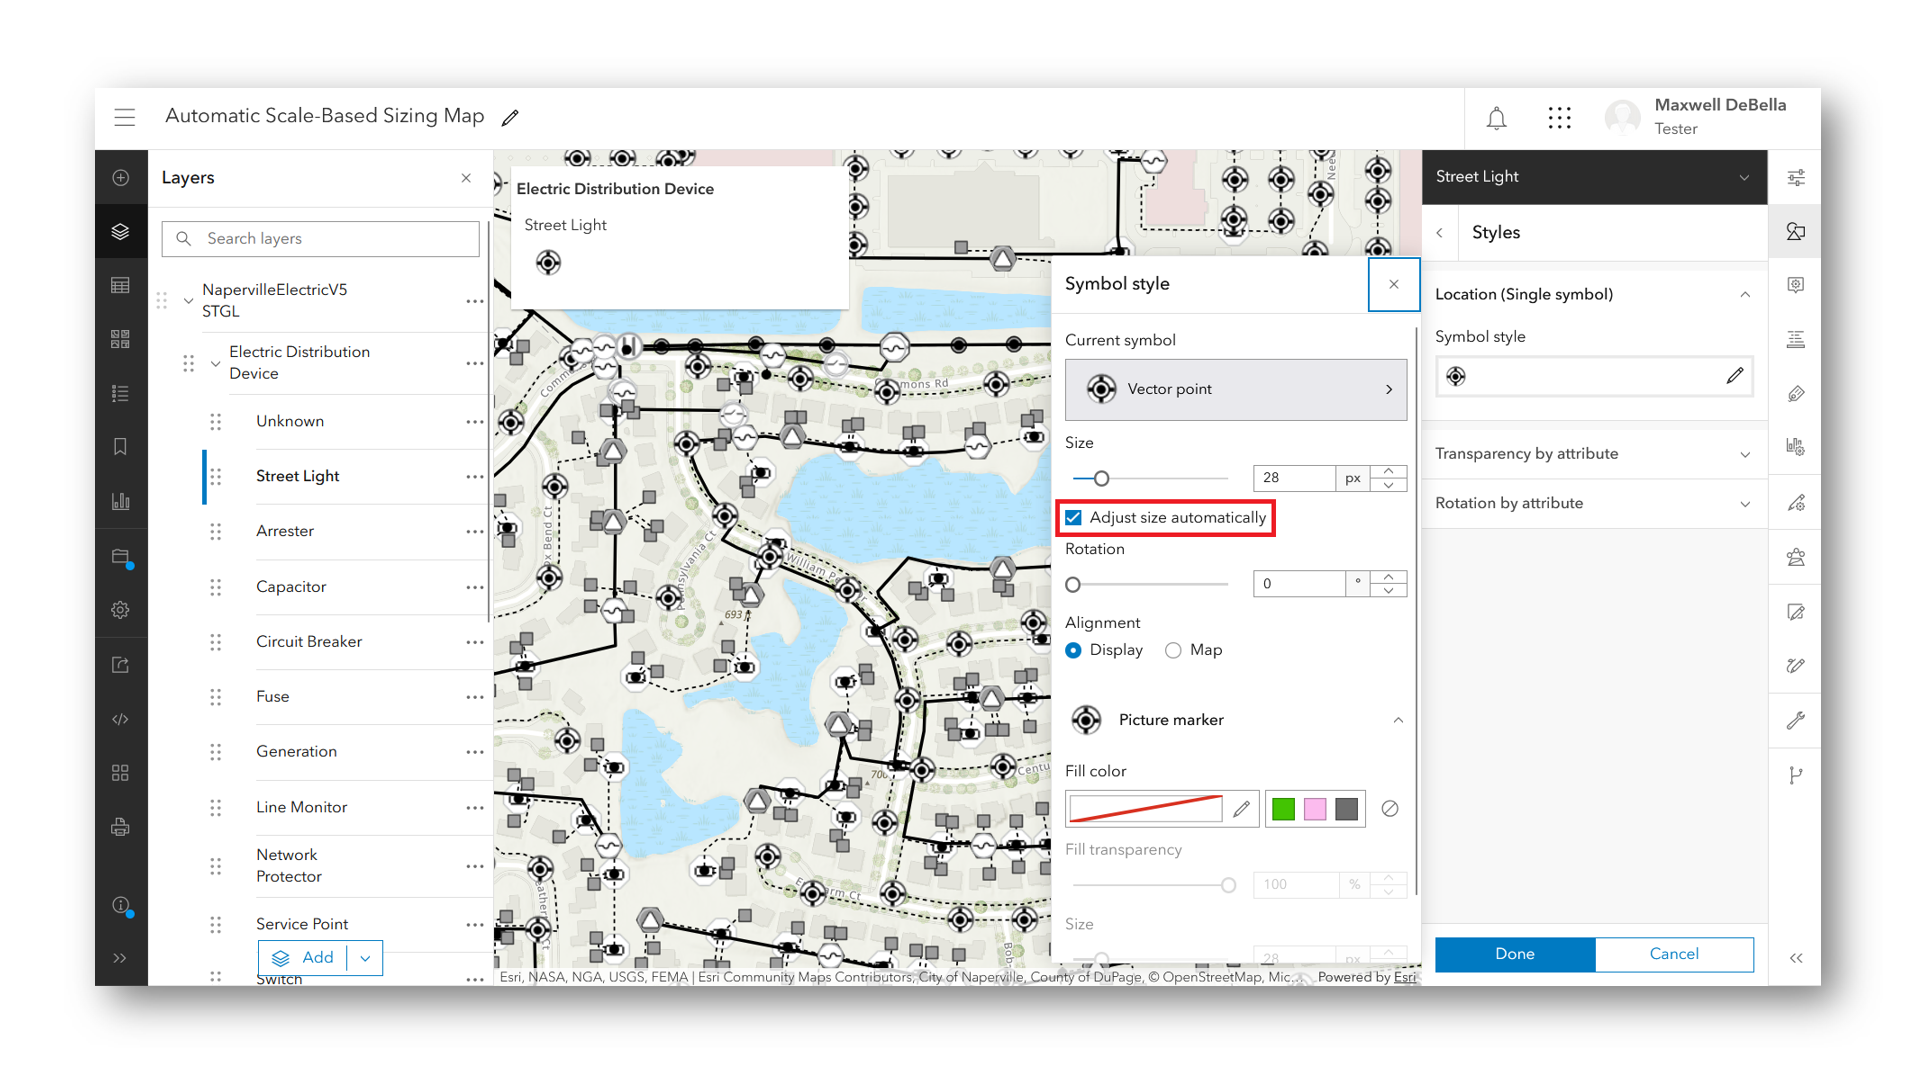
7. Adjust the size of the feature to meet your needs at that current scale.
8. Zoom in an out to see how the sizing changes at different scales.
9. Feel free to change the size in the symbol styler. This will readjust all the stops automatically.
10. Once you feel good about the size, save the map and or the layer.
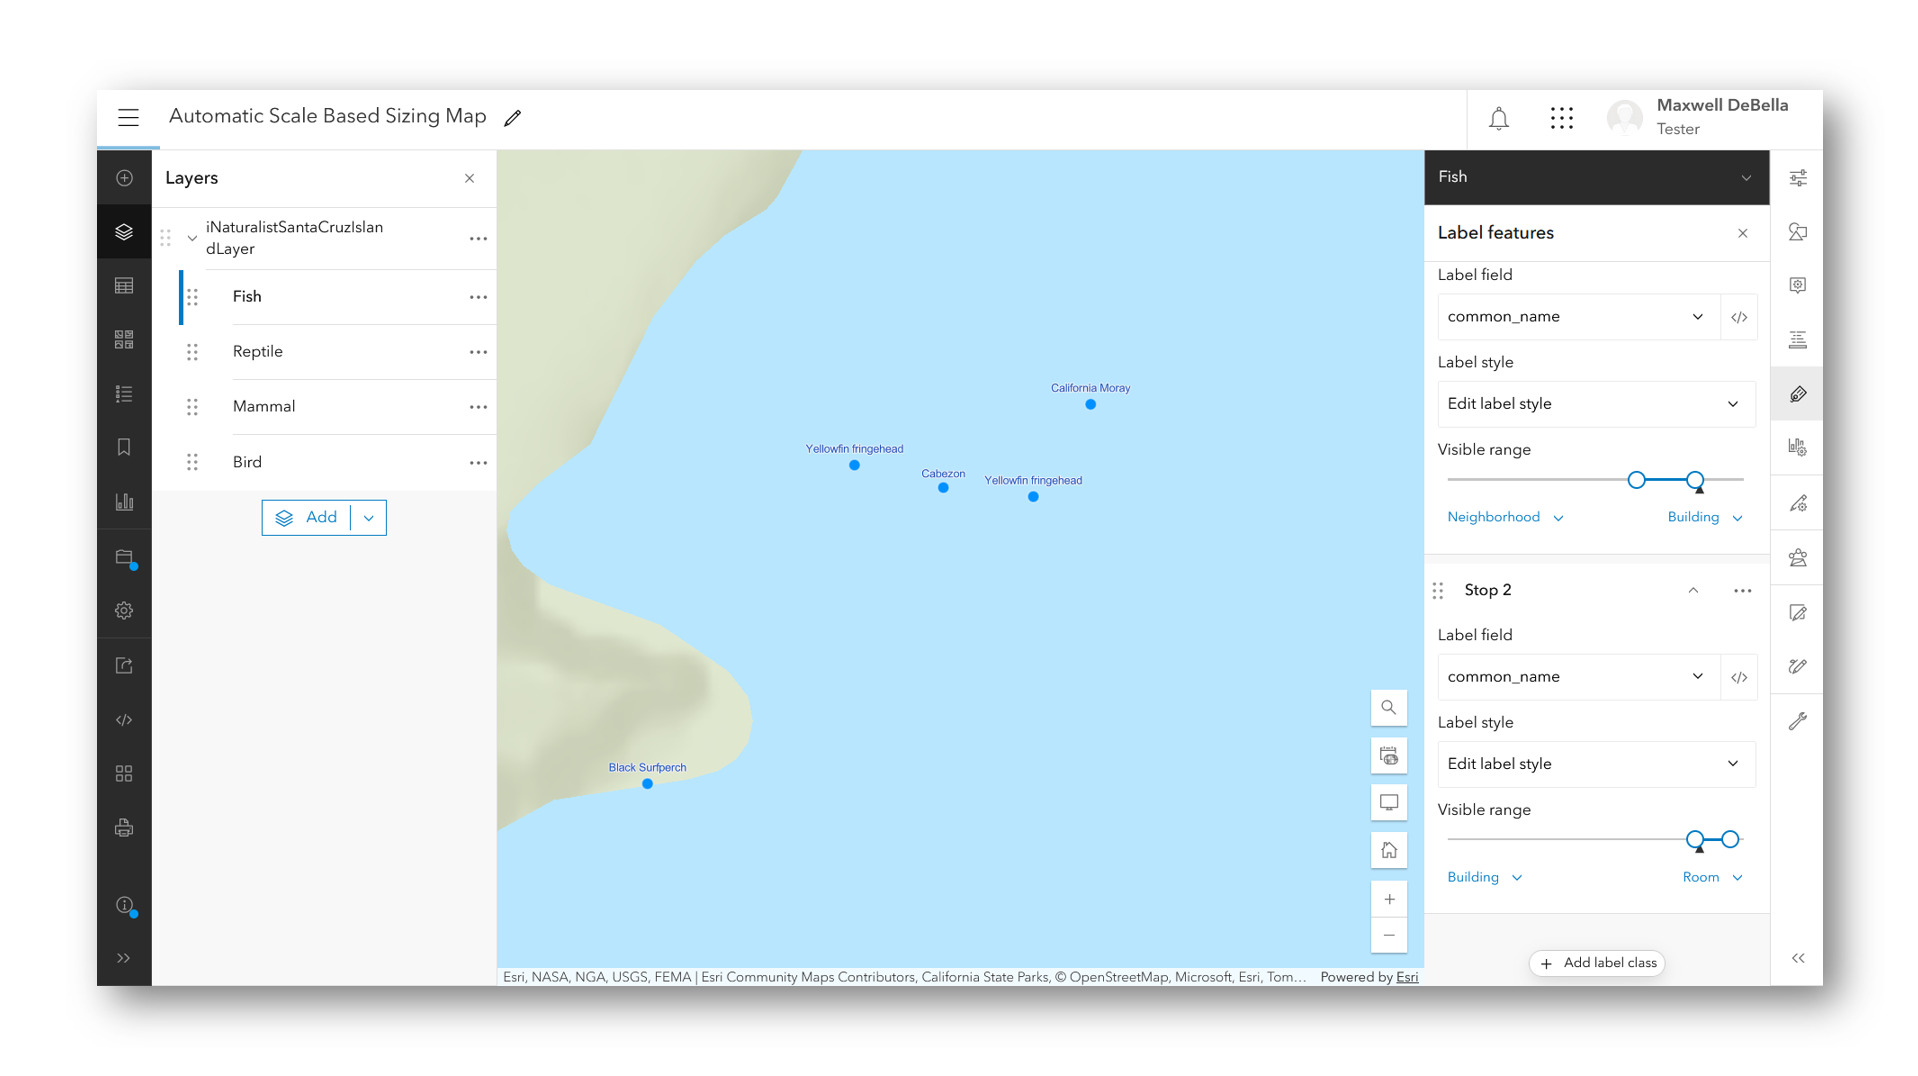
Labels
Although, adjust size automatically doesn’t apply to labels, you can still achieve scale based sizing by utilizing multiple label classes. In order to accomplish a similar experience each class will have to manually created and configured accordingly. Below is a step by step guide on generating multiple label classes at varied scale ranges.
1. Select a sub layer.
2. Open Labels on the right action bar.
3. Click Add label class.
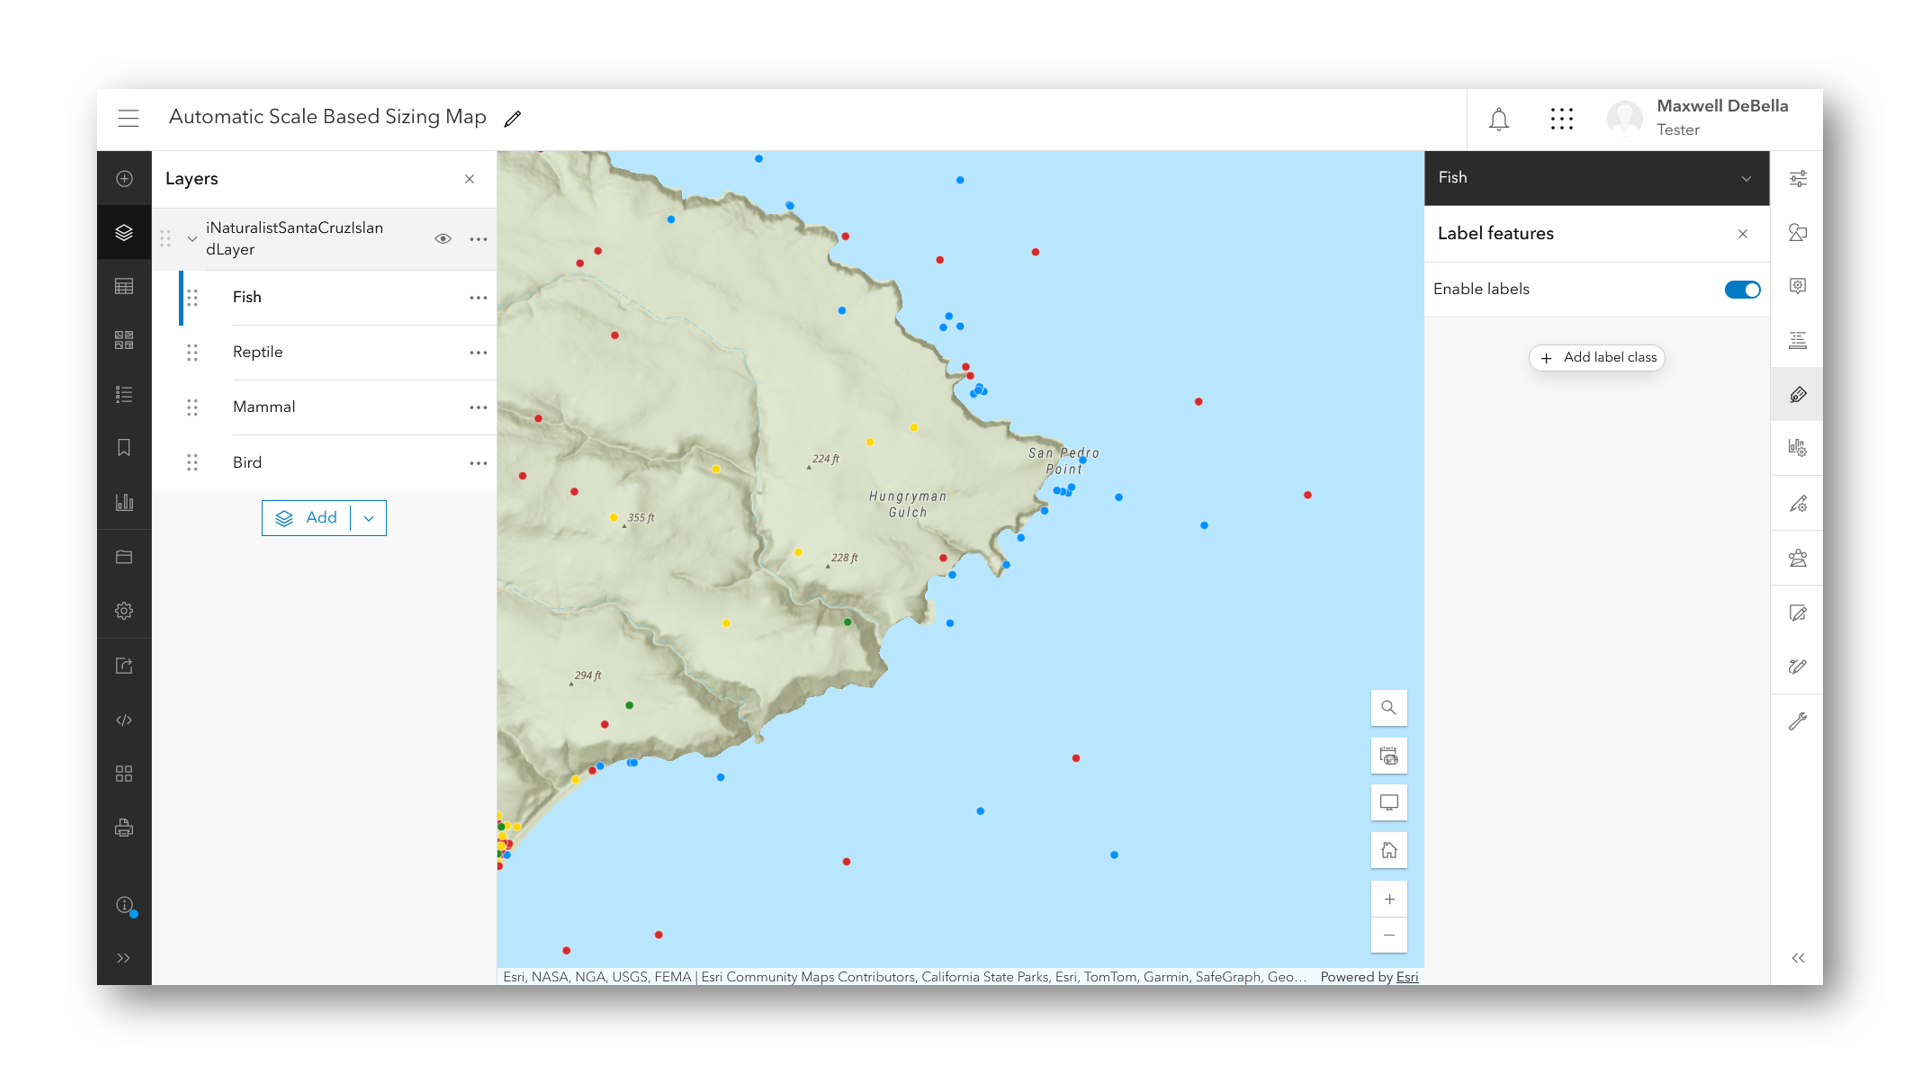
4. Select the field you want to display.
5. Once the field has been selected, configure the label style to your needs.
6. Adjust the visible range’s first stop to be equal to scale you want labels to first become visible.
7. Set the visible range slider end to be equal to the scale you no longer want the label class to be shown.

8. Duplicate the class. This new class will serve as your second stop.
9. Change the label size to be larger.
10. Set the visible range slider start to be equal to the end of the first stop.
11. Set the visible range slider end.
12. Repeat the process until satisfied.
The Difference
You may be asking, how does reference scale fit into all of this? ArcGIS Pro has reference scale, why doesn’t ArcGIS Online? The answer is in interactivity. Reference scale was designed to handle feature sizing for printed maps. It works by maintaining feature dimensions at one specified scale. If you set a reference scale to 1:5,000 that means that the height and width of your features and labels will remain locked at 1:5,000. Zooming in and out will adjust the size of features and text based on a 1:1 linear change. If your feature size was set to 20 pt at 1:5,000 then the move to 1:10,000 the feature size would be 10 pt and so on.
On printed maps this approach works wonders, if your printed map is set to 1:5,000 then you don’t need to worry about the size on the screen differing from the printed output – what you see is what you get. This method struggles to work well with the dynamic nature of online based maps. At scales farther from the reference scale, features will be either microscopic or so enormous you won’t be able to see the map. That’s where adjust size automatically comes in. Instead of having an approach that bases size on a reference scale, adjust size automatically ensures continuity at any scale. Stops are created algorithmically to guarantee sizing is optimized for any given scale; meaning, features will be small enough to be legible at larger scales and large enough at smaller scales all while ensuring they do not grow or shrink immoderately.
Conclusion
Although reference scale is a great tool for creating printed maps, its application induces problems in the web mapping space. Utilizing adjust size automatically saves you a lot of time. You don’t need to worry about setting specific sizes for specific scales, just check a button and everything else is handled for you. With Subtype Group Layer receiving this support in the October 2025 release you can now generate highly interactive web maps that emphasize maintaining feature sizing as you zoom in and out on the map. For more information on scale-based sizing, what’s new in October 2025, and Subtype Group Layers please checkout the links provided below. Stay tuned for more updates to Subtype Group Layers and web-based symbol sizing. Happy mapping!
Links
1. ArcGIS Maps SDK for Javascript: How and why to adjust symbol size by scale in web maps
2. ArcGIS Maps SDK for Javascript: Scale-aware visualizations
3. What’s New ArcGIS Online Documentation
4. What’s New ArcGIS Online October 2025 Blog
Commenting is not enabled for this article.