If your map contains a large amount of points, it can be hard to distinguish a spatial pattern when the points overlap and cover other points. Clustering is a powerful way to visualize the overall pattern and improve the drawing speed of your map when working with large point datasets.
Within Map Viewer, you can now do more with point clustering. Let’s explore some of the ways clustering can be used to improve your point feature maps.
Where to find it
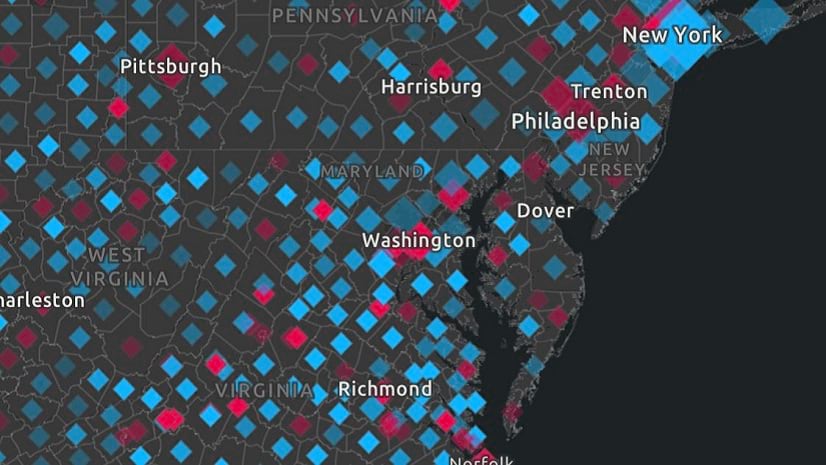
Within Map Viewer, clustering appears on the Settings toolbar on the right as its own button. The Clustering button will appear automatically when mapping point features. Choose to enable clustering and the map will translate your existing map symbology into clustered features. For example, the map below shows historic piracy events, like we have seen in John Nelson’s Piracy & Time Travel blog. When clustered, the different types of piracy are grouped and represented with the color of the most common type of piracy. The size of the symbol shows how many events of piracy are within that cluster.
Cluster labels
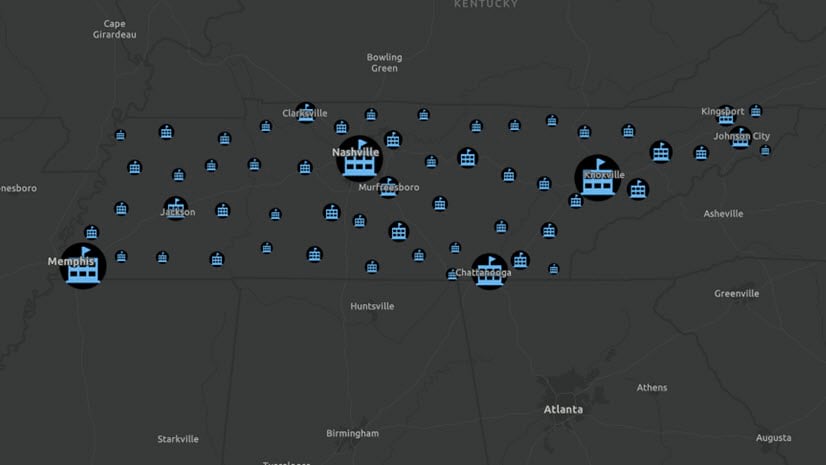
Have you ever used clustering and thought “how many points are in that cluster?”. With the newest release, you can now see how many points are in a cluster by a label that appears on each symbol. This makes it easy to see where there are a concentration of point features in your data.
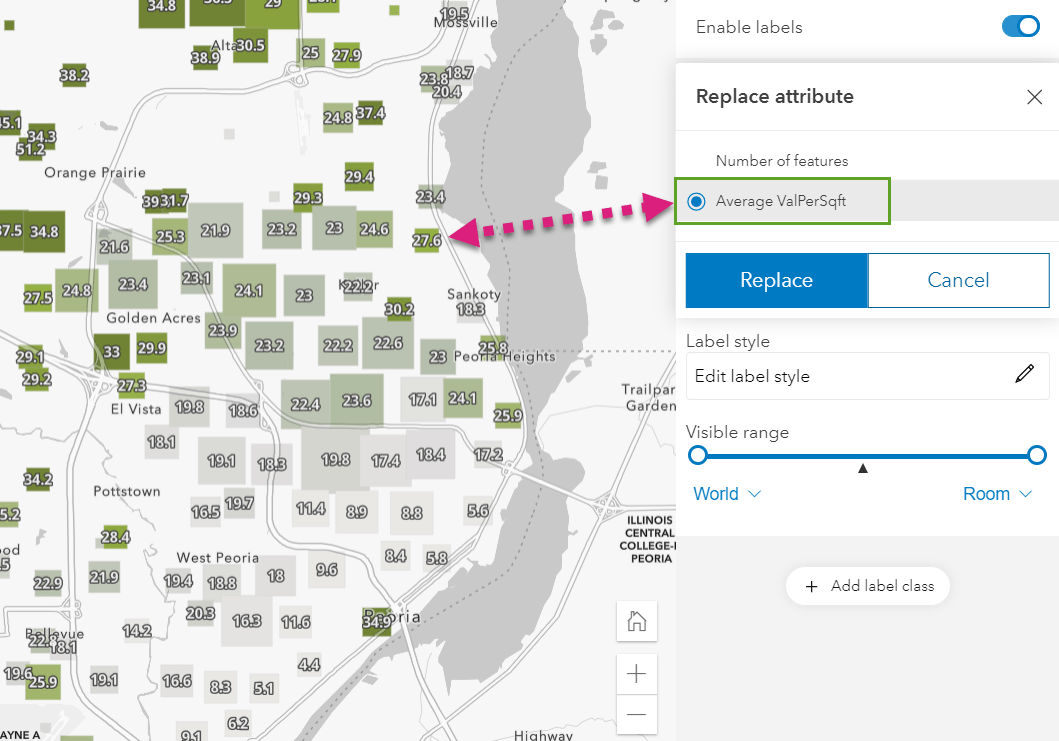
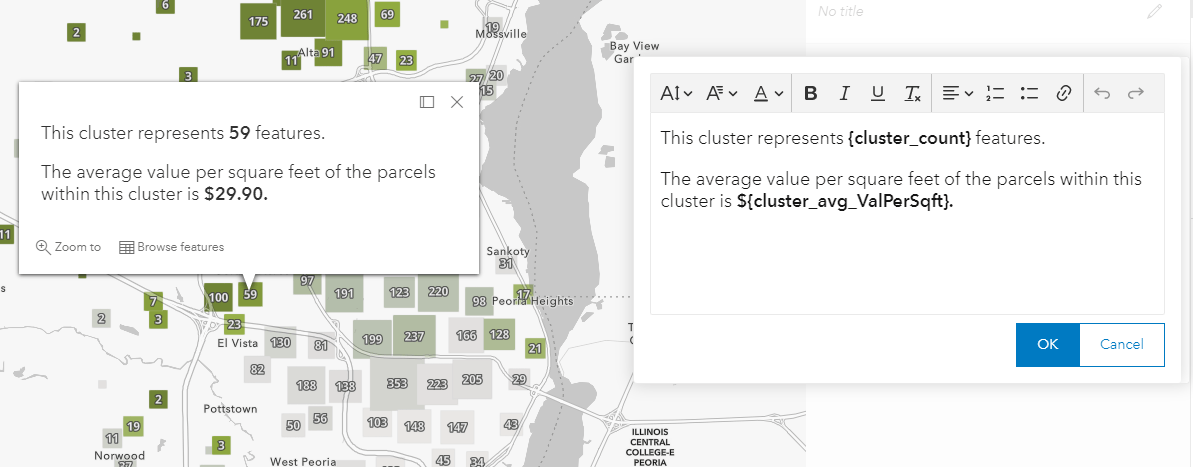
If your map is showing a numeric attribute, you can also adjust the label attribute to show the average value of the points being clustered. For example, the map shows parcels by their value per square feet. Instead of showing the count of features in the cluster, the label shows the average value per sq ft of the points within that cluster.
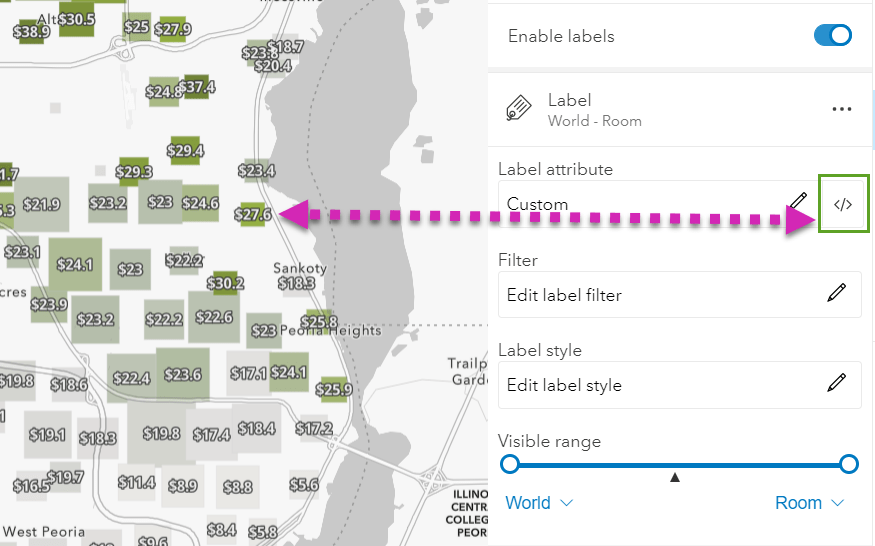
You can also customize your label with Arcade. For example, the map above could benefit from a dollar sign being added to the label.
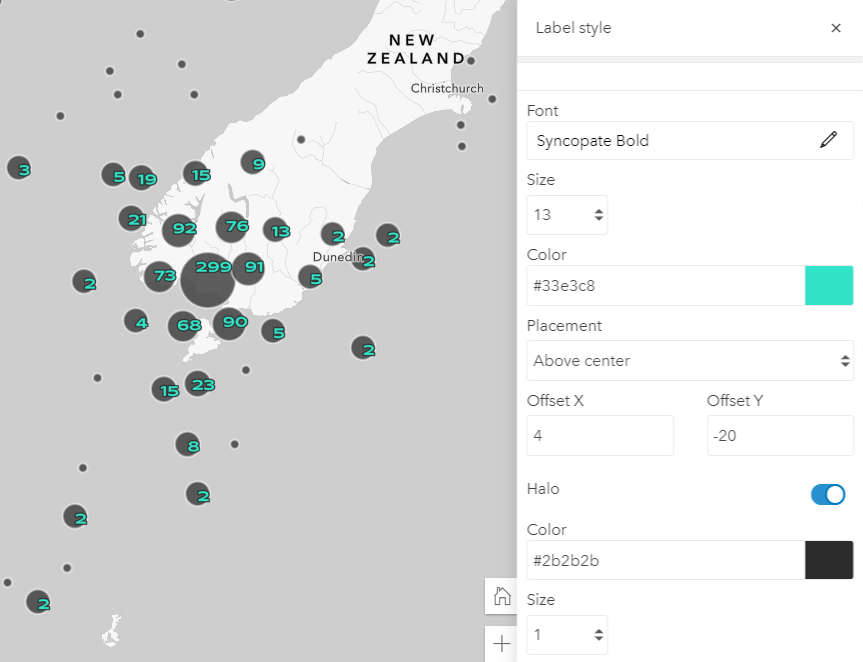
Style your cluster labels
Easily adjust the font, size, placement, offset, and halo of your labels to give them a custom look and feel.
Additional clustering options
Do more with your clusters by going beyond the default settings. Everyone’s data is different, so these options allow you to make adjustments that work for your map.
Control cluster size and radius
You can now make adjustments to the minimum and maximum size of your clusters. This customization can help your map look its best, while still showing a clear pattern. Slide the bar on the left to adjust the smallest clusters, or the bar on the right to adjust the largest circles.
Customize your cluster pop-up
When you turn on clustering, you will get a default pop-up that communicates the number of features in the cluster and a summary of the points within the cluster based on the attribute being mapped. You now have the option to customize your cluster pop-up within Map Viewer.
Consider the map from earlier that showed the average value of parcels in Peoria County. If I want to communicate the average value of the parcels in each cluster, I can change the pop-up to include a dollar sign and customized text.
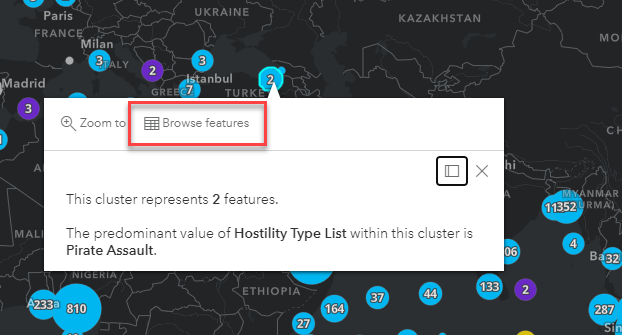
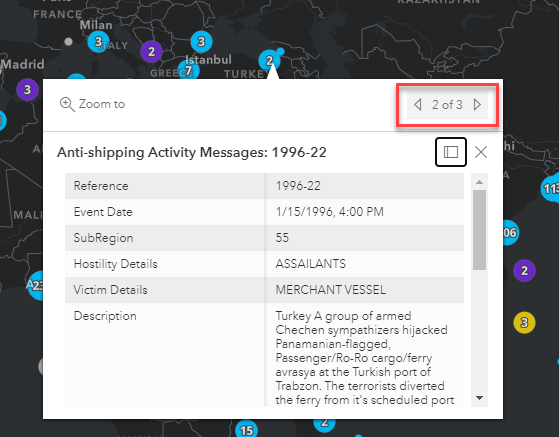
Access the features within a cluster
Within a cluster pop-up, you can choose to zoom into the features within that cluster or browse the specific features within a cluster in order to learn more.
These are just a few examples of how to cluster your points and customize your clustered maps in Map Viewer. Try out the new enhancements for yourself, let us know your feedback on the ArcGIS Online Map Veiwer GeoNet page.
Questions?
Just starting with Map Viewer? Check out this quick-start tutorial.
Check out the road map for Map Viewer to see what’s coming next.
Let us know your questions and comments on GeoNet.


I see with the labels and pop-ups you are able to show averages for the cluster. How would you go about showing the sum of values in a cluster?
Hi Austin. Great question! This is not currently an option for clustering, but will soon be possible in a future release of ArcGIS Online. With just a few lines of Arcade, you can obtain values such as the sum.
It would be good to share those Arcade lines with the community, thanks
Hi. I am regularly asked if the colour can vary with the size of the cluster too. ie As the circle gets bigger it also gets more red. Is this possible?
I can see you have sizes of different colours and seemingly on a scale, but can’t see where you did it
Hi, Is there any solutions if I want to use cluster for map service that publish through Database View?