Here is an animated map of wind speeds. It stacks up six months of global average wind speed and direction, and uses the flow renderer. The cumulative result is a sort of silky living web.
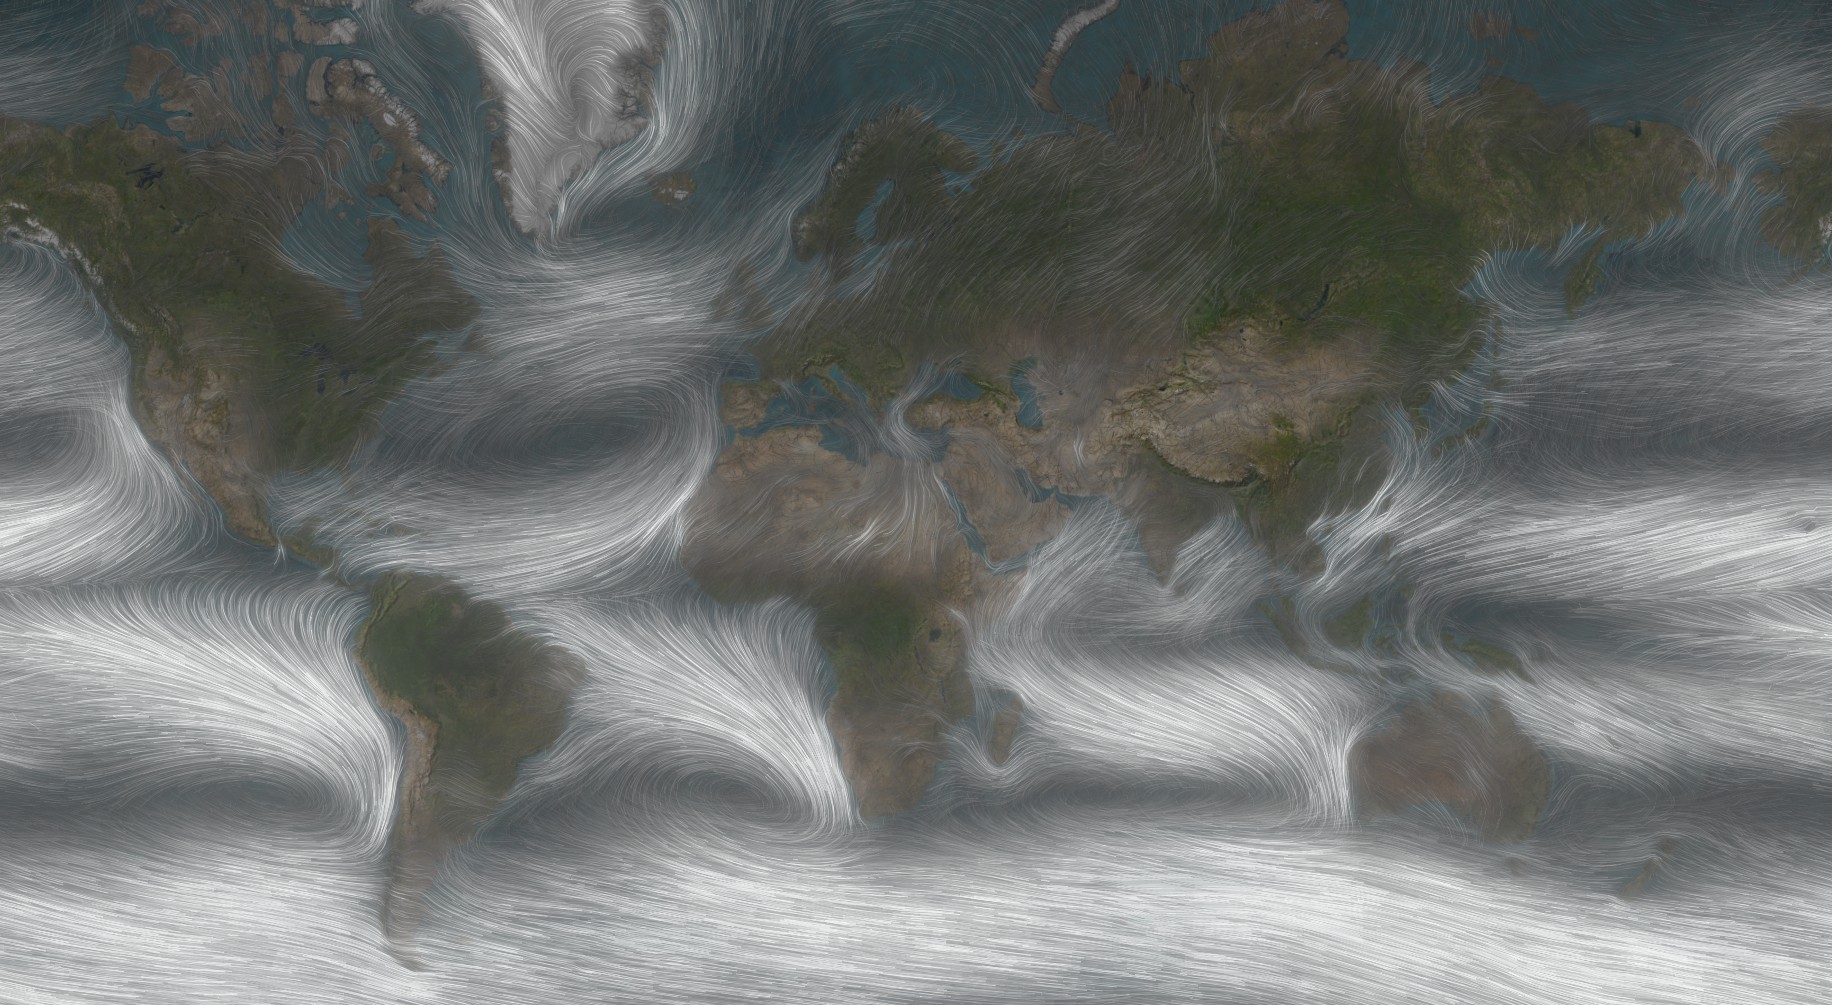
You can click on the link above and reverse engineer it or you can watch this short how-to that walks through the steps to make it yourself. Or both!
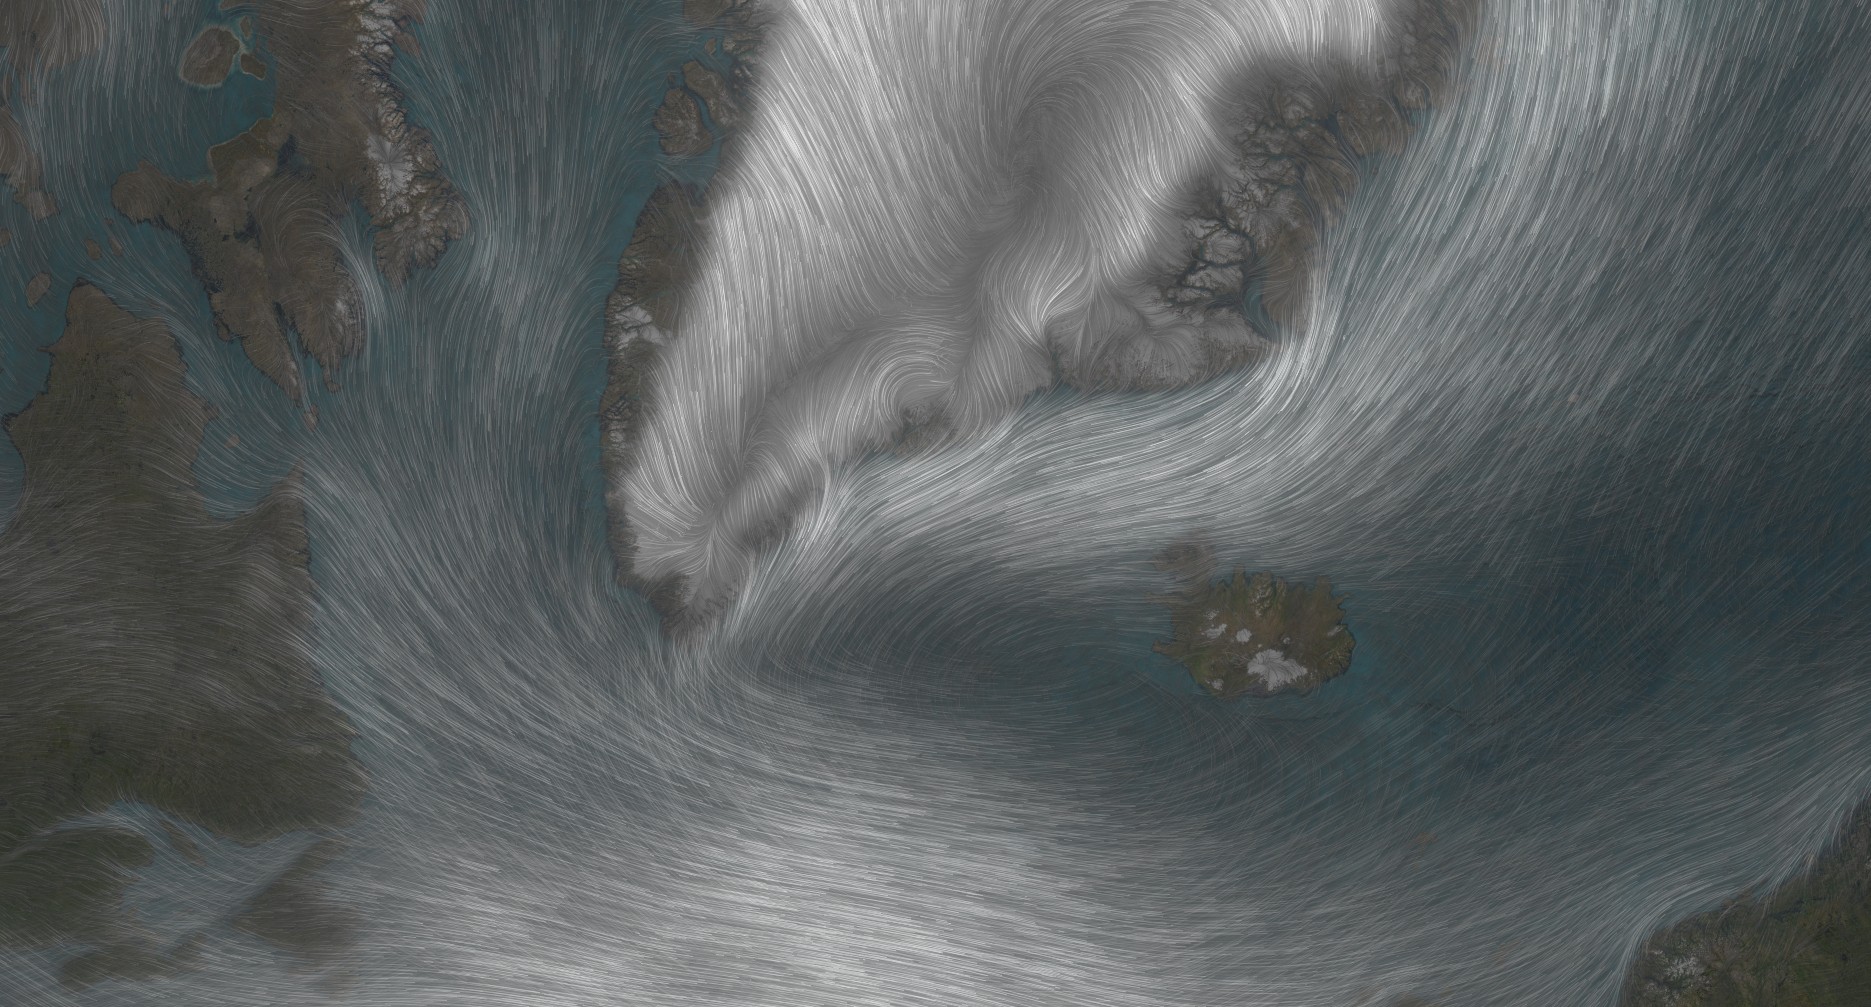
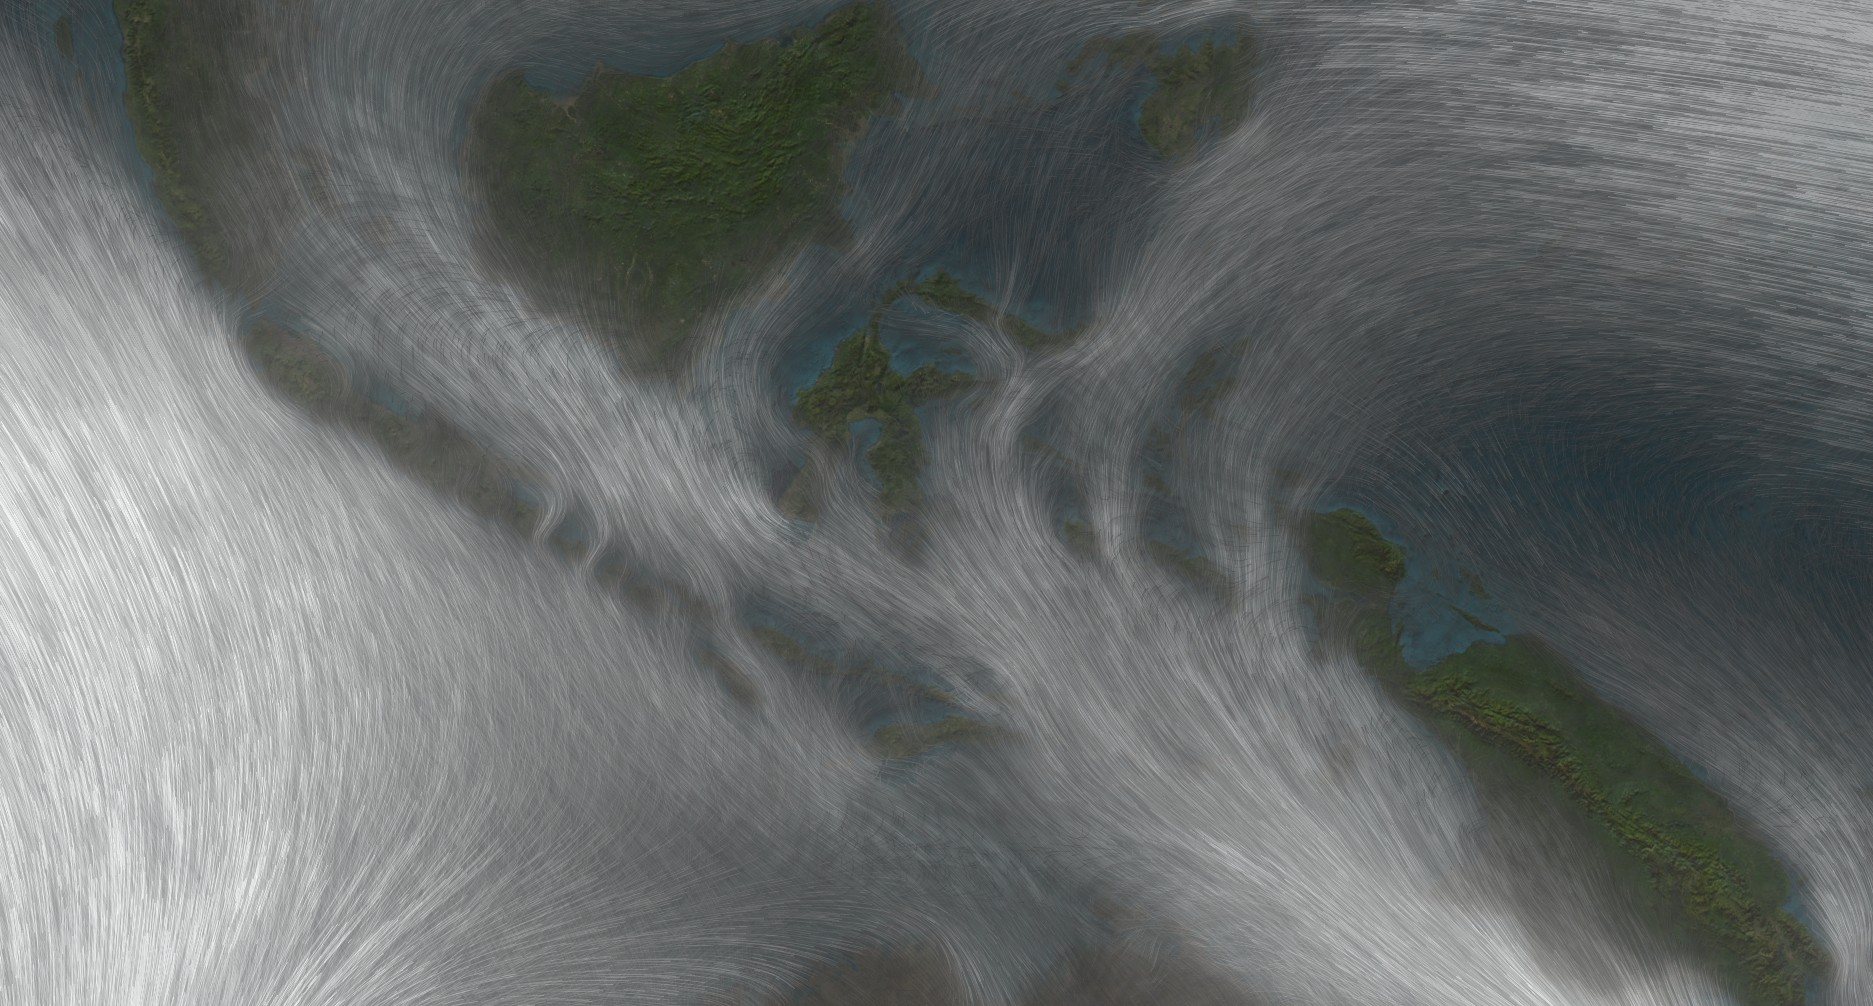
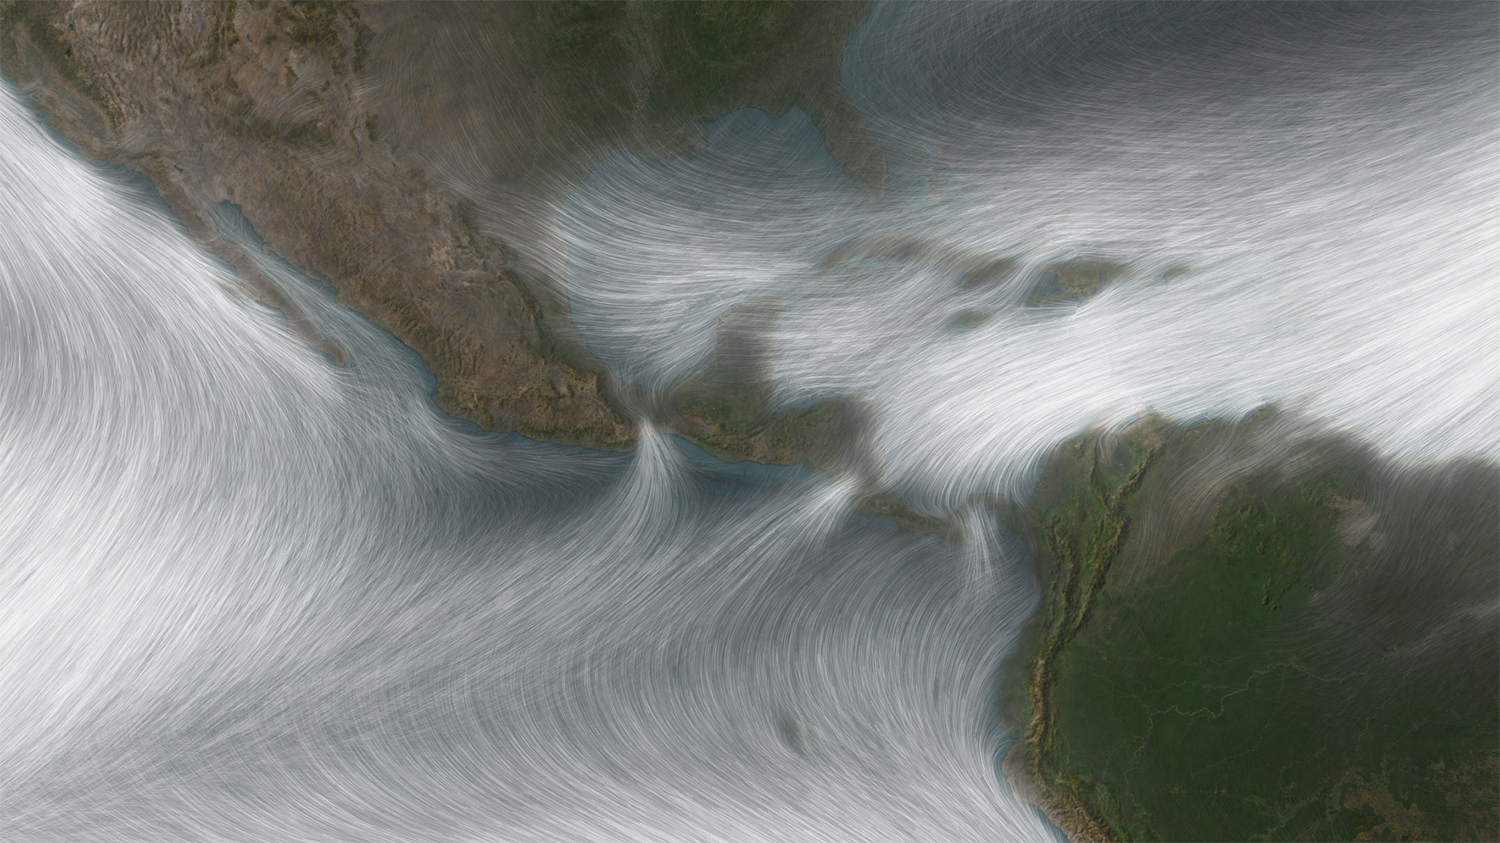
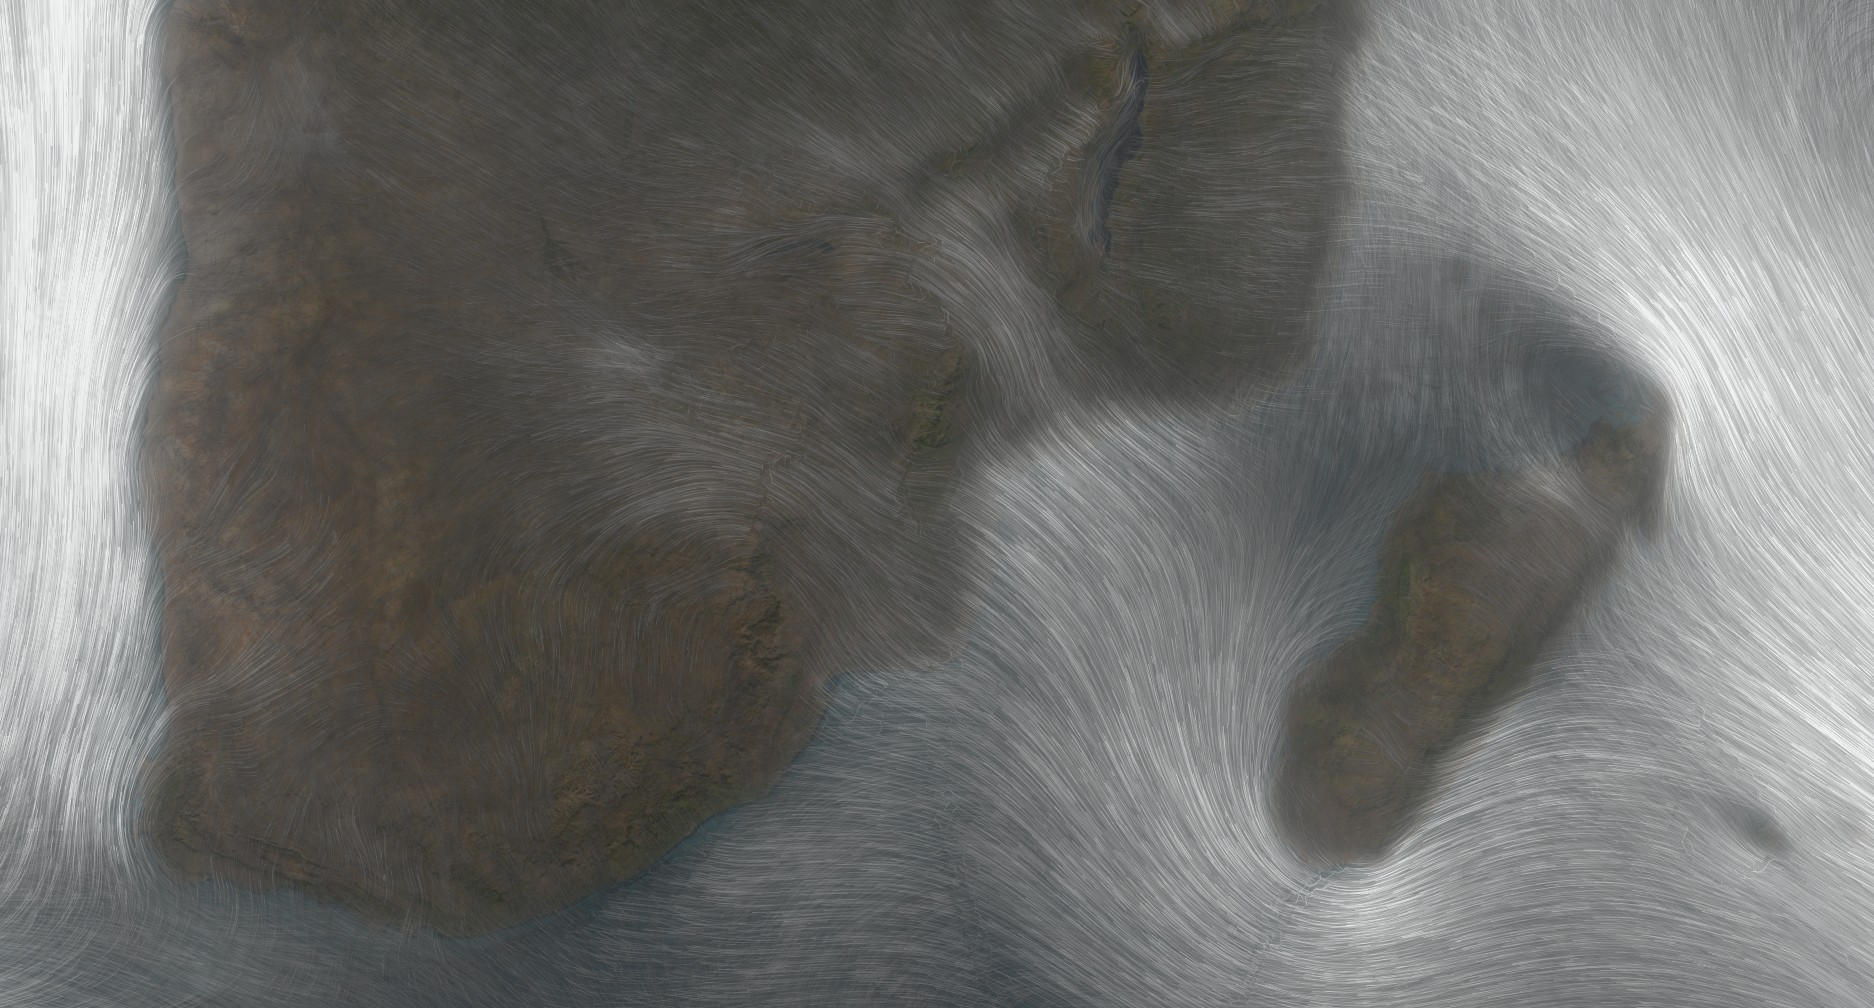
You never know where the next map idea is going to come from. Let me think back on the origins of this particular map. I was asked to export a high res version of this Spilhaus map of ocean currents (which itself was made as a visual reference for museum curators) for a book cover. Which I did (and here’s how you too can export insanely huge images from a browser). But then I was curious (and procrastinating some other things that had priority over my time), what if I swapped out the ocean currents layer for a wind speed layer? What does it look like with an imagery basemap? Say, what would happen if I just stacked up versions of the wind layer, each with different parameters. Might it look cool? We don’t know until we try! That’s the fun of mapping. Such amazing tools and techniques and data right at our fingertips. But the most important ingredient is curiosity. The second most important ingredient is allowing time for experimentation and play.
Happy mapping! John


Article Discussion: