Dot density is now available in ArcGIS Online’s Map Viewer. This mapping style makes your data and story more personal by representing a count of something or someone with an individual dot. Common topics that work well with dot density include Census data, vital statistics, incidents and accidents, crime, and product sales. The dot density style works well in any situation where multiple counts or totals are in your data and when they share a common unit such as people, houses, incident reports, arrests, total dollars, etc.
Humanize your map
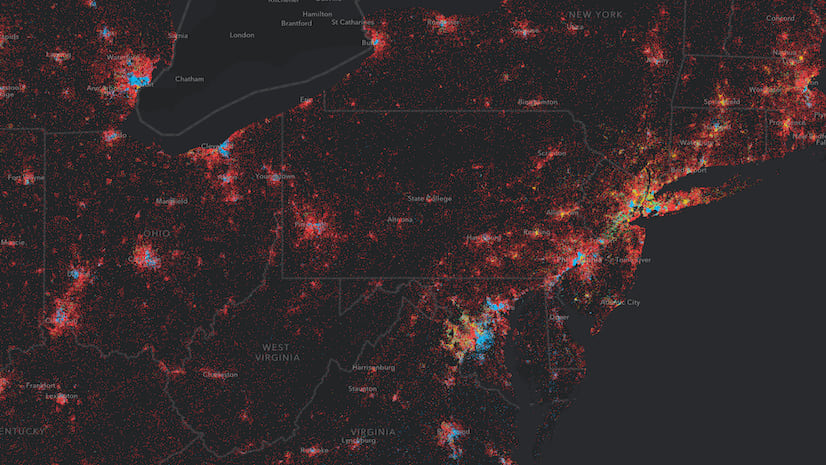
The map on the left shows which areas have more unsheltered versus sheltered homeless people in Los Angeles, California. It paints the entire area with a solid color which can make the map more abstract and remove the focus from the individual person. However, the dot density map on the right represents one homeless person with a single point which instantly makes the map more relatable. The map’s story is more personal and reveals detailed patterns and concentrations of homeless people in downtown Los Angeles and south of Santa Monica.

Immediate feedback
Slide the dot value to explore various dot density strengths and immediately view the changes on the map. Then, click the dot value and input a rounded number to make the map easier to understand. The dot density legend automatically updates.

Meaningful dot density legends
Create meaningful legends by editing the text for each category and adding a statement that reveals what each dot represents. In this case 1 dot represents 1 homeless person. To ensure effective visualization and dot strength at every zoom level, the dot value automatically varies by scale.

Dots that shine
Change the background symbol to view the area outlines such as country, state, and Census tract boundaries. To make the dots shine, minimize distracting outlines by adding transparency or not showing them at all.

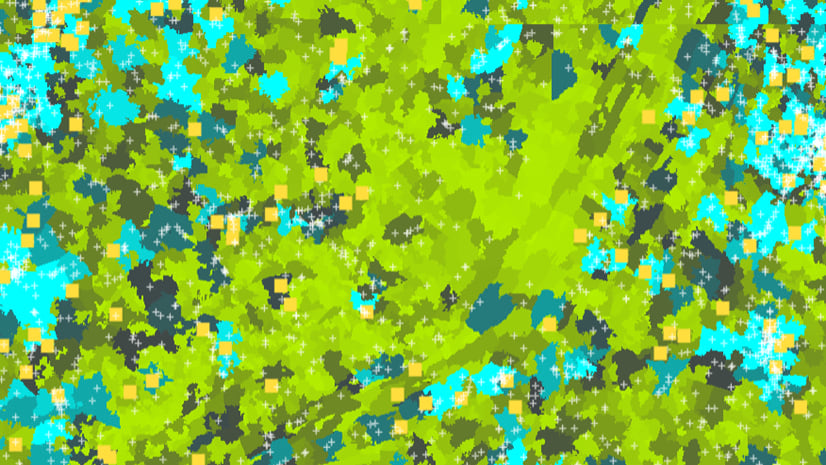
Blend colors
Sometimes a location will contain a mix of categories. In this case, blending comes into play to reveal that more than one category is present in an area . For example, in downtown Los Angeles, there are many unsheltered and sheltered homeless people. The blend option combines the red (unsheltered) and the blue (sheltered) to make purple (a combination of the two). Every dot density color ramp was designed with blending in mind. For example, blue and yellow combine to make green, and red and yellow combine to make orange.

Try out the new dot density style!
Dot density works well with polygon data that contain count attributes. Use this style to visualize the distribution of one attribute or compare multiple attributes. Make your maps more personal and highlight patterns with the new dot density style in Map Viewer.
Make sure to join the Map Viewer GeoNet community for discussion, updates, and blogs.

With this new function, can you change the size of the dots that are displayed? I tried to use dot density for displaying population counts by race in my AGO map. The dots are so small. It would be great to modify that parameter.
Hi Gabrielle, not at the moment. To learn more about changing the dot size, please check out the thread on the Esri Community. If you like, you can give the idea a comment and/or a Kudo of support to help prioritize the request.
Would it be possible to point me to the community thread?
https://community.esri.com/t5/map-viewer-beta-ques-read-only/dot-density-dot-size-in-map-viewer-beta/m-p/334872#M365