Is the last airport hotel you stayed in louder than the hotel you stayed at the time before? How does your current neighborhood compare to other places you lived? Is it noisier?
Now there’s a map for that. The US Department of Transportation (DOT) has compiled a noise model layer from civilian airports and road transportation for 2018, and it’s already being used in the Living Atlas of the World to compare places in the lower 48 states.

This layer combines two noise models at DOT, the aviation model and the roads model. It’s important to note that this layer does not include military bases, passenger rail, or freight rail for now. But in the future, noise layers will include some or all of these things. The current layer is still a significant step toward more rational planning decisions using the Living Atlas, as many decisions are well supported from models of ordinary road transportation and civilian aircraft noise.
Of course, nobody went to every part of the Conterminous USA and measured the sound level with a sensor. This layer is a model built upon understanding about how noise is produced by transportation and is carried across the landscape. For this layer the sound model measures the 24-hr equivalent sound level in dBA LAeq. What does this value mean?
dB – Decibels measure the frequency and amplitude of sound energy waves.
dBA – Adjusted decibel measurements that also consider different sound frequencies and the varying sensitivity of the human ear.
LAeq – Equivalent continuous sound that contains the same sound energy as a sound that varies over time.
The following graphic puts these very abstract dBA LAeq values on the map in more human terms:

Naturally we find art within the noise
Here are a few cities that we found noise arrangements that were just so beautiful, interesting, and fantastic that we just had to map them out.

Patterns of noise and light
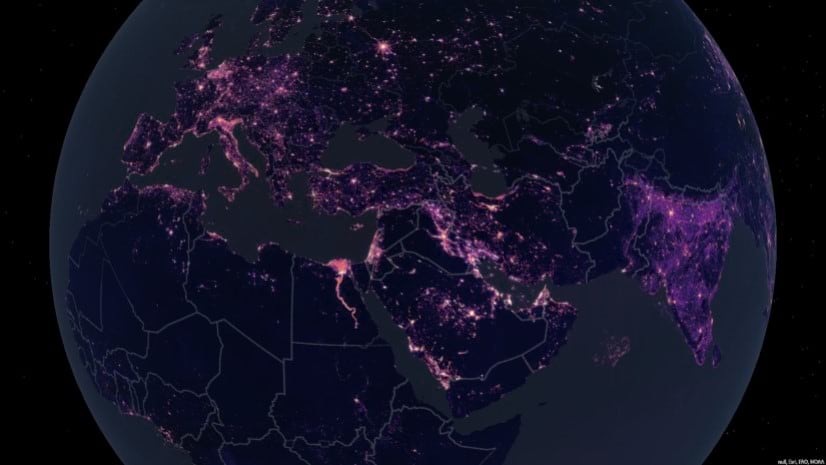
While we were in the process of producing this layer and exploring places all over the country, we became curious about the patterns we were seeing. It reminded us of another recent addition to Living Atlas. The VIIRS Nighttime Lights Monthly Cloud-Free Composite which provides global daily measurements of nocturnal visible and near-infrared light, and is suitable for study and analysis.

Sensory Overload
It is well established that light and noise pollution have profound effects on both humans and wildlife. Since 82% of the USA lives in urban areas, we wanted to figure out what cities are the noisiest and what are the quietest? What cities are the brightest at night, and what are the darkest?

First, we selected all the cities and census designated places from the Living Atlas in the lower 48 states that had a population greater than 50,000.
Census boundaries sometimes extend into an ocean or bay, and we found out we didn’t want to include ocean areas when we averaged light or noise. To name one example, did you know when New York Harbor is included, New York City becomes a quieter place, on average?
Using spatial analyst and the detailed US states layer in the Living Atlas, we analyzed only land areas within each city. Then we used the zonal statistics as table geoprocessing tool to link the mean noise and light pollution back to the layer with each city’s geographic record identifier, or GEOID. The results are within this webmap and the Nosiest, Quietest, Brightest, Darkest, Nosiest & Brightest, and Quietest & Darkest cities are described in more detail below.

After this analysis, the noisiest city that we found was:
#1 Noisiest – Elizabeth, New Jersey
Elizabeth, New Jersey is the noisiest city we found, but it’s also the seventh brightest. This gave it a combined rank of 8. The brightest part of Elizabeth is the Port Newark–Elizabeth Marine Terminal. This is in fact the main container port serving the New York Metropolitan Area, and the busiest port in the Eastern United States.

#2 Noisiest – Inglewood, California
Just before large aircraft land at Los Angeles International Airport, the aircraft fly at low altitude over Inglewood, California. There are actually two parallel runways. The approach for both runways guides large aircraft right over the center and the south parts of the city just before the aircraft touch down. The 405 freeway also skirts the western edge of the city.

#3 Noisiest – Grapevine, Texas
Dallas Fort Worth International Airport is one of the busiest in the United States. Almost half of Grapevine, Texas is in fact airport property. Grapevine Lake makes up 1/10 of the city’s area, which lowers its noise level somewhat.

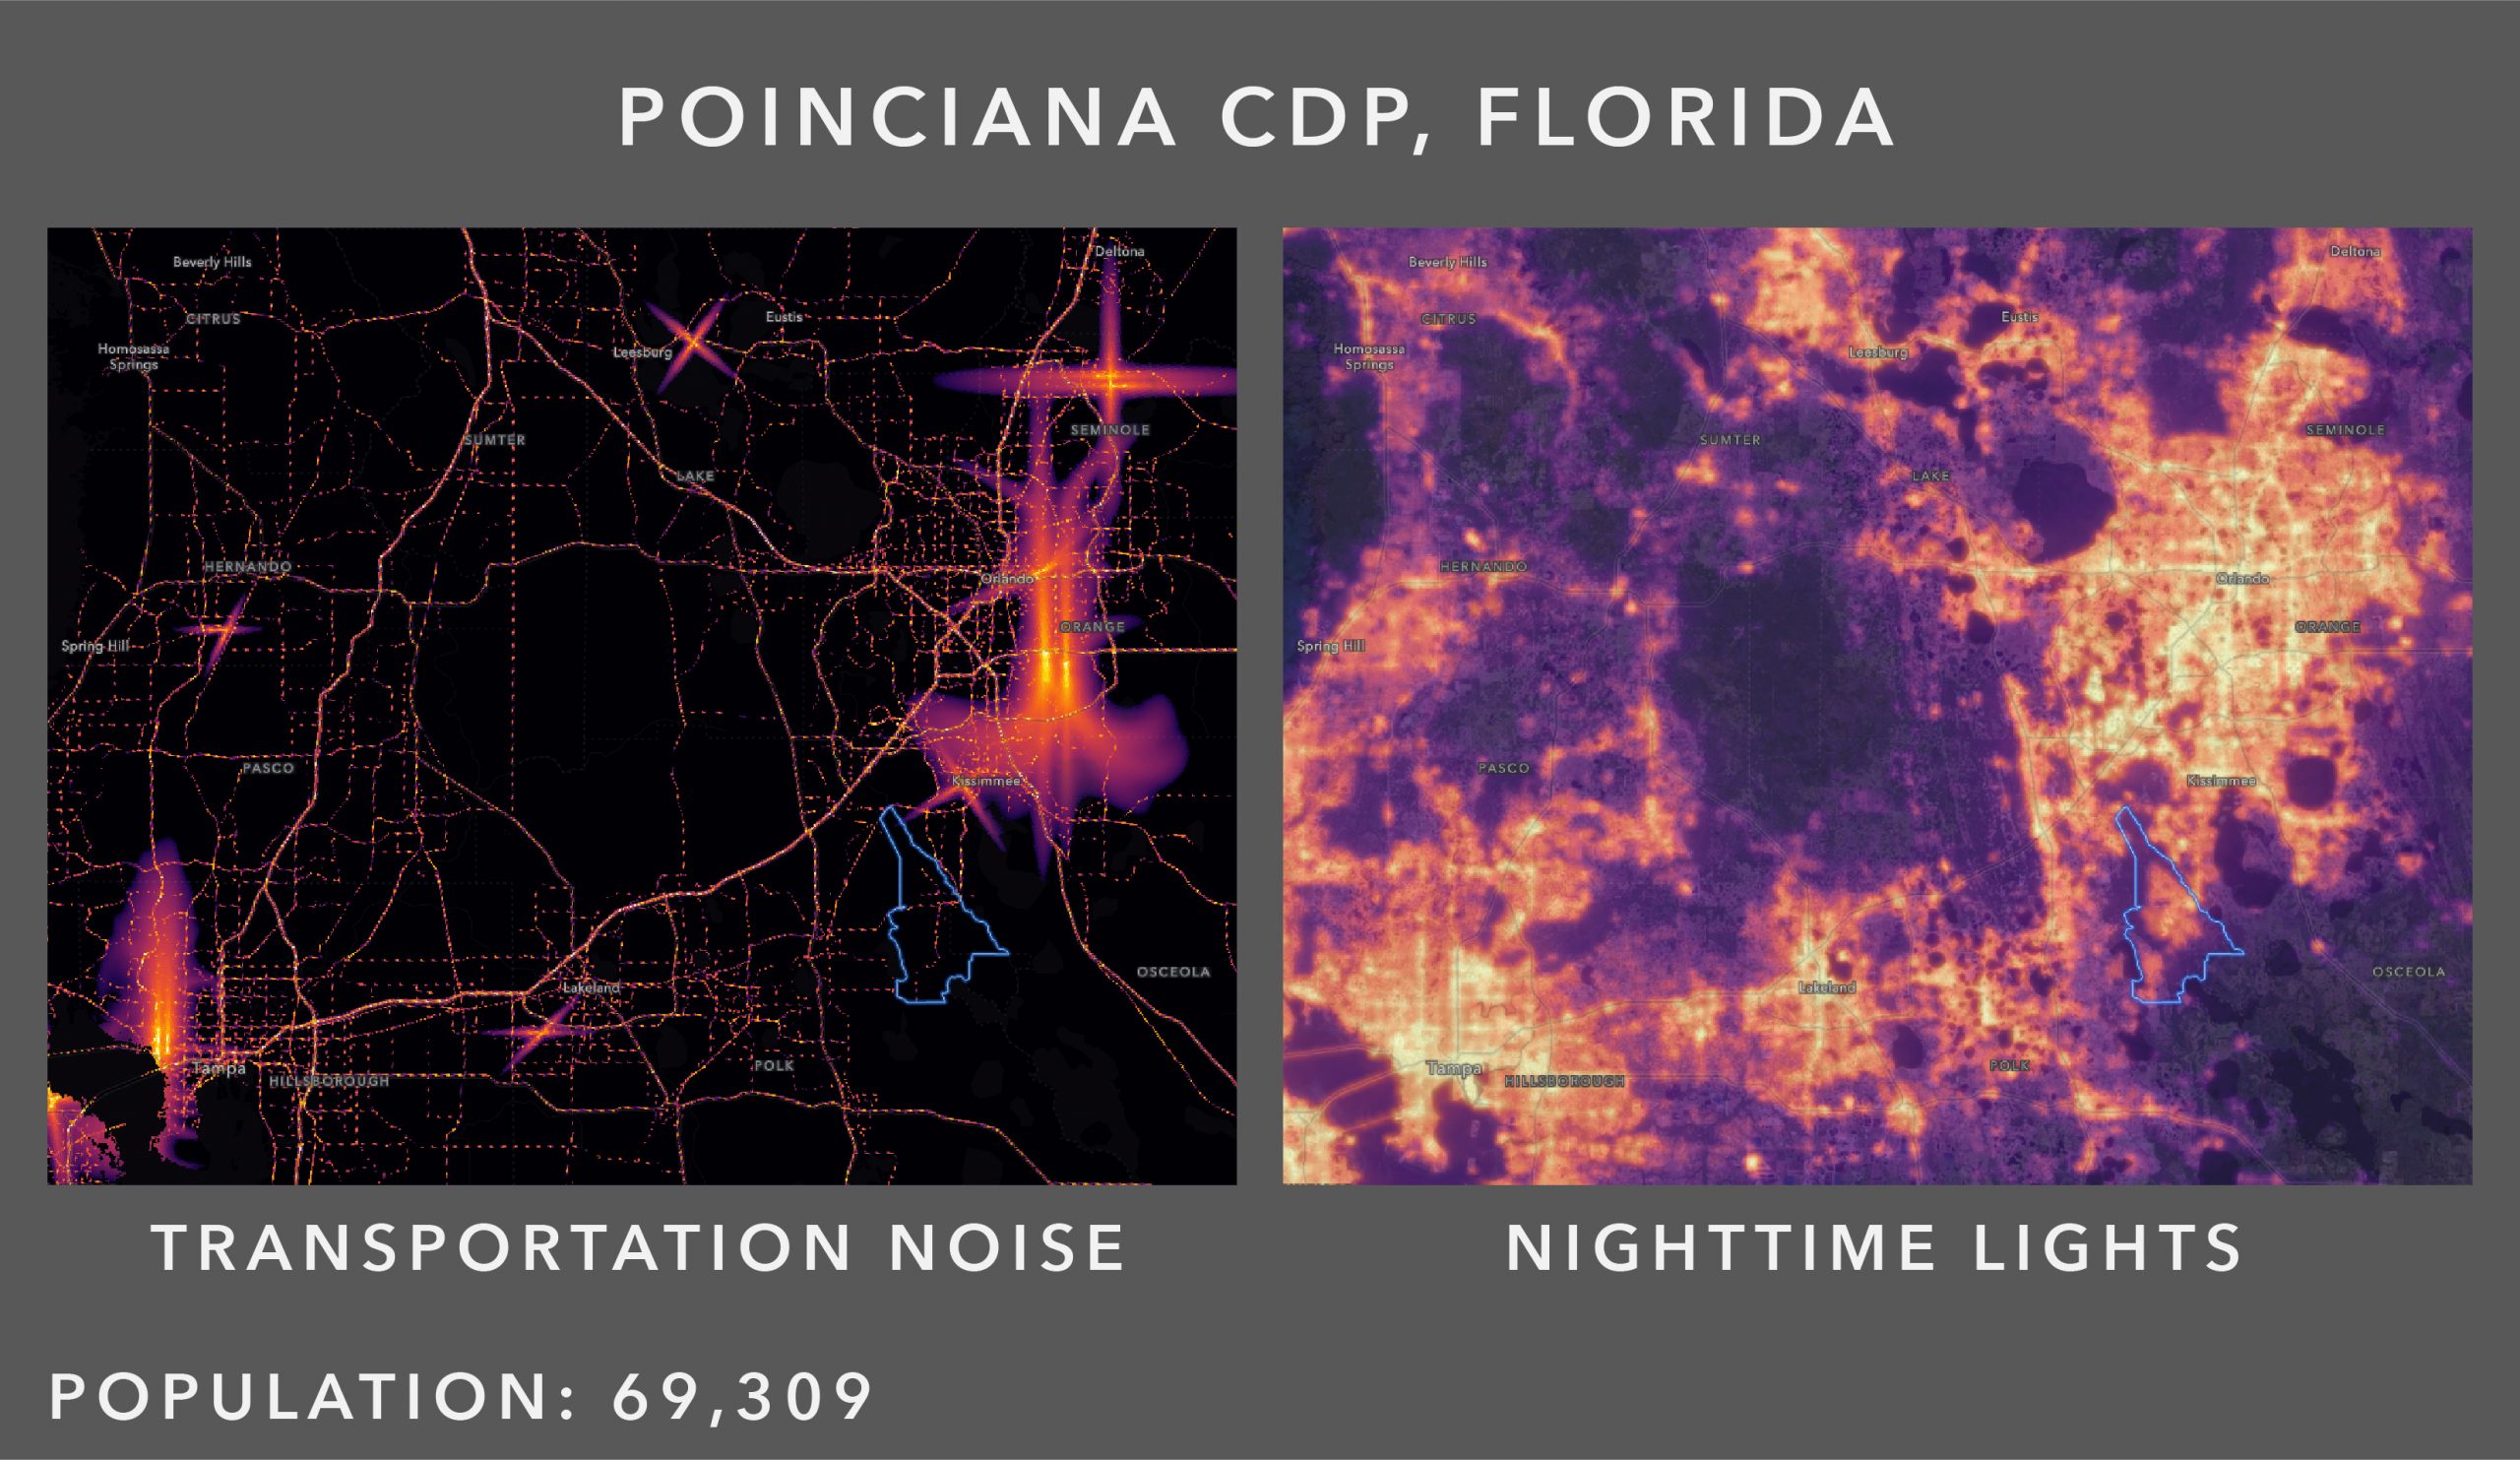
#1 Quietest – Poinciana CDP, Florida
Poinciana is a large area with enough development to push its population above 50k. The census place is quite far from the Orlando International Airport, and the closest Interstate Highway, I-4, is 4 miles away at the closest point. Its many lakes and swampy terrain create barriers to surface travel, so no main roads go through it. It’s not really between any point A and point B, and this keeps traffic noise down.

#2 Quietest – Buckeye, Arizona
Buckeye, Arizona is a very large, unusually shaped city at the western edge of the Phoenix Metropolitan Area. Phoenix Sky Harbor International Airport is far to the city’s east and piecemeal incorporation has limited its exposure to the noise of Interstate 10.

#3 Quietest – Carson City, Nevada
Carson City is a very large incorporated area in Nevada, which merged with its county of Ormsby in the 1960s. A lot of Carson City’s area is forested land and even includes some Tahoe lakeshore.

The brightest cities we found:
#1 Brightest city at night – Union City, New Jersey
Union City is a small city in area in urban New Jersey. Unlike Bayonne or Jersey City, none of its land area is in the meadowlands/estuary. Much of the city’s small footprint is in well-illuminated dense urban areas.

#2 Brightest city at night – Paradise CDP, Nevada
Paradise CDP includes the very bright lights of Las Vegas Strip south of Desert Inn Boulevard. Casinos, shopping centers, and Harry Reid International Airport light the area all night.

#3 Brightest city at night – Cicero, Illinois
Cicero is only slightly brighter than Chicago overall, probably because it is smaller and more evenly lit. It is much brighter than cities in exurban Chicago like Elgin or Joliet.

#1 Darkest city at night – Buckeye, Arizona
Much of the City of Buckeye is undeveloped and unilluminated. Buckeye is very large and has expanded across the Sonoran Desert west of Phoenix.

#2 Darkest city at night – Suffolk, Virginia
Independent cities in Virginia can have very large areas. The City of Suffolk, Virginia is the largest independent city in the state. Suffolk has an urban portion but a lot of the city area is dark. Some of Suffolk is part of the Great Dismal Swamp National Wildlife Refuge.

#2 Darkest city at night – Marana, Arizona
Like Buckeye, Marana is a large city in area without much development (yet). Northwest of Tucson, it is a large area of Arizona with some houses and street lighting, but its boundary line has extended well beyond its populated area.

The Noisiest/Brightest and the Quietest/Darkest
To find the cities with the most/least sensory overload, we simply added the ranking of their noise and light together to make a combined score.
#1 Noisiest/Brightest – Elizabeth, New Jersey
Elizabeth, New Jersey is the noisiest city we found, but it’s also the seventh brightest. This gave it a combined rank of 8.

#2 Noisiest/Brightest – Paradise CDP, Nevada
The bright lights of the Strip highlight this CDP just south of the City of Las Vegas. There are dark parts of this CDP as well but the bright parts are very bright indeed. Home to three freeways and Harry Reid International Airport, it’s also the eighth noisiest place we found.

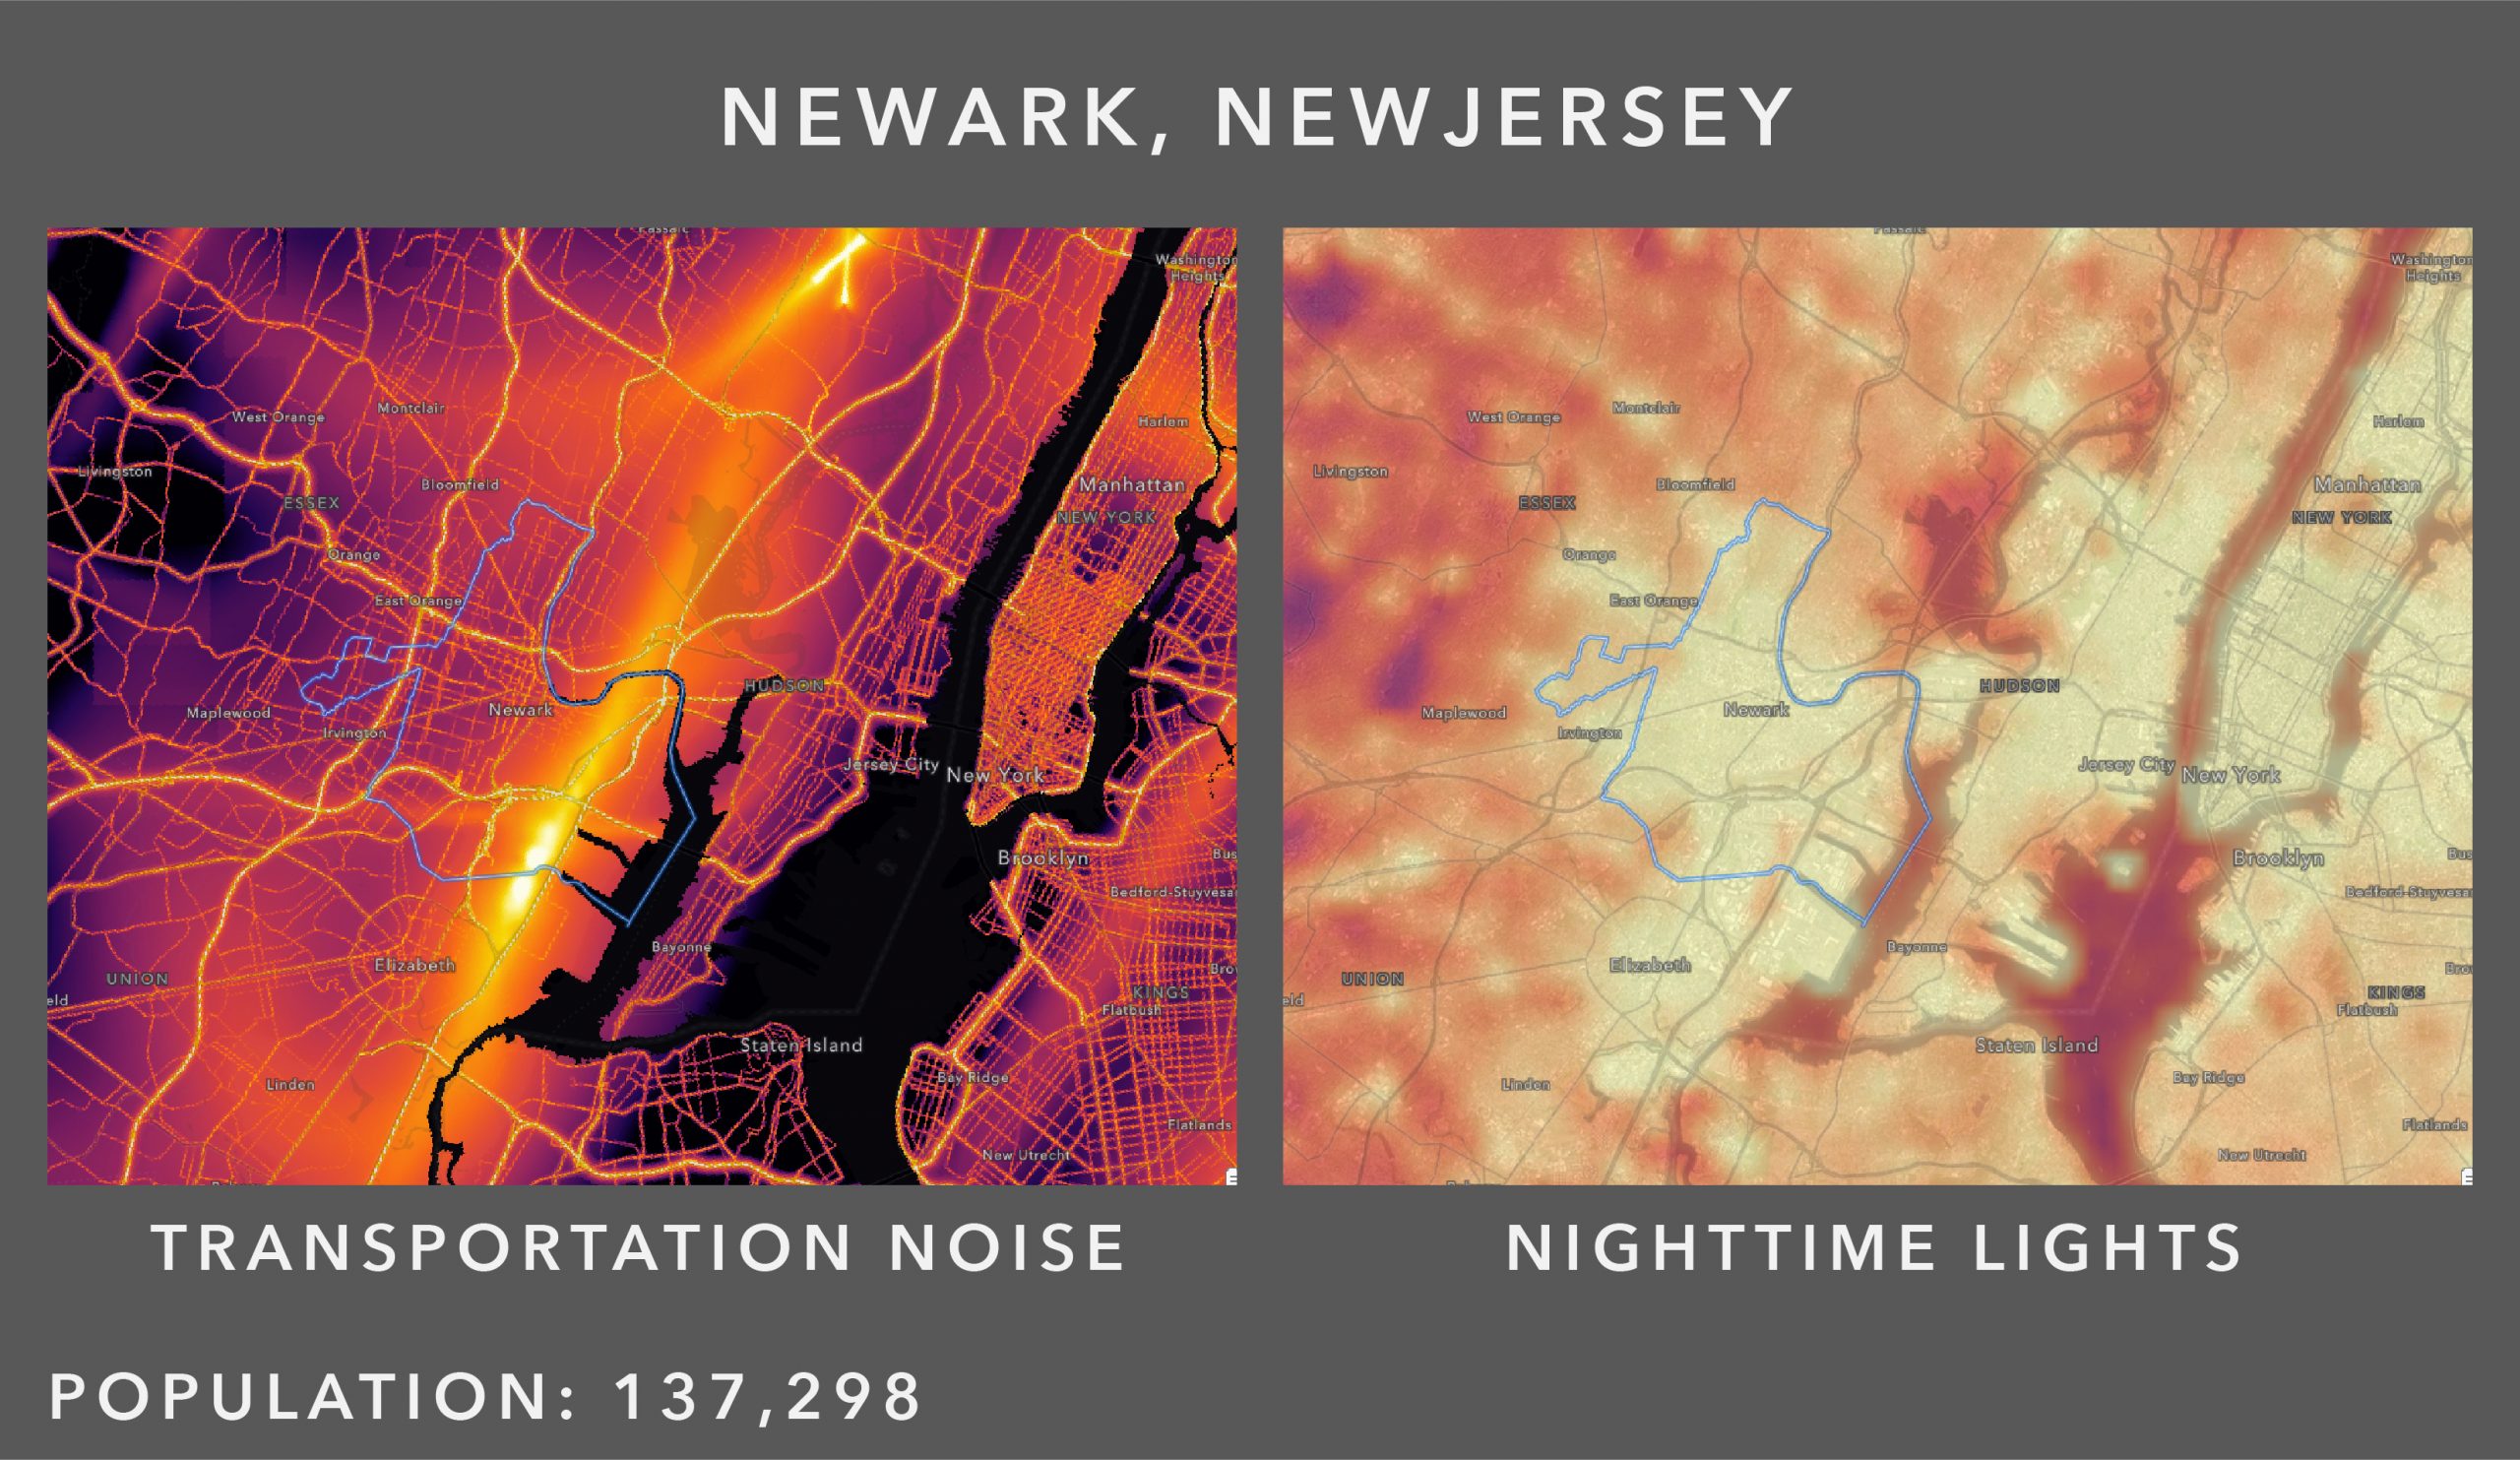
#3 Noisiest/Brightest – Newark, New Jersey
New Jersey’s most populous city is noisy from Newark Liberty International Airport and the highways that run through it. Its nighttime lights make it the ninth brightest place in the list. The northernmost and westernmost parts of the city are a bit dark and keep it out of the very top.
#1 Quietest/Darkest – Buckeye, Arizona
Buckeye’s city limit lines have expanded far ahead of the urban area within its limits. According to Esri 2020 Land Cover of the World, Buckeye is only 6% built up area. Active cropland (8%) even outnumbers the urban area. A lot of Buckeye’s city limits appear to be strategic additions in advance of actual development.

#2 Quietest/Darkest – Poinciana CDP, Florida
Ringed by trees, Poinciana CDP is also home to The Nature Conservancy’s Disney Wilderness Preserve. It’s one of the quietest and darkest major places in the lower 48 states.
#3 Quietest/Darkest – Carson City, Nevada
As mentioned before, the built-up portion of Carson City is small. It’s notable as being the quietest/darkest capital city in the list.

For more information
Want to search around the map yourself? You will find all the layers in this webmap here:

Here’s a few other resources we would like to bring your attention to:
US Department of Transportation Bureau of Transportation Statistics
US Census Bureau layers available in the Living Atlas of the World
Environment layers available in the Living Atlas of the World
Esri Land Cover 2020 in the Living Atlas of the World
Thank you very much. Please feel free to reach out to us with comments or questions.


Article Discussion: