By Aileen Buckley, PhD, Esri Research Cartographer
In 2014, the US Geological Survey (USGS) and Esri collaborated to bring the ever-increasing collection of US historical topographic maps to everyone through the USGS Historical Topographic Map Explorer.
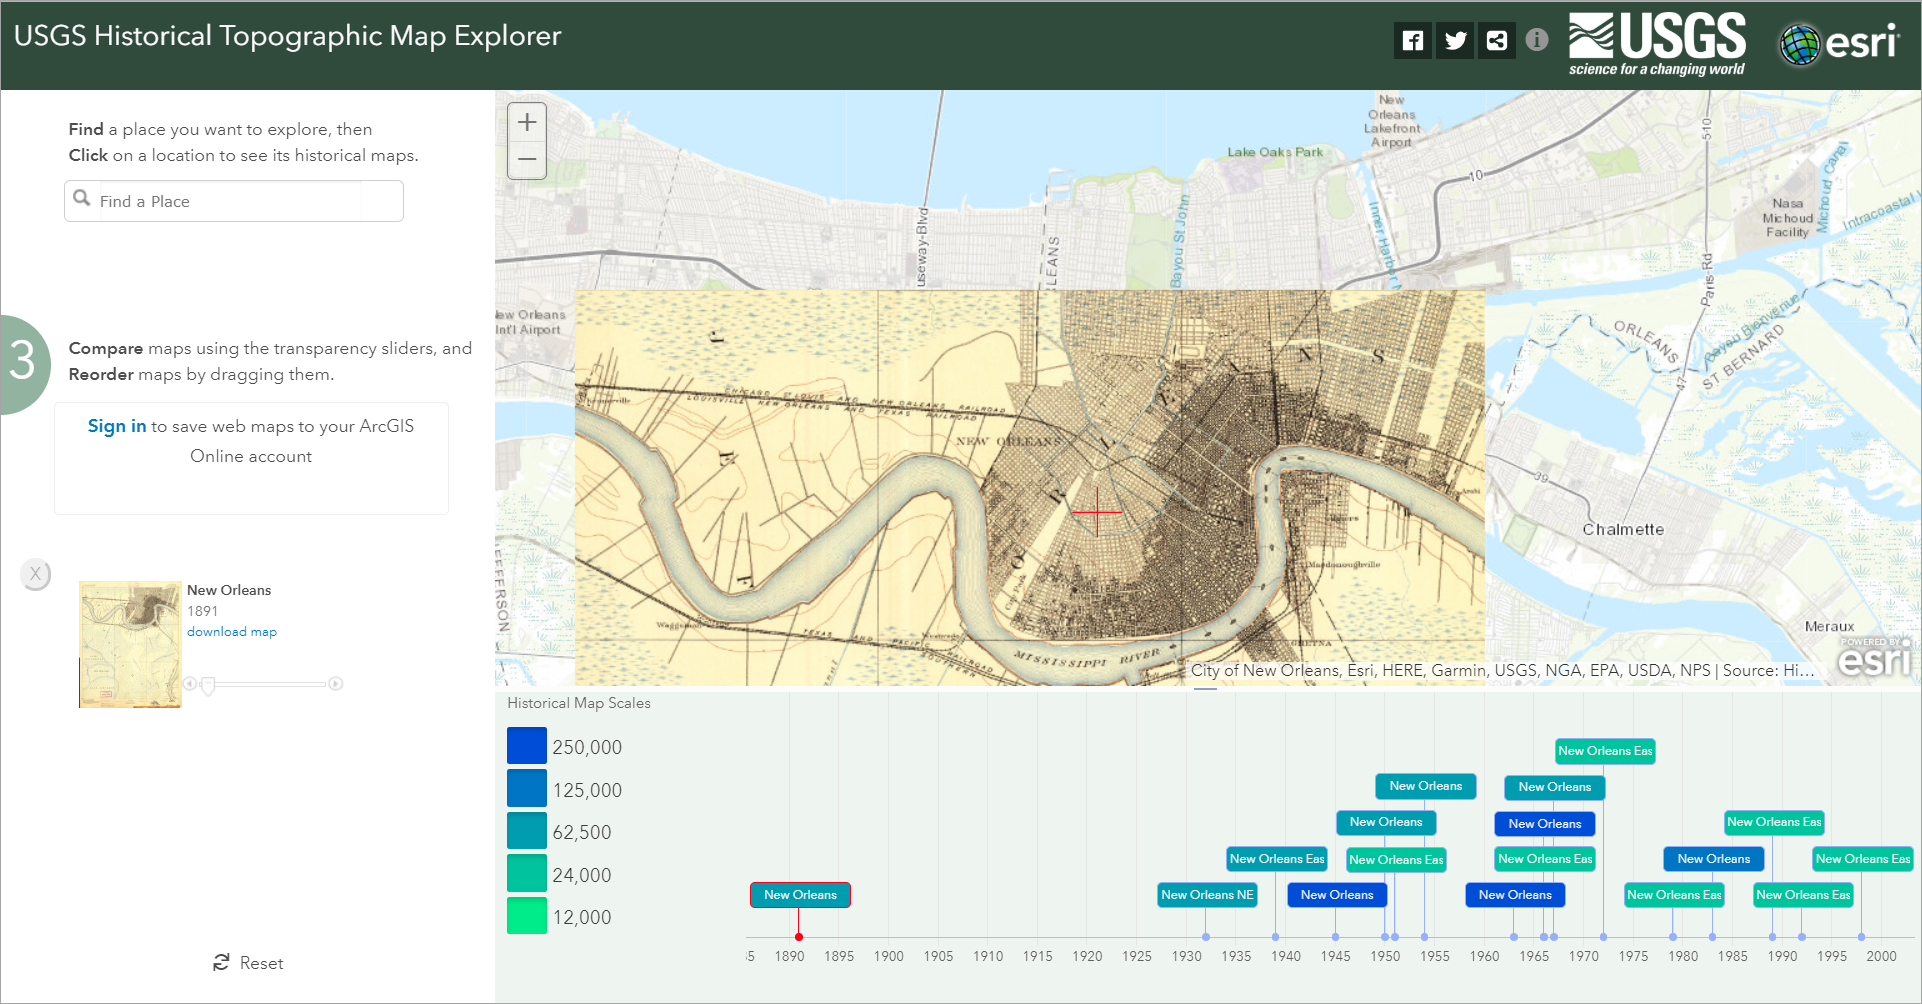
This web application (app) brings to life more than 178,000 maps dating from 1884 to 2006. Previously available only as printed lithographic copies, the legacy quadrangles are now available as web-viewable images and free, downloadable digital files. The USGS Historical Topographic Map Explorer allows users to explore the historical maps and save the current view as a web map to view online or use in ArcGIS Desktop.
A recent ArcWatch tip explains some of the most recent improvements to this app. A previous ArcWatch tip guides users through the three steps for exploring the map collection in the web app, which organizes the maps by space, time, and map scale:
- Find a location of interest.
- View the maps.
- Compare the maps.
In this blog post, you’ll learn how to use the new functionality in the web app to create a web map saved to an ArcGIS Online account then use that web map in ArcGIS Pro to create new data by digitizing features on the historical maps. This workflow involves a two-step process:
- Create a web map from the USGS Historical Topographic Map Explorer app.
- Use the web map to digitize data in ArcGIS Desktop.
Step one. Create the web map from the USGS Historical Topographic Map Explorer app.
The first step is to create the web map and view it in ArcGIS online. For step-by-step instructions, see this ArcWatch tip: Bring Historical Topographic Maps Back to Life in Web Maps.
Step two. Use the web map to create data in ArcGIS Desktop.
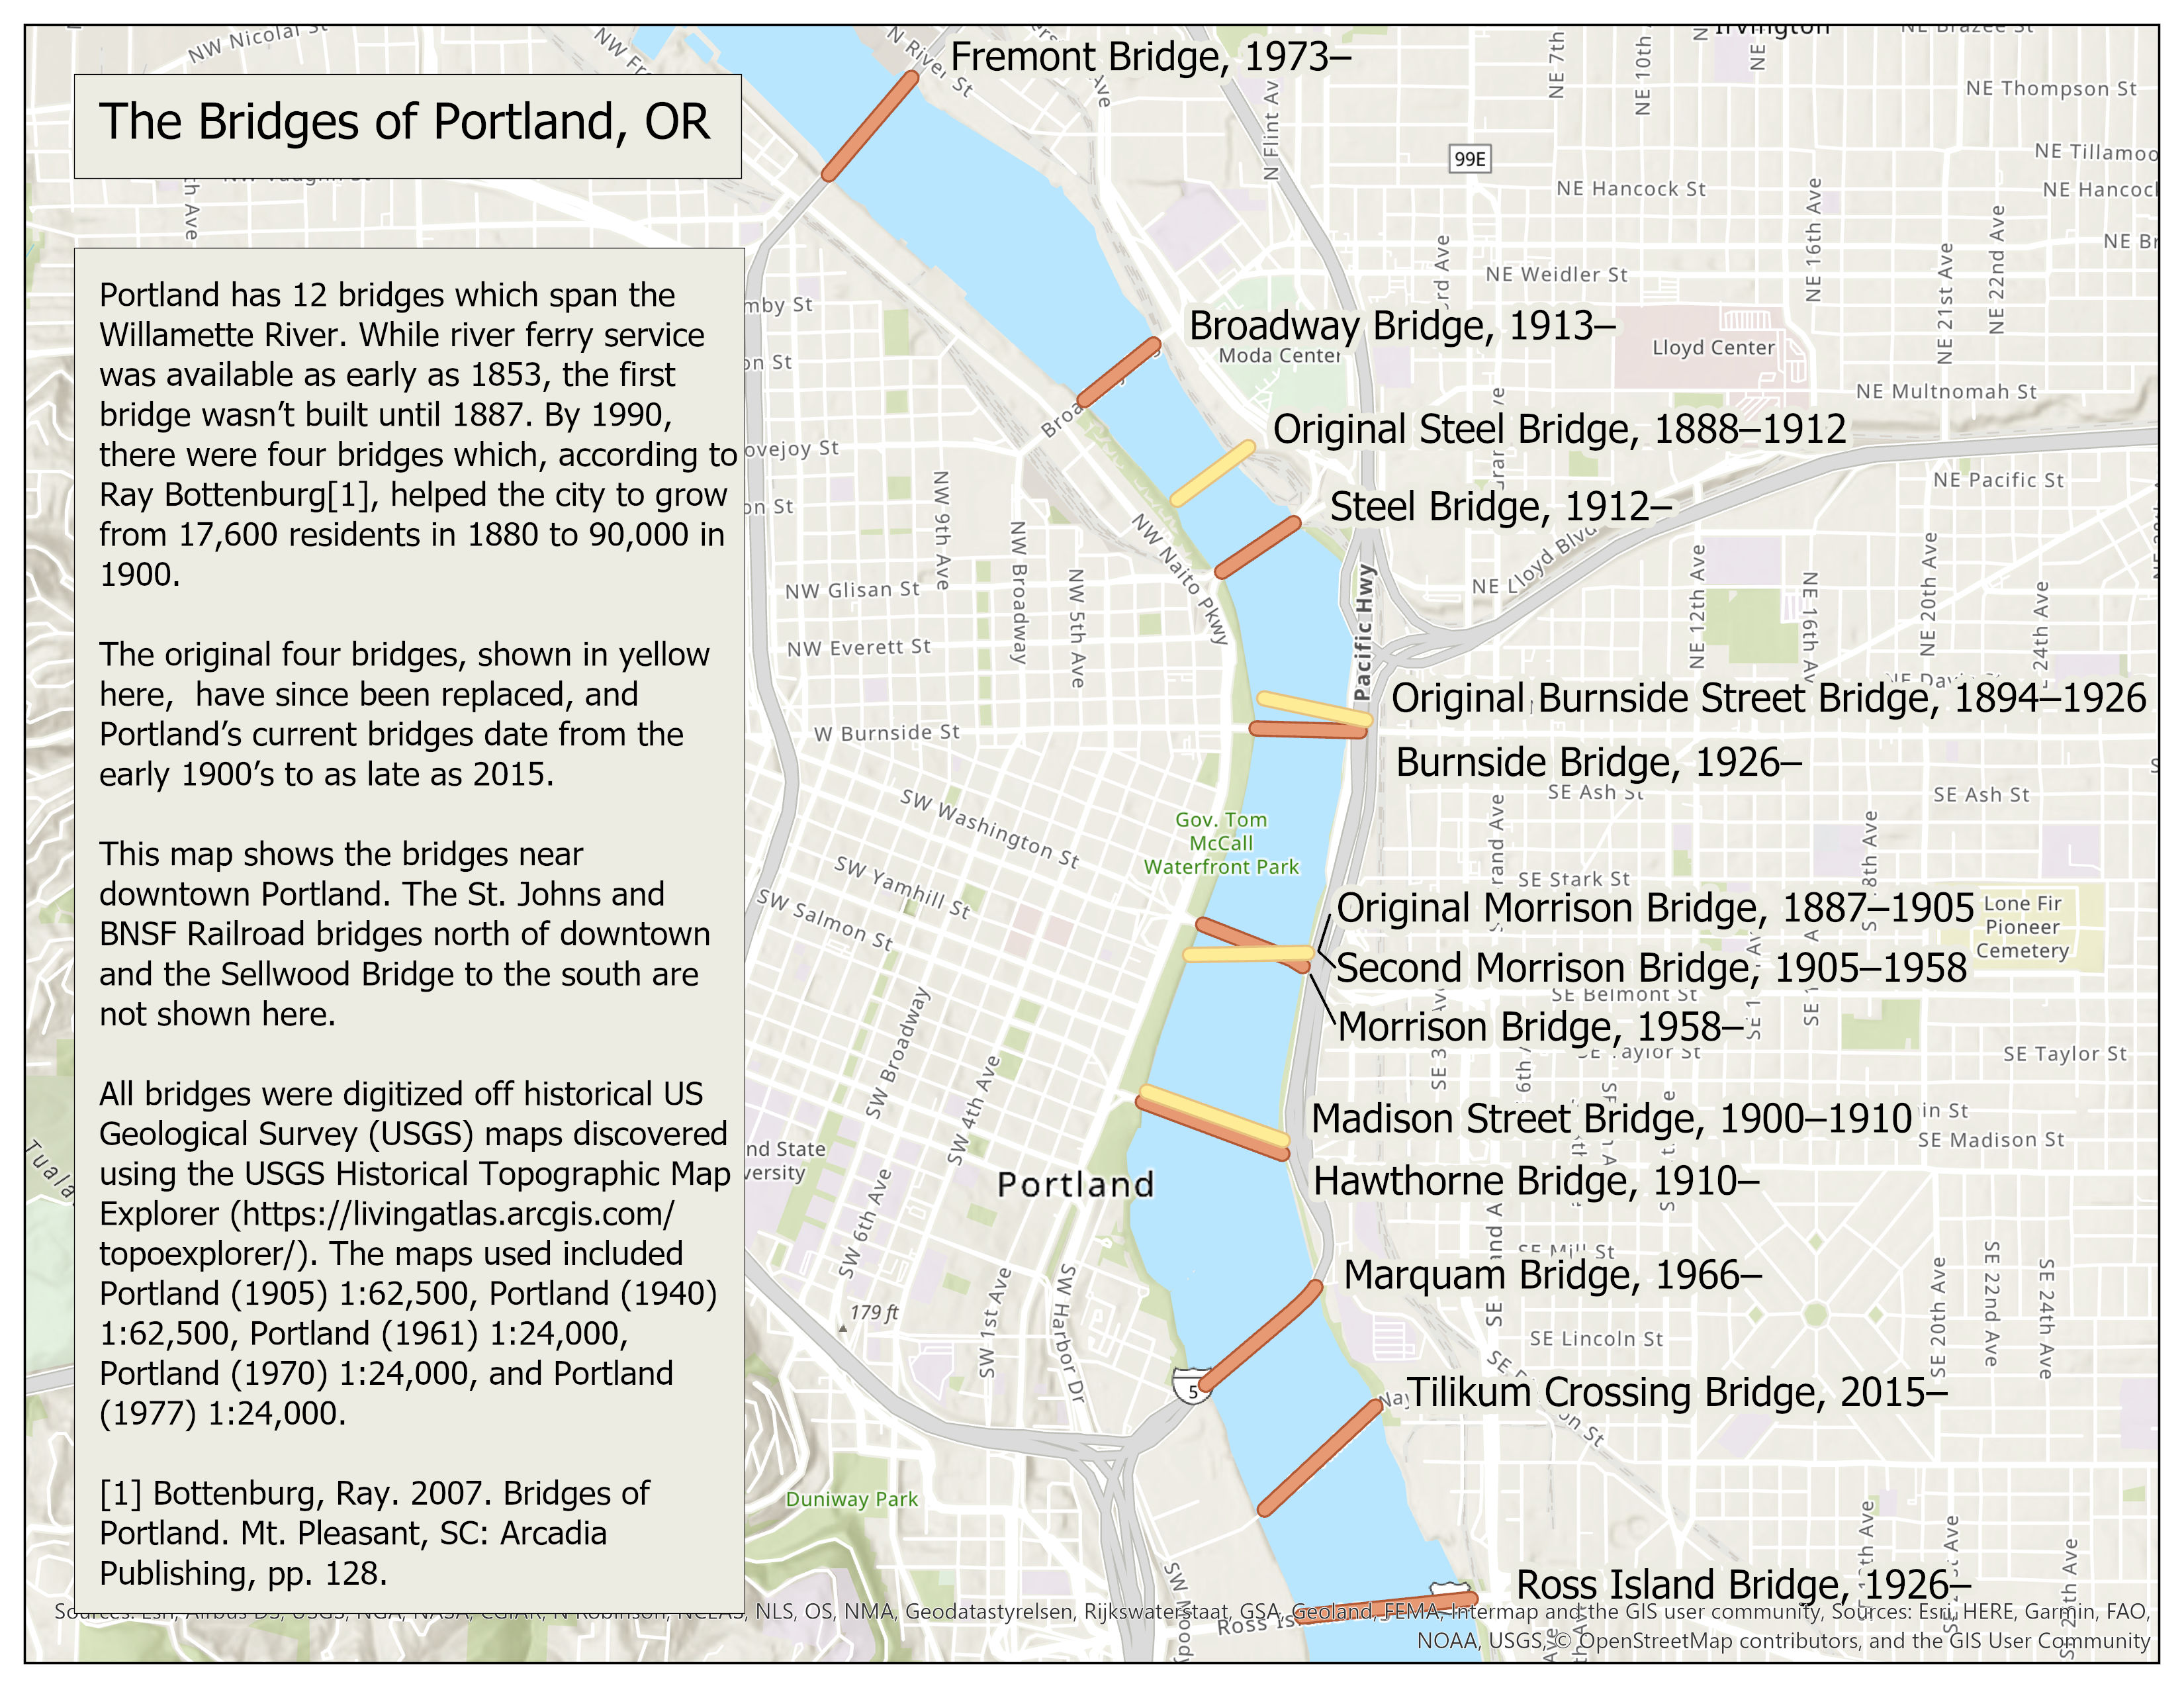
You can open the web map in ArcGIS Desktop (Pro or ArcMap) to further explore the historical maps, overlay other feature classes on the historical maps, or use the historical maps as basemaps. The web map can also be used to create data by digitizing features on the historical maps into feature classes. The example here is based on creating bridge features for historic Portland, OR.
Portland has 12 bridges which span the Willamette River. While river ferry service was available as early as 1853, the first bridge wasn’t built until 1887. By 1890, there were four bridges which, according to Ray Bottenburg, helped the city to grow from 17,600 residents in 1880 to 90,000 in 1900. The original four bridges have since been replaced, and Portland’s current bridges date from the early 1900’s to as late as 2015.
The historical maps in the USGS collection were used to capture this data geographically by adding the web map to ArcGIS Pro and digitizing the features of interest. The workflow follows.
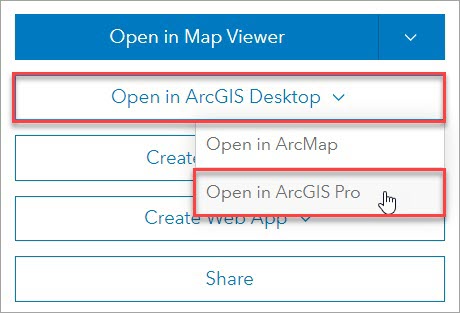
1. In ArcGIS Online, open the item description page for the web map.
2. Click the Open in ArcGIS Desktop > Open in ArcGIS Pro buttons.
3. Click the item.pitemx download link at the bottom of the browser window or from the Downloads folder.

ArcGIS Pro will open.
4. In the Catalog pane, expand the Maps folder, right-click the map, and choose Open.
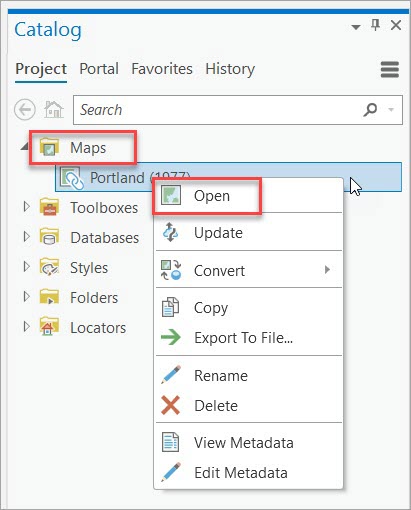
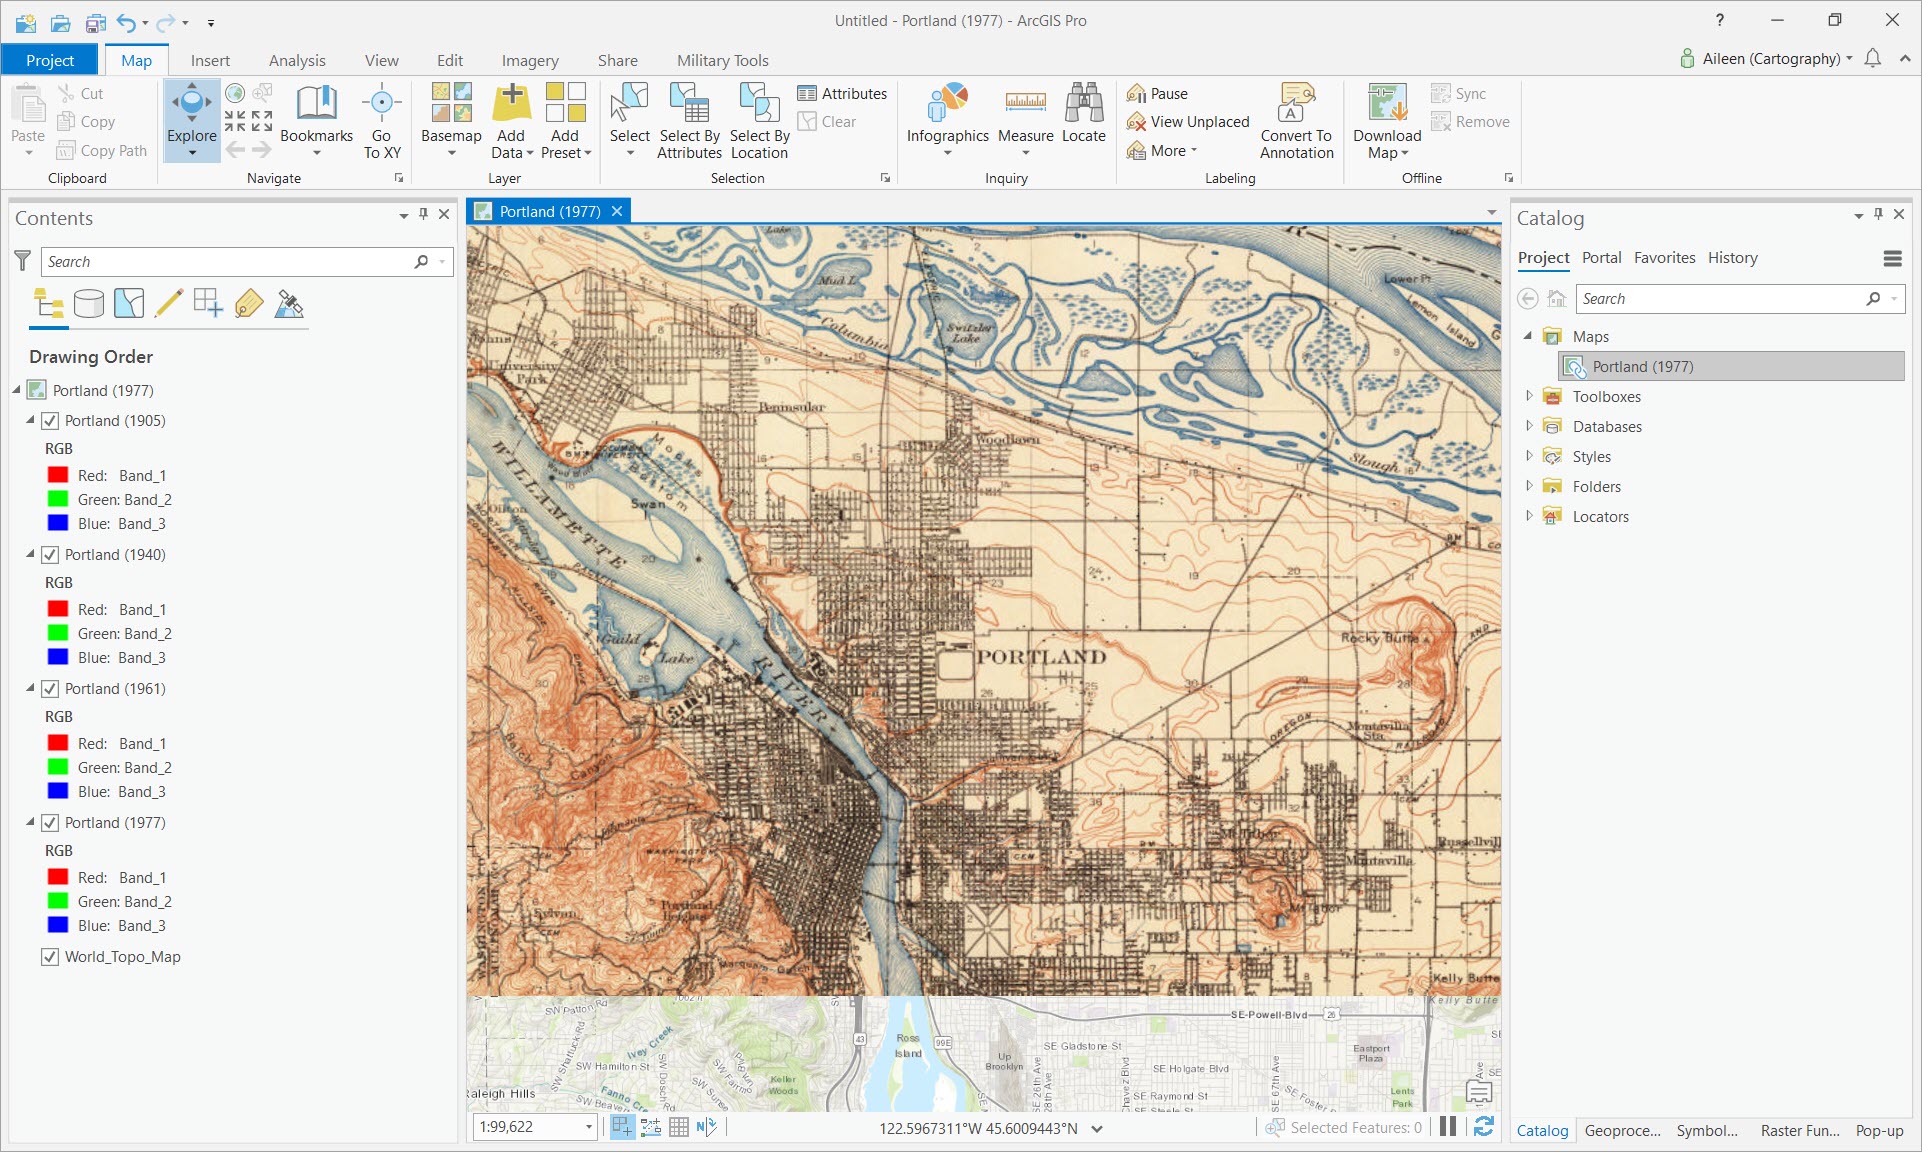
The map will open, and all the historical maps that were in the web map will appear in the Contents pane.
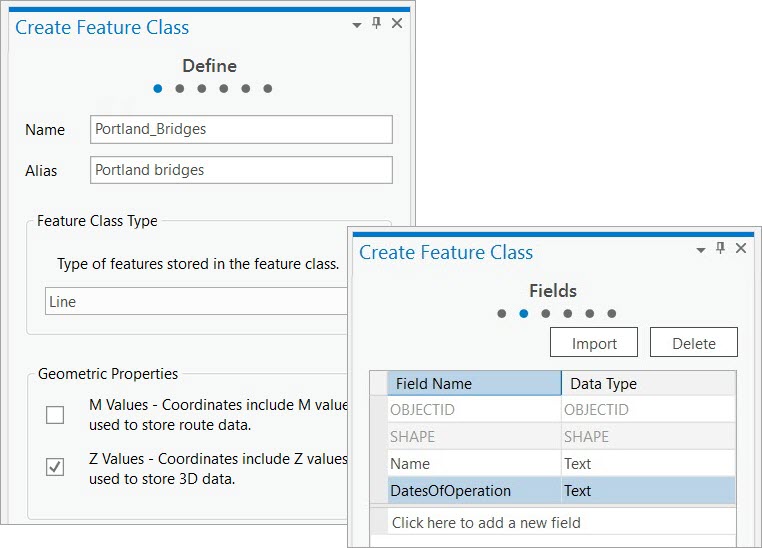
5. In the Catalog pane, expand the databases folder, right-click the default geodatabase, and choose New > Feature Class.
6. Fill in the parameters that are appropriate for the feature class you are creating. In this example, a line feature class is created to capture the bridge features, and two text fields are added to record the bridge names and dates of operation.
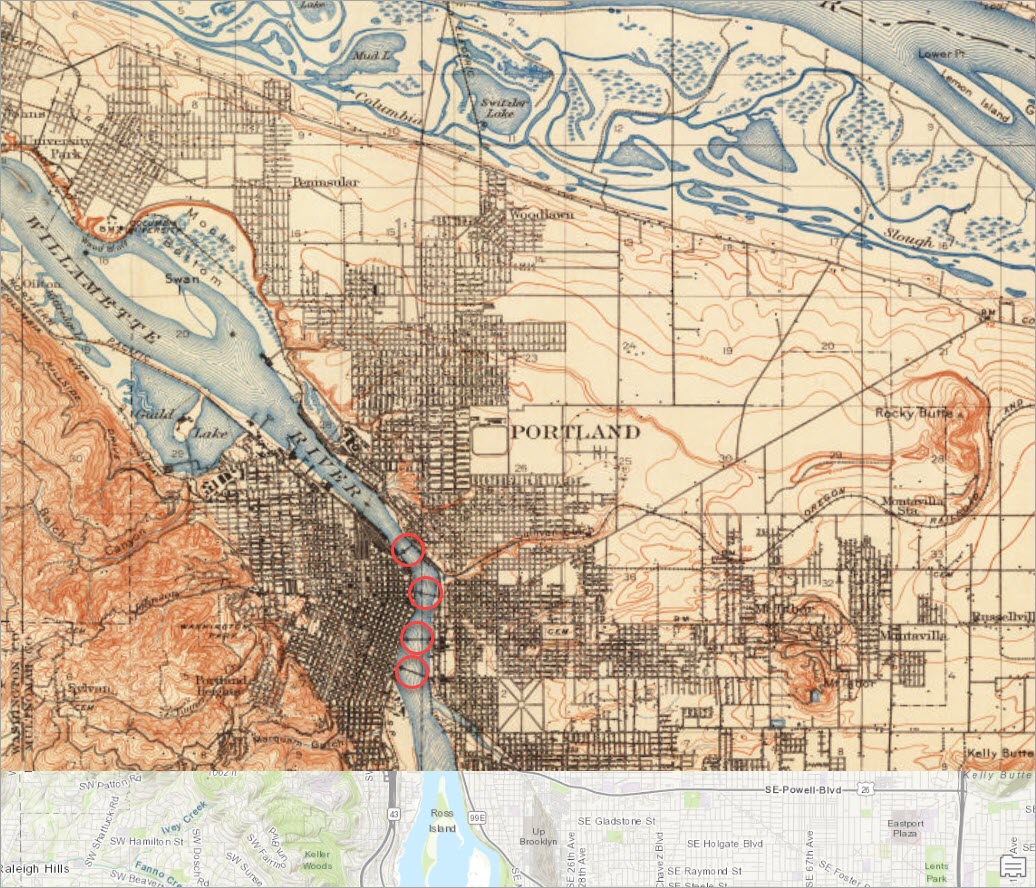
7. Use the first map in Contents panel to find the features you want to digitize. In this example, the Portland (1905) map is used to digitize the four bridges across the Willamette River.
8. Use the editing tools to create the features and update the attributes. For details, see this online help topic.
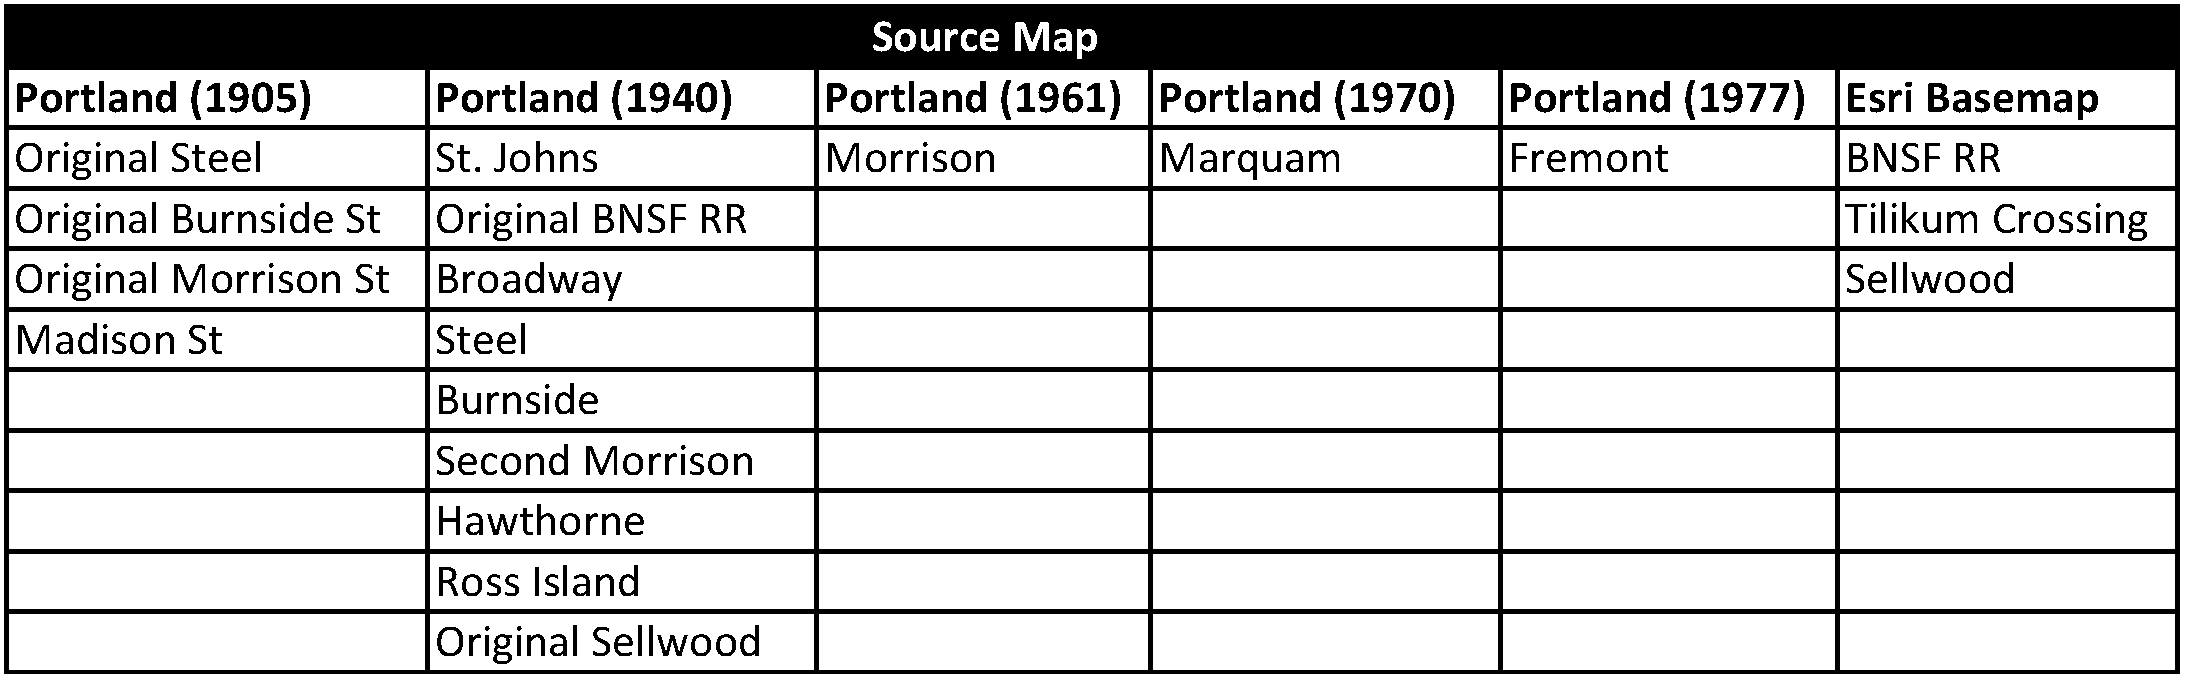
9. Use the other maps to digitize the features for the different time periods. The table below shows with maps were digitized off the Portland historical topographic maps for this example. The dates of operation were also indicated in the attributes for each digitized feature.
10. When you are done, save your edits.
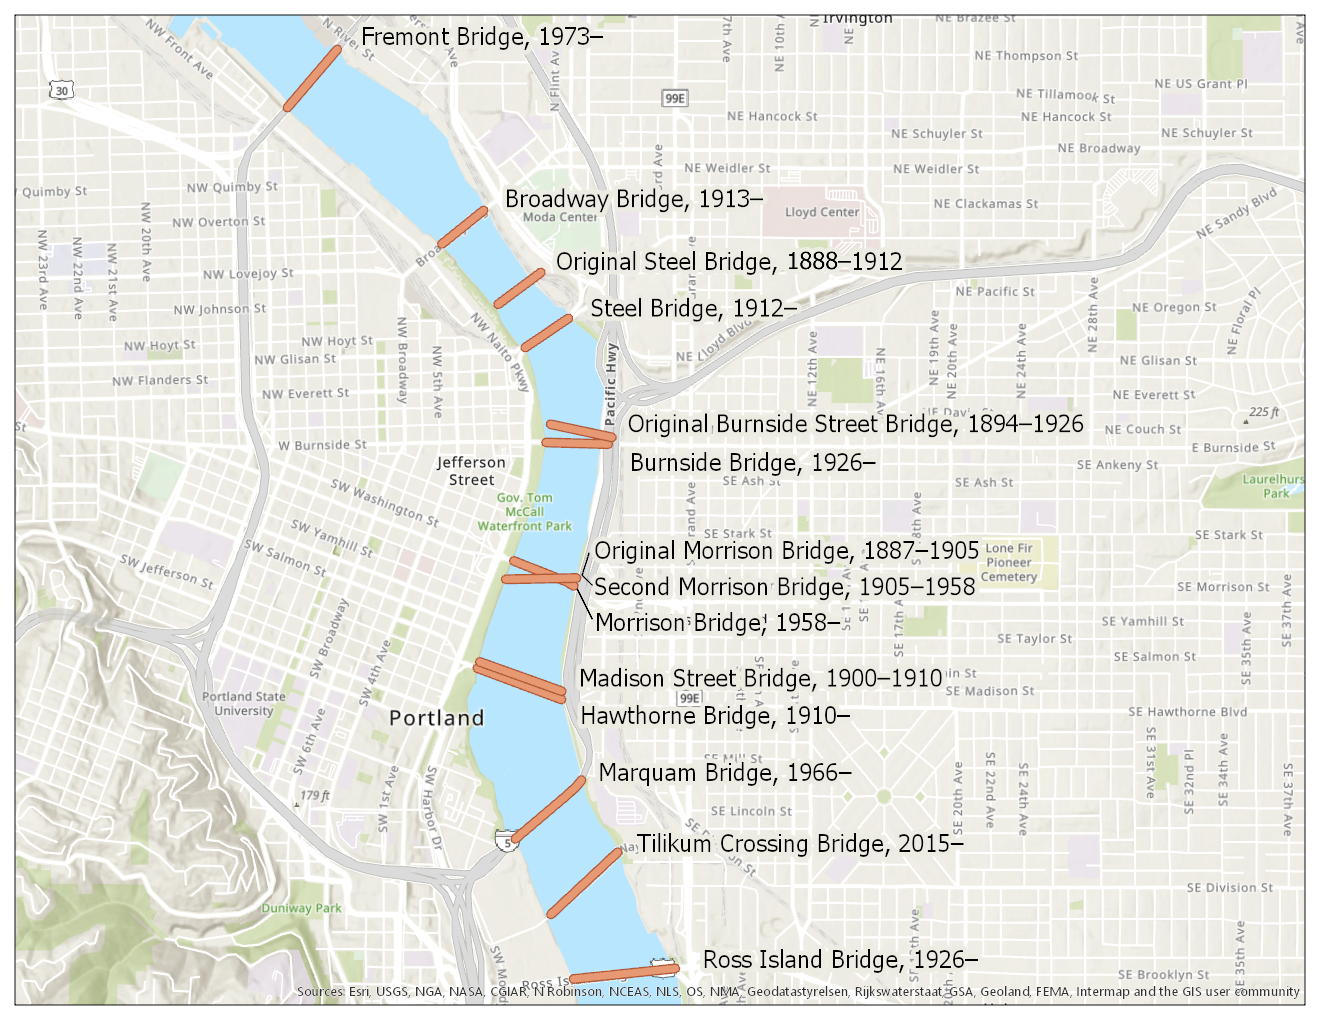
11. At this point, you can share your map as a print map in a layout or as a web map. The print map created in this example is shown below.
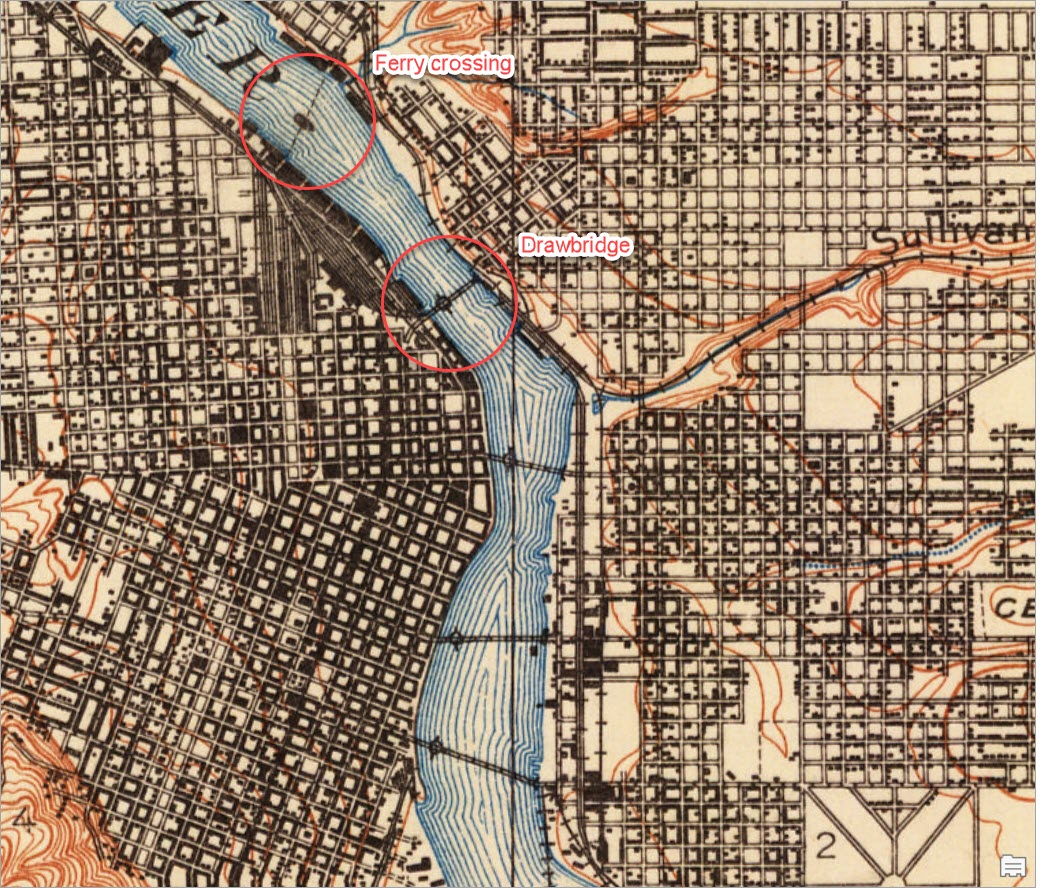
A note about symbols on the historical maps
The symbols on the USGS topographic maps have changed over the years, and there is no single document describing all the symbols used on all USGS maps. However, the USGS has published this symbol key to help you identify the symbols used on their more recent topographic maps. Deciphering the older maps is sometimes more challenging.
For example, there are two different symbols to depict river crossings on the 1905 Portland map shown below. Through a bit of deductive reasoning and exploration of ancillary materials, I was able to determine that the symbols for the bridges indicated that they were drawbridges and that the feature to the note of the north of the northernmost drawbridge was a ferry crossing.
Try your hand at exploring the ever-increasing USGS historical topographic map collection using the USGS Historical Topographic Map Explorer. Use your results to create and share web maps that contain the historical maps and use the maps to create data for mapping and analysis.

Commenting is not enabled for this article.