Have you ever thought about how you experience and take in the world around you? When you visit a new place, what helps orient you? What information do you rely on to understand your surroundings and build a sense of place? How much of that comes from a map, a sign, a landmark, or simply being able to see the landscape around you?
For most people, maps are used on a daily basis. From pulling out our phones and immediately accessing map apps and navigating in real time, to reviewing critical geospatial information in the face of disaster. We can monitor what areas might be impacted by hurricanes, floods, fires, and other disasters so that we can evacuate, move, respond, and adapt. High speed internet, live data feeds, and mobile phones give us access to so much immediate inform ation that shapes the way we automatically move through and respond to the world.
While many of us have experienced this level of access to important information our entire lives, print and web maps have historically not provided equal access to it. Globally, about 1.1 billion people live with visual impairments according to The National Institute of Health. From that amount, about 43 million people are blind and 295 million people live with moderate to severe vision impairment. That is nearly 340 million people who cannot quickly access important information from print and web maps, roughly the population of the entire United States (Worldometer).
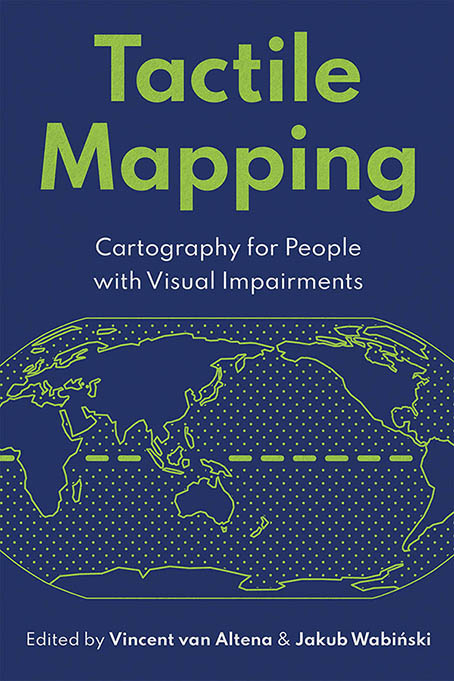
For decades, cartographers, accessibility specialists, and members of the blind and low-vision community have worked to better address these challenges of making traditional print and digital maps more accessible. Raised-line graphics, braille labels, swell-paper maps, and physical models provide alternative ways to experience geographic information through touch. Recent efforts such as the Esri Press book Tactile Mapping: Cartography for People with Visual Impairments, the ArcGIS learn lesson Create a Tactile Map, and the international tactile mapping initiative documented in Making Maps Accessible to All have helped established modern best practices for creating more inclusive cartographic products.
Luckily, the mapping world continues to bring accessible standarrds and equivalents into our mapping software and production methods. We continue to research, document, and define accessibble mapping best practices, while continuing to build, research, and test more possibilities across modern technologies. This R&D project does exactly that.
Accessible Equivalents: Tell Stories with Geospatial Data
Vanessa Knoppke-Wetzel, a Solution Engineer at Esri, supports nonprofits and NGOs. When she received a request to create accessible, tactile maps for United Nations Ambassador Walton Alfonso Webson, the first blind or visually impaired person to chair a session at the UN General Assembly, she was excited and knew she wanted to do more than create topography and terrain maps in 3D.
Vanessa is a long-time advocate for accessibility in cartography, pushing for industry-wide change and teaching best practices through talks and workshops across organizations and conferences. In early 2026, she stood up an Accessibility Committee alongside Jakub Wabiński and Vincent van Altena, co-chairs of the International Cartographic Association’s Inclusive Cartography Working Group, to build the first-ever central repository of accessibility and usability best practices for the geospatial industry. Given her expertise in accessible maps, Vanessa knew that the ideal outcome for these tactile maps would be an experience analogous to what sighted people have when exploring geospatial data on a web map: following the intended data story through touch, such as exploring flooding and landslide risk in Grenada to support climate resilience decisions.
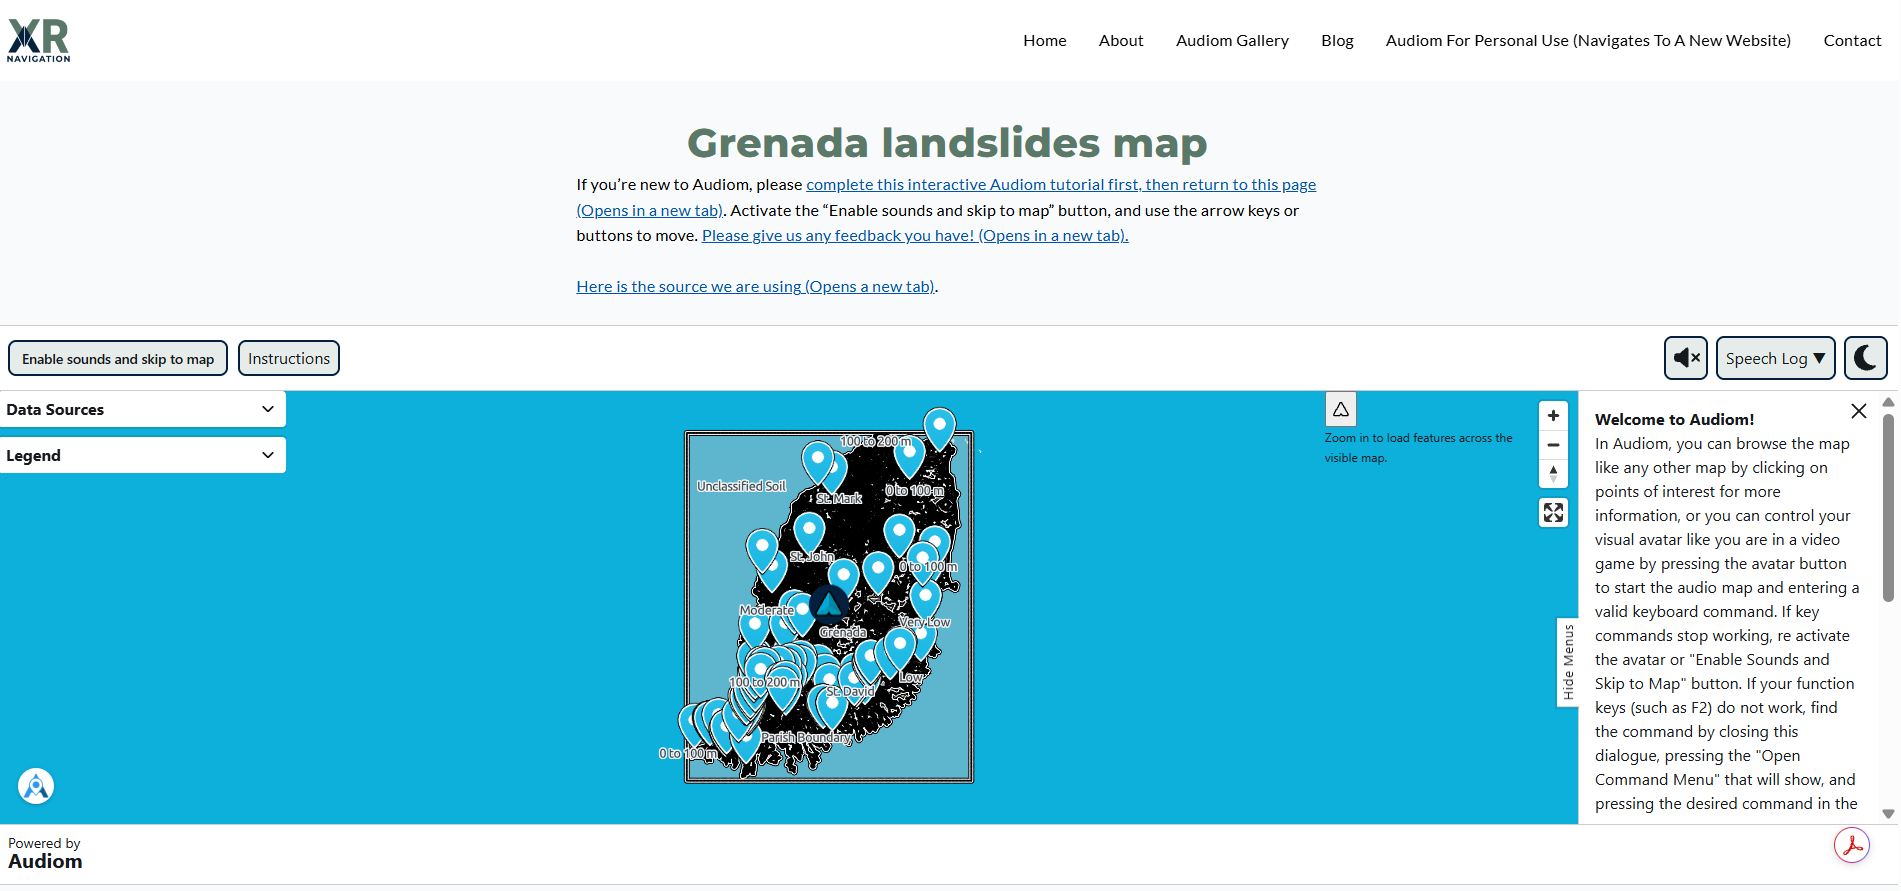
To bring these maps to life, Vanessa teamed up with Hannah Nisonson, a Solution Engineer in Esri’s Applications Prototype Lab, to determine what was actually feasible on the on-site 3D printer for initial prototypes and testing. As testing progressed, Brandon Biggs, founder of Audiom, joined the effort and built a parallel interactive map that is screen reader accessible. Together, the prototyping and collaboration helped us define our goal for the future: accessible tactile maps that move beyond the limitations of a single 3D terrain model.
While we continue to explore how to bridge the gap between physical tactile models and the dynamic, information-rich experiences available through modern digital apps and ArcGIS web maps, this blog documents the R&D process for identifying ArcGIS Pro to 3D printer workflows that move us toward richer tactile experiences for blind and low-vision users. We are excited to share what we have learned, and we would love to hear from you if you create, test, or build your own versions. Share them with us using #FeelTheMap!
Feel-a-ment R&D: The Process and Workflows
Iteration 1: Proving the Workflow
The most fundamental question of this project needed to be answered first: could geographic data from ArcGIS Pro be transformed into a complete tactile map?
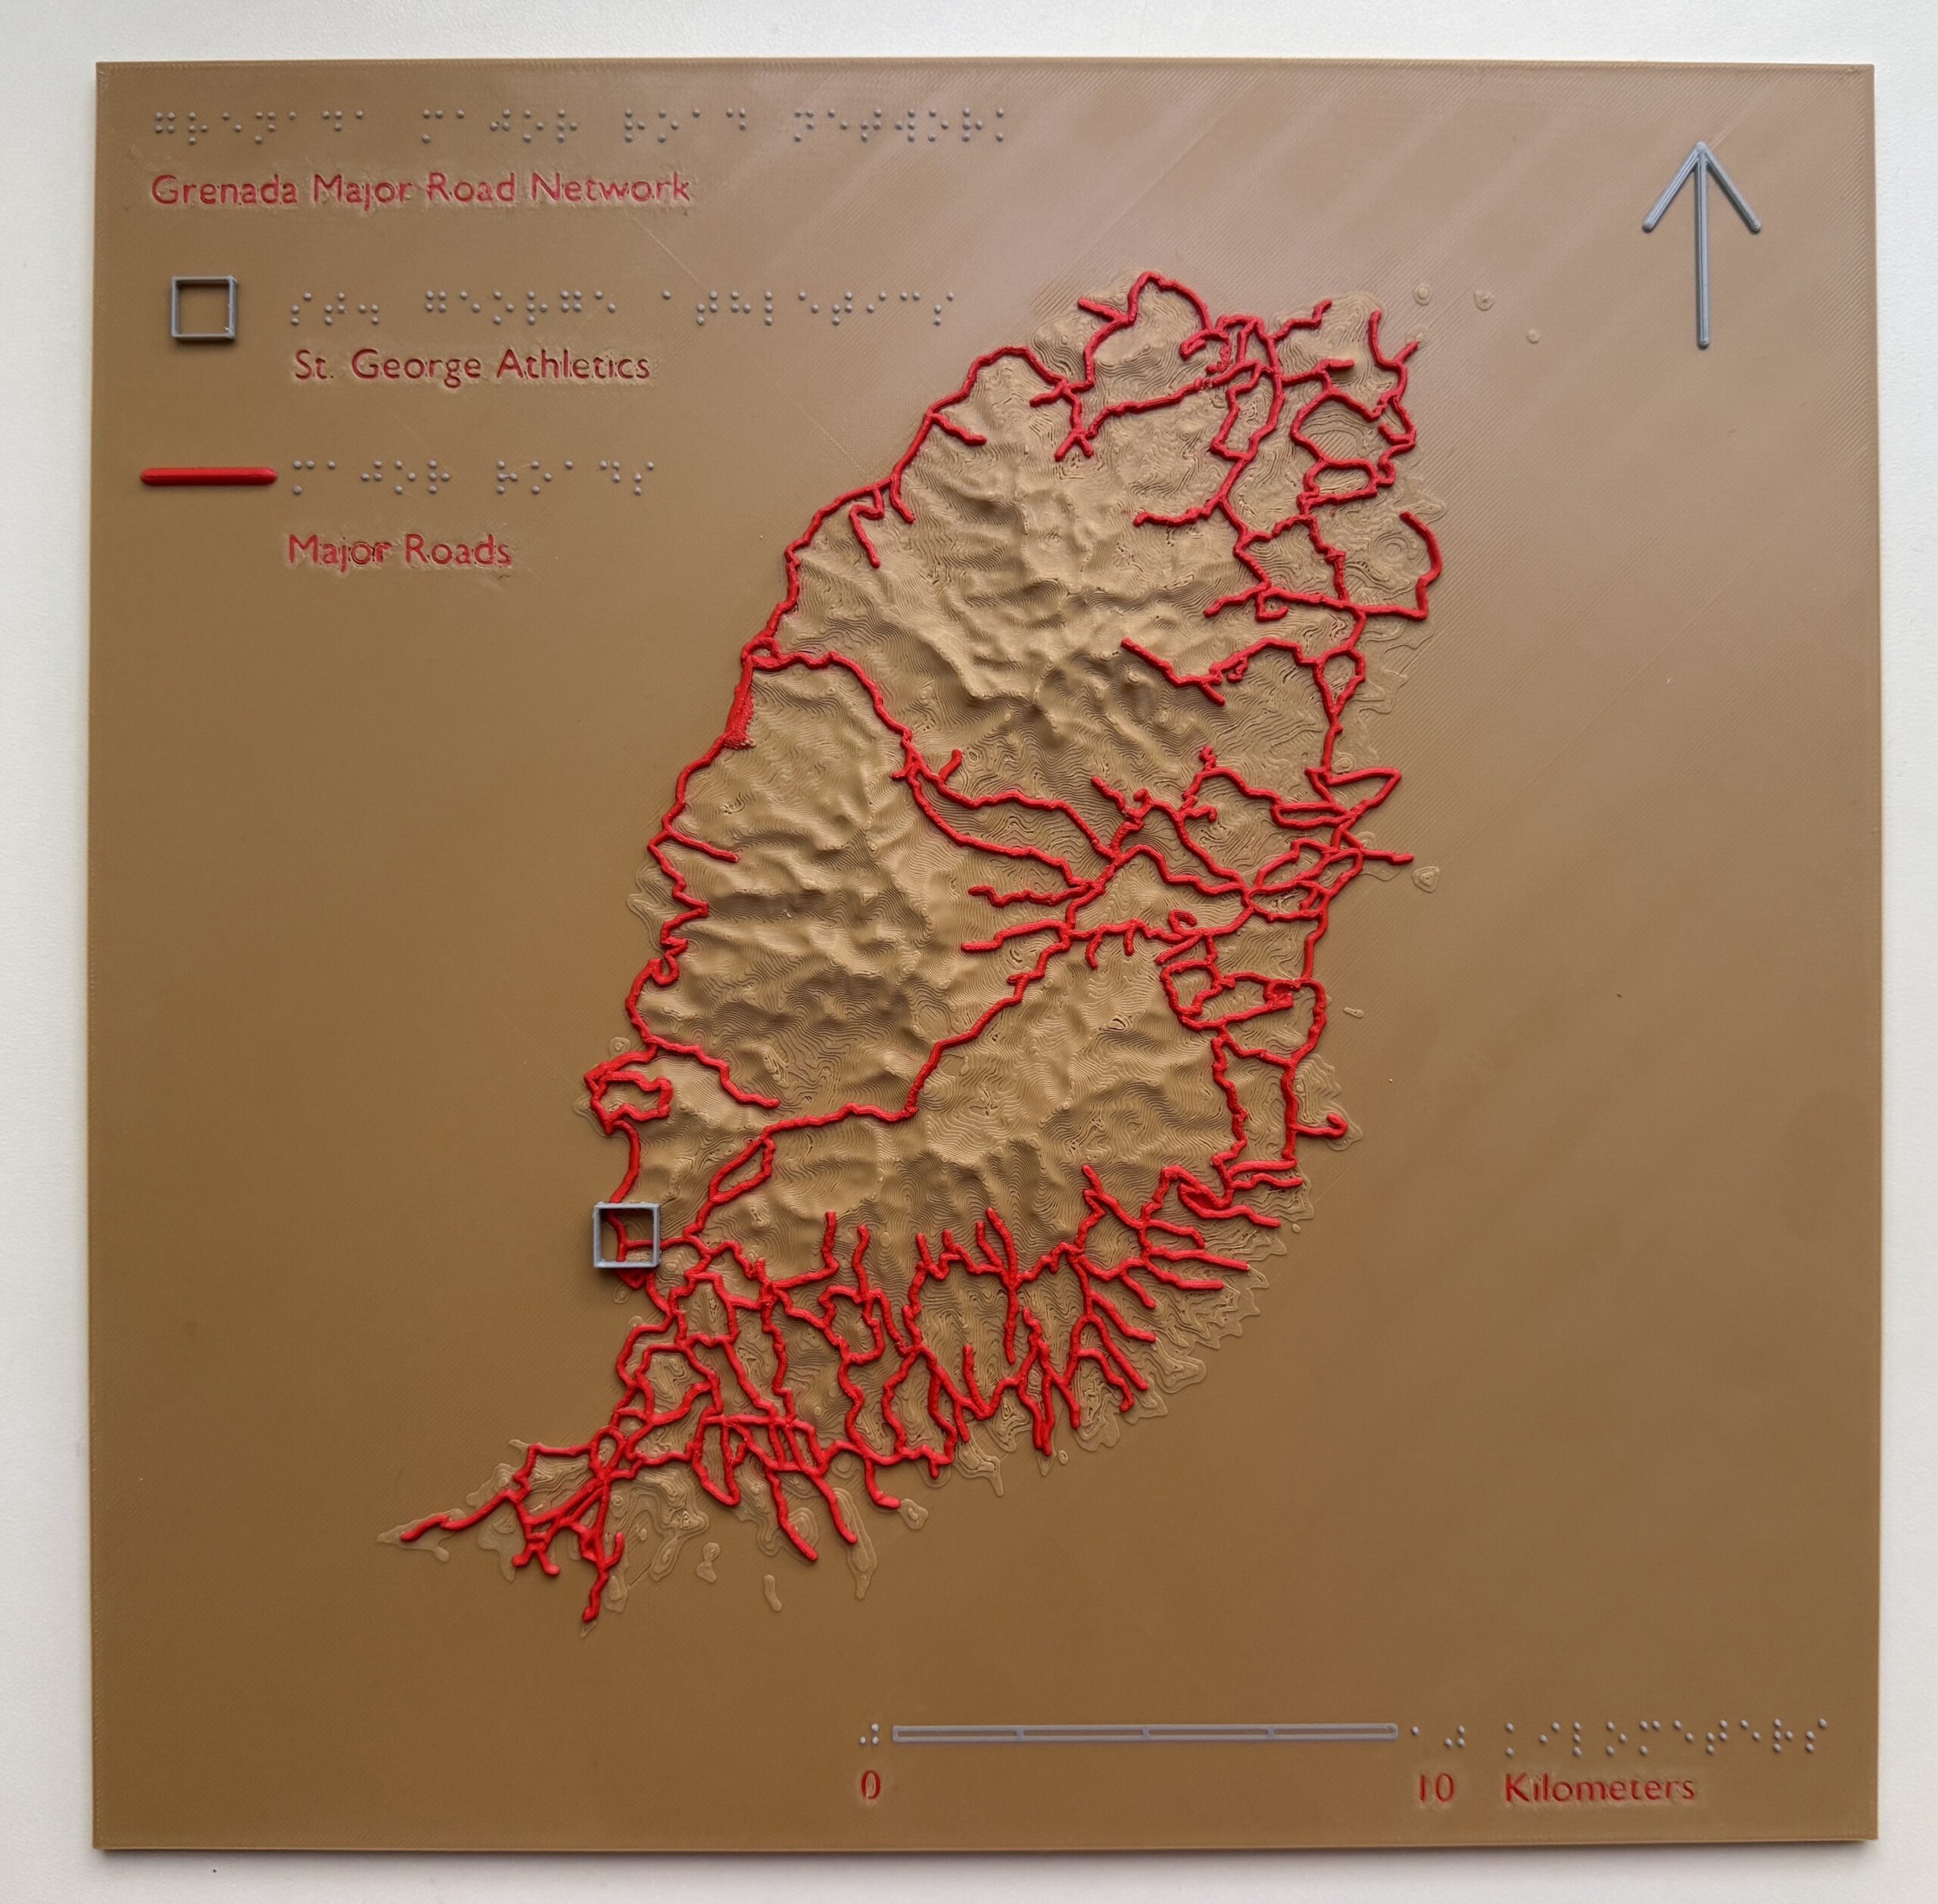
To test the ArcGIS Pro to 3D printer workflow, the initial model combined two datasets from the island of Grenada: a 1-meter digital elevation model (DEM) and the island’s major road network. The goal was not simply a terrain model, which shows the shape of the land and little else. Instead, the objective was an object that works the way a map does: it tells a story through selected layers of data and gives the reader the cartographic elements needed to orient themselves, such as a title, legend, north arrow, and scale bar. For a tactile map, every one of those elements also has to be readable by touch, so braille labels were added to the title, legend, and scale bar alongside the terrain and roads.
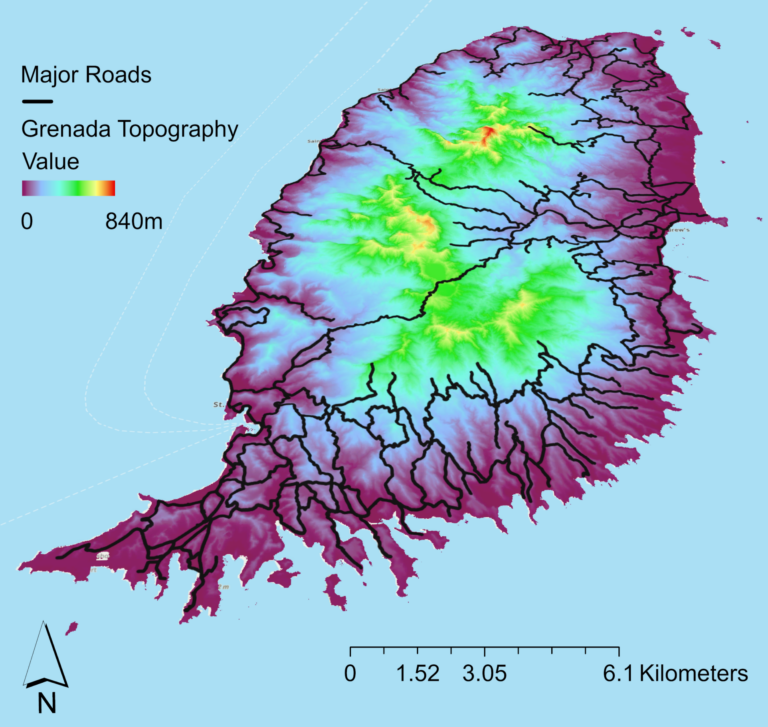
Each element was designed with touch in mind. The road network was printed as continuous raised lines sitting on top of the terrain, so that fingertips could find a road and follow it across the island without losing it in the surrounding relief. The terrain kept much of the DEM’s original detail so that the island’s central mountains, ridges, and valleys could be felt rising from the coastline. The north arrow and scale bar were printed as simple raised lines, and braille was modeled directly into the print as raised dots, giving the team a first test of whether 3D-printed braille could be read at all.
The resulting all-black PLA print was a major milestone, proving that the workflow itself was viable. When touching this tactile map, fingertips can follow the raised roads as they weave through the island, while the topographic relief tells the story of the landscape itself. Together, these layers give the reader a greater understanding of Grenada and the many geospatial connections it contains, from major terrain features to traditional cartographic elements like orientation and the legend, all communicated through physical touch.
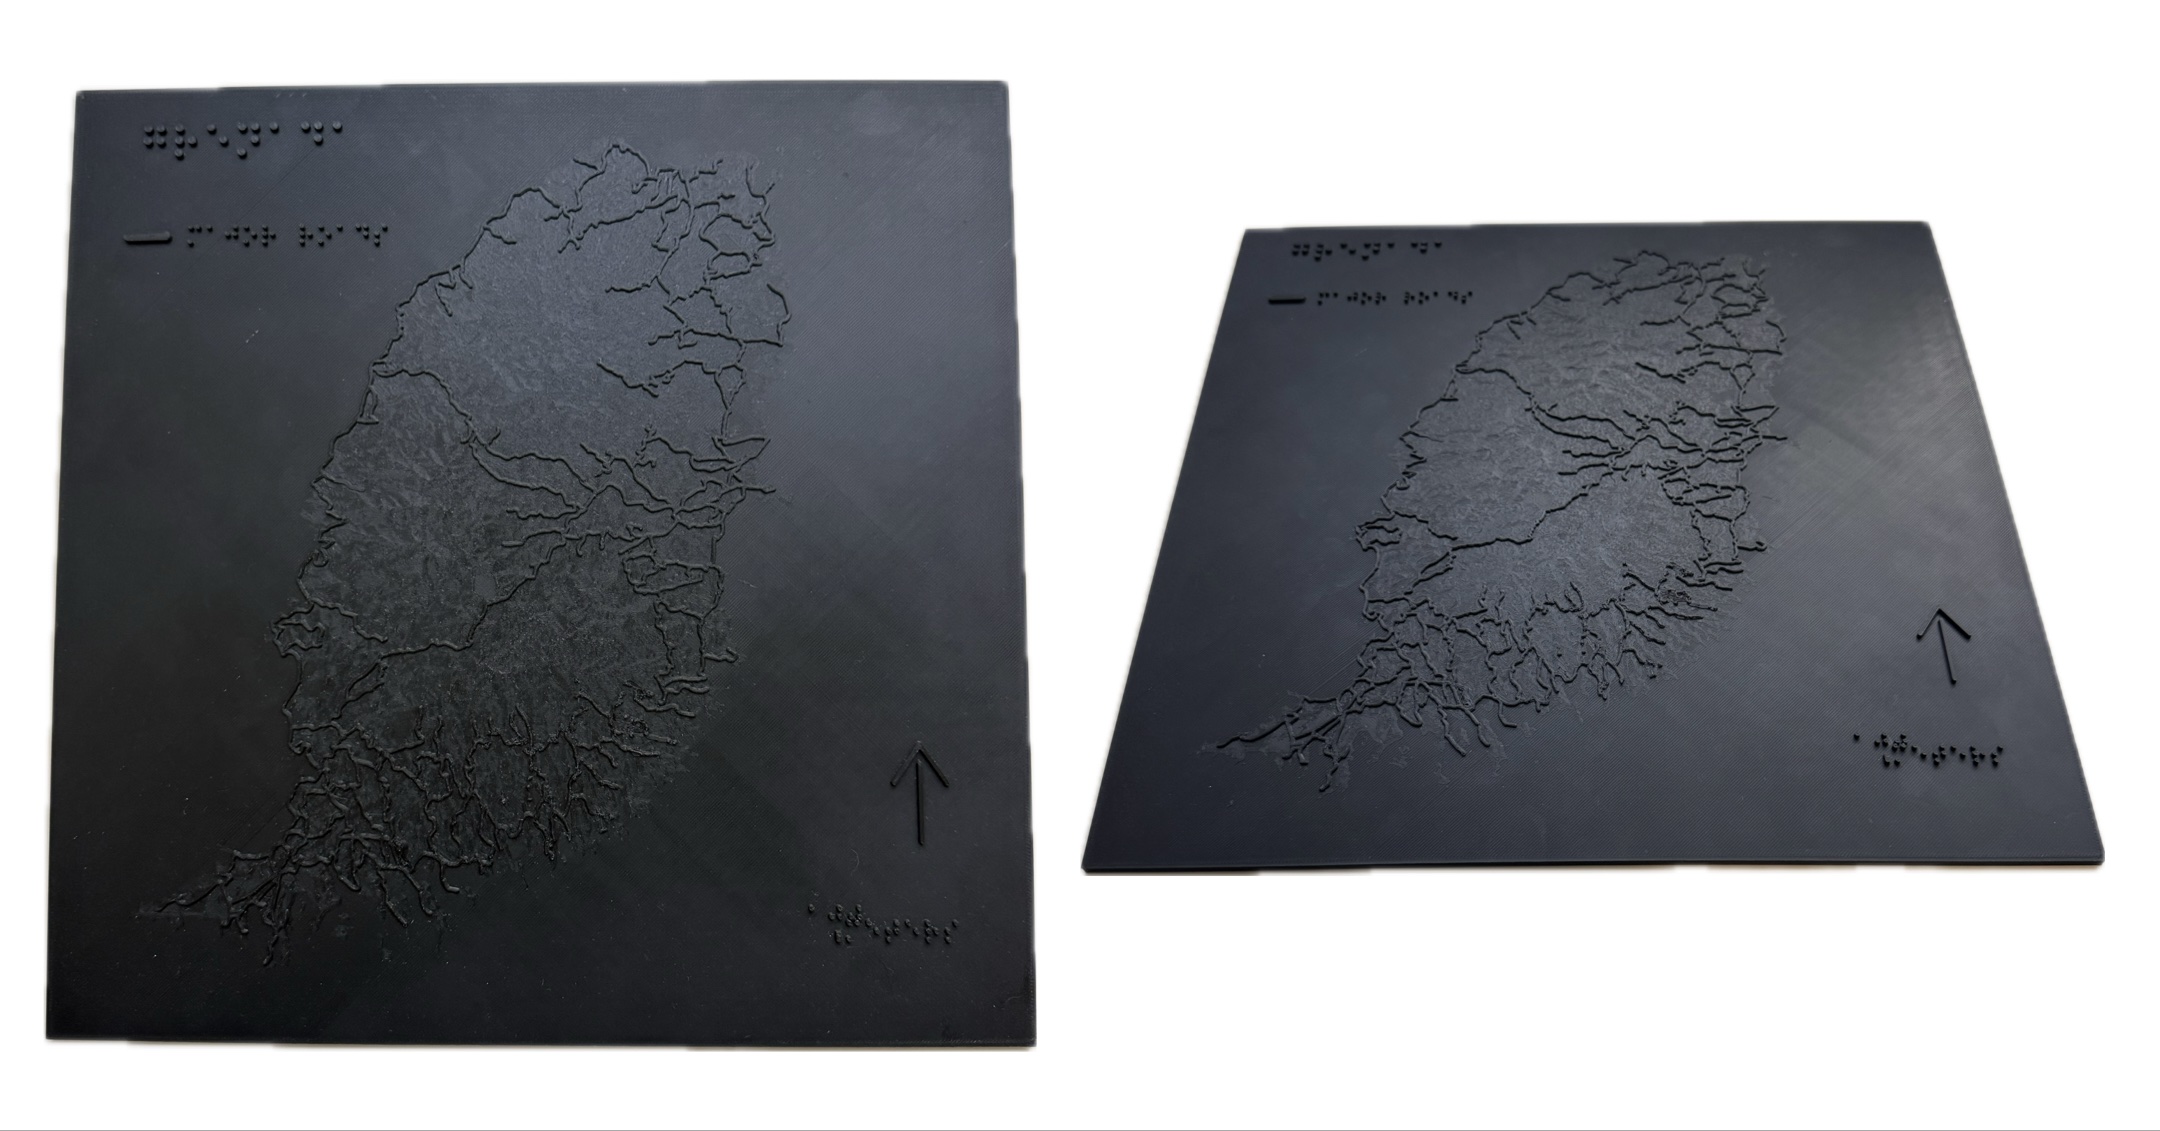
At the same time, the prototype exposed several shortcomings. The terrain surface contained significant textural complexity: at 1-meter resolution, nearly every small bump and ridge in the DEM was printed, creating a rough surface that competed with the roads for the reader’s attention. Unlike the eye, which can take in a whole map at a glance and filter out detail, fingertips explore a small area at a time, so excess texture makes it much harder to tell a meaningful feature from background noise. The road network also created areas of high feature density. Where the network is densest, the raised lines sat so close together that individual roads became difficult to separate and trace by touch. Visual maps solve this with color and line weight; tactile maps have to solve it with spacing, height, and simplification. Additionally, while braille was successfully printed on the map, there was uncertainty about whether the 3D-printed dot size and spacing aligned with tactile graphics best practices. Braille that is too large, too extruded, or inconsistently spaced can be misread or unreadable, which would leave the title, legend, and scale inaccessible to the very readers the map was designed for.
Ultimately, this first prototype proved that the ArcGIS Pro to 3D printer workflow was possible, but it also reinforced a lesson frequently emphasized throughout tactile mapping literature: what looks visually appealing is not necessarily effective when experienced through touch.
The next challenge was determining how to communicate the map’s information more intentionally for blind and low-vision users.
Iteration 2: Learning what to Remove
To create tactile maps that better aligned with accessibility standards, the second phase shifted from testing the production workflow to experimenting with the 3D design of the features themselves.
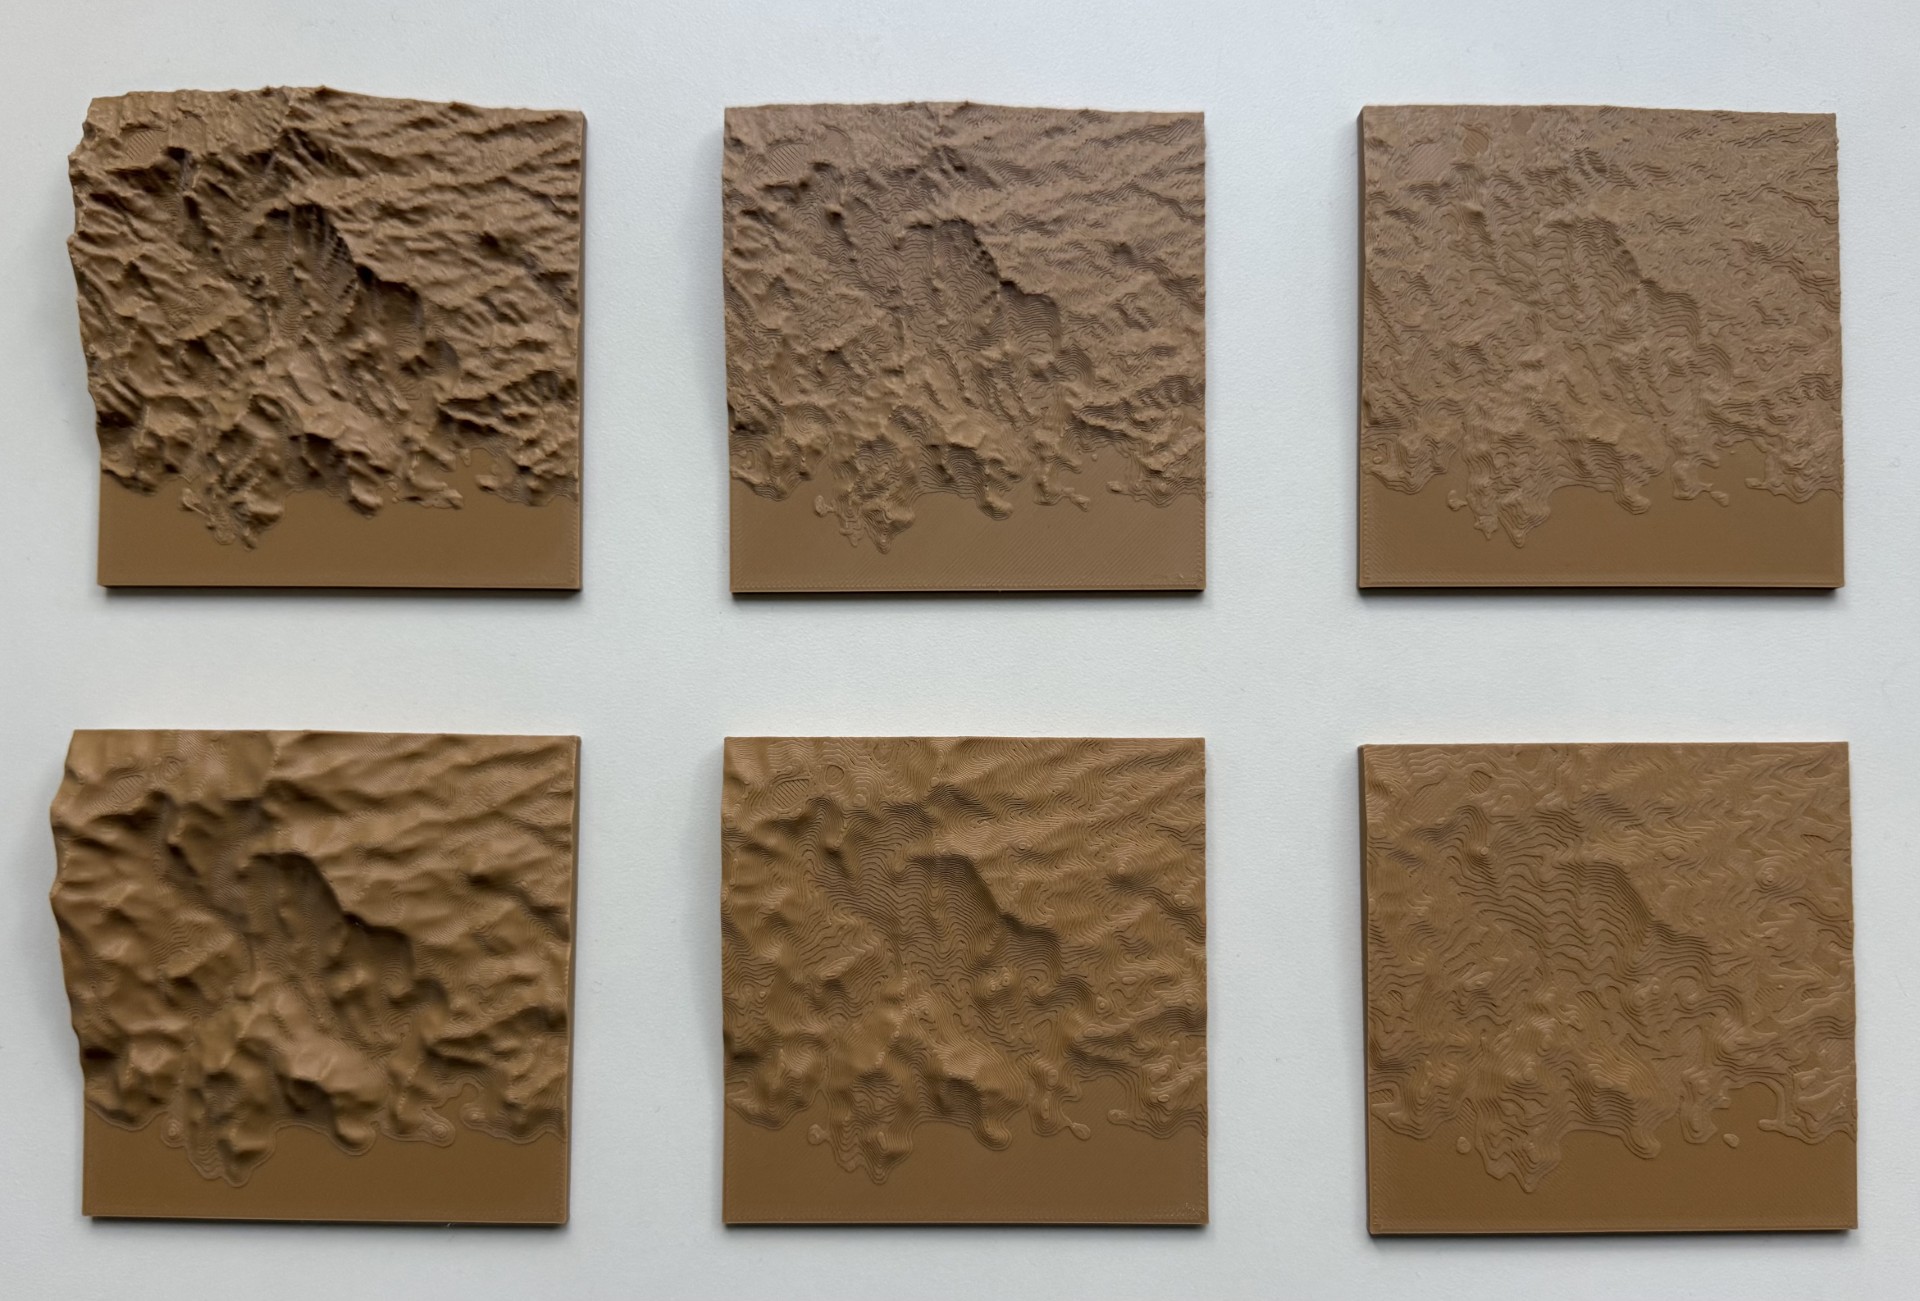
Rich Spencer, an Application Developer in Esri’s Applications Prototype Lab, helped move beyond the first prototype by testing what an improved, accessible tactile experience could be in a 3D-printed map. He created a series of small test tiles to evaluate terrain exaggeration, smoothing techniques, road prominence, and braille readability. Each of these variables directly affects whether a reader can distinguish features clearly and consistently by touch, which is exactly where the first prototype fell short. Printing small tiles made it possible to compare options side by side, quickly and with little material, before committing to a full map.
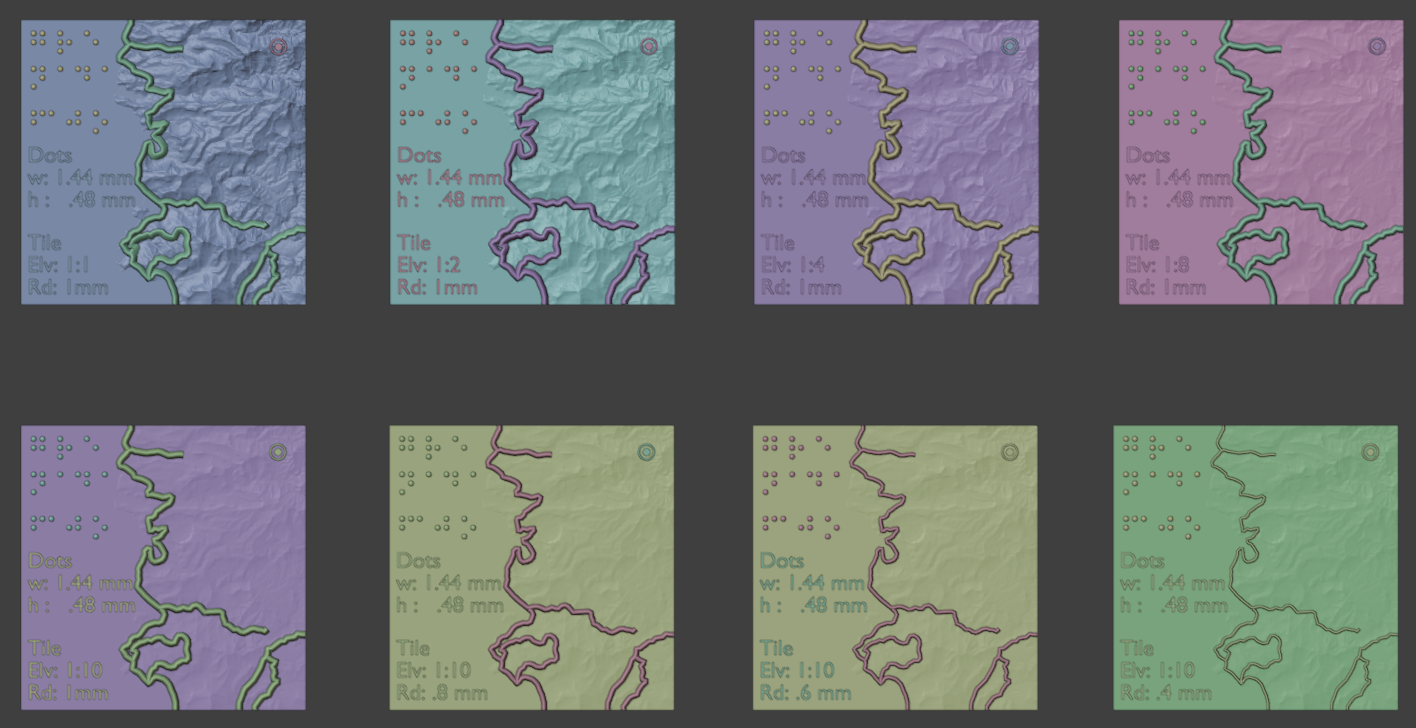
The tile variations were built in Blender, a free, open-source 3D modeling application that gives precise control over a model’s geometry. Using the same patch of Grenada’s landscape, Rich produced versions of the terrain ranging from the full-detail DEM surface, with every small ridge and bump preserved, to progressively smoothed and simplified surfaces where only the broader shape of the land remains. The tiles also varied road width, from 1 mm down to 0.4 mm, and elevation scale, so the team could feel which combinations were easiest to read.
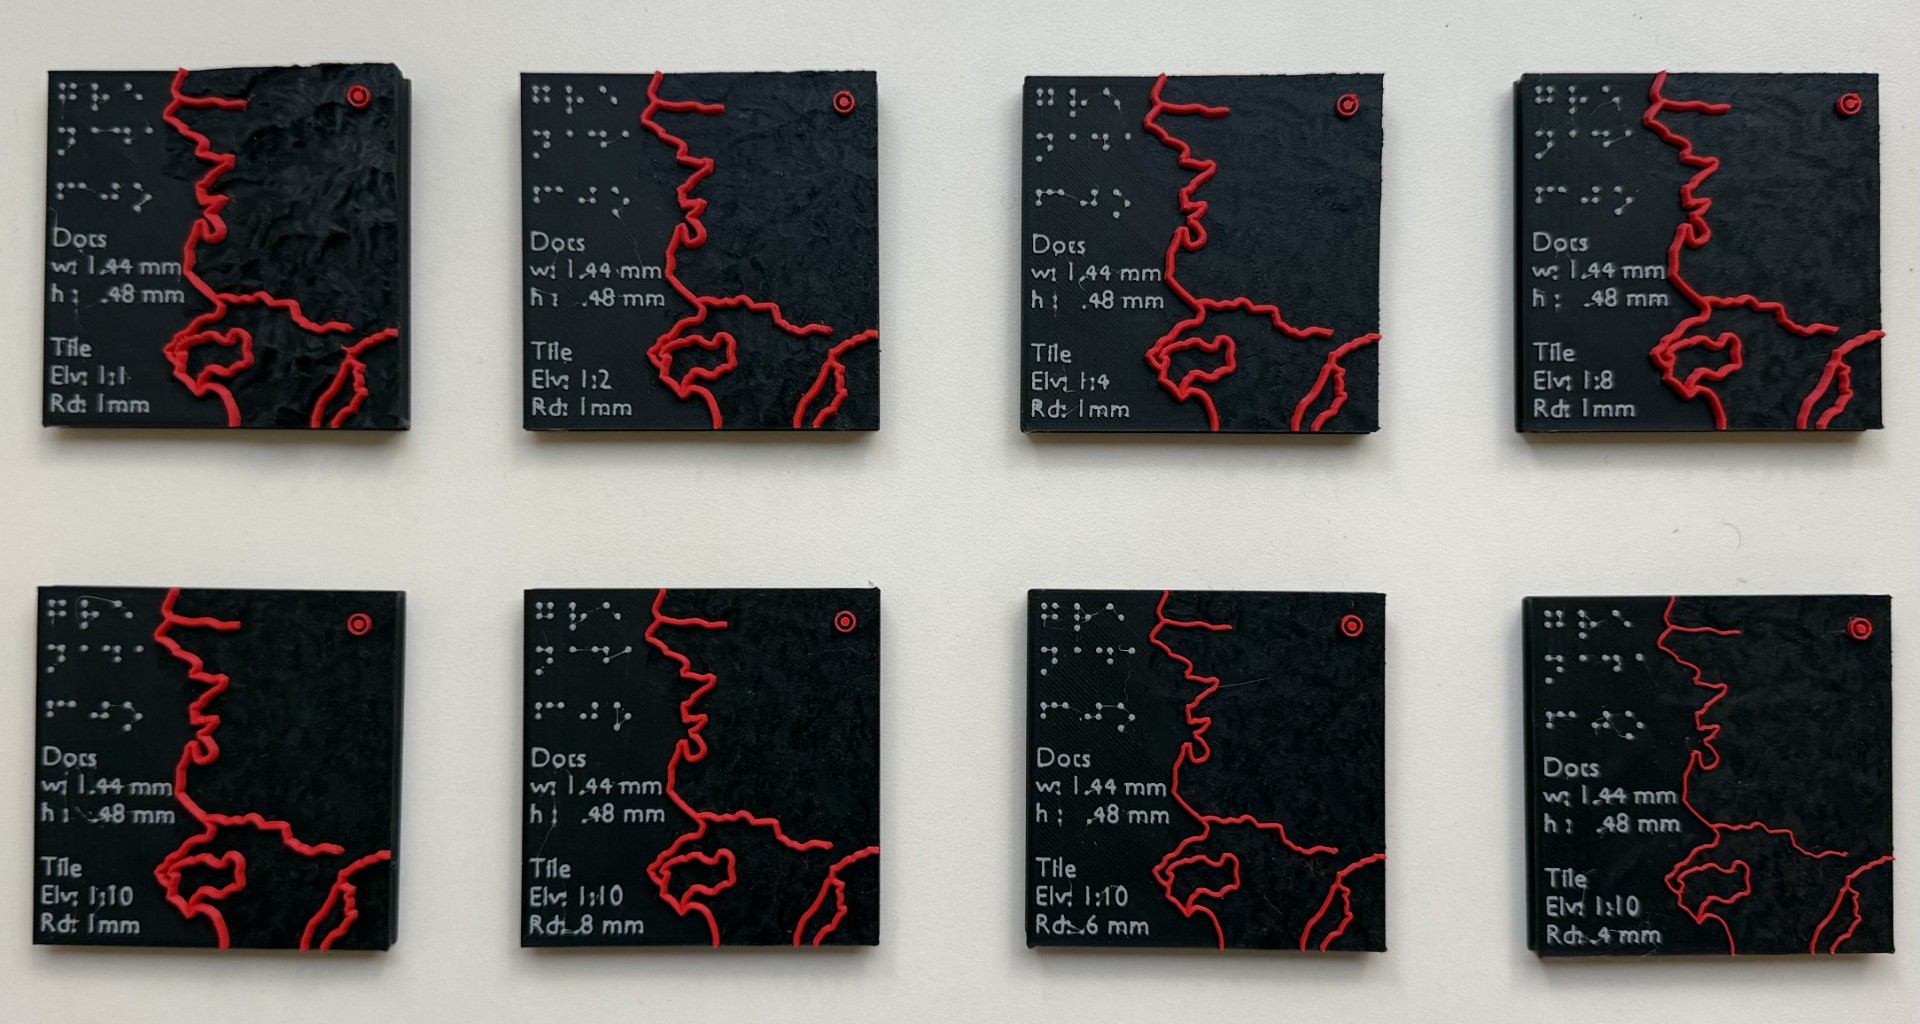
Braille dimensions and spacing were evaluated against recommendations from the Braille Authority of North America’s Guidelines and Standards for Tactile Graphics. We also reviewed design principles from Tactile Mapping: Cartography for People with Visual Impairments, the ArcGIS Learn lesson Create a Tactile Map, and several community-led tactile mapping initiatives. Across these resources, a consistent message emerged: tactile cartography depends on simplification, abstraction, feature hierarchy, and thoughtful generalization.
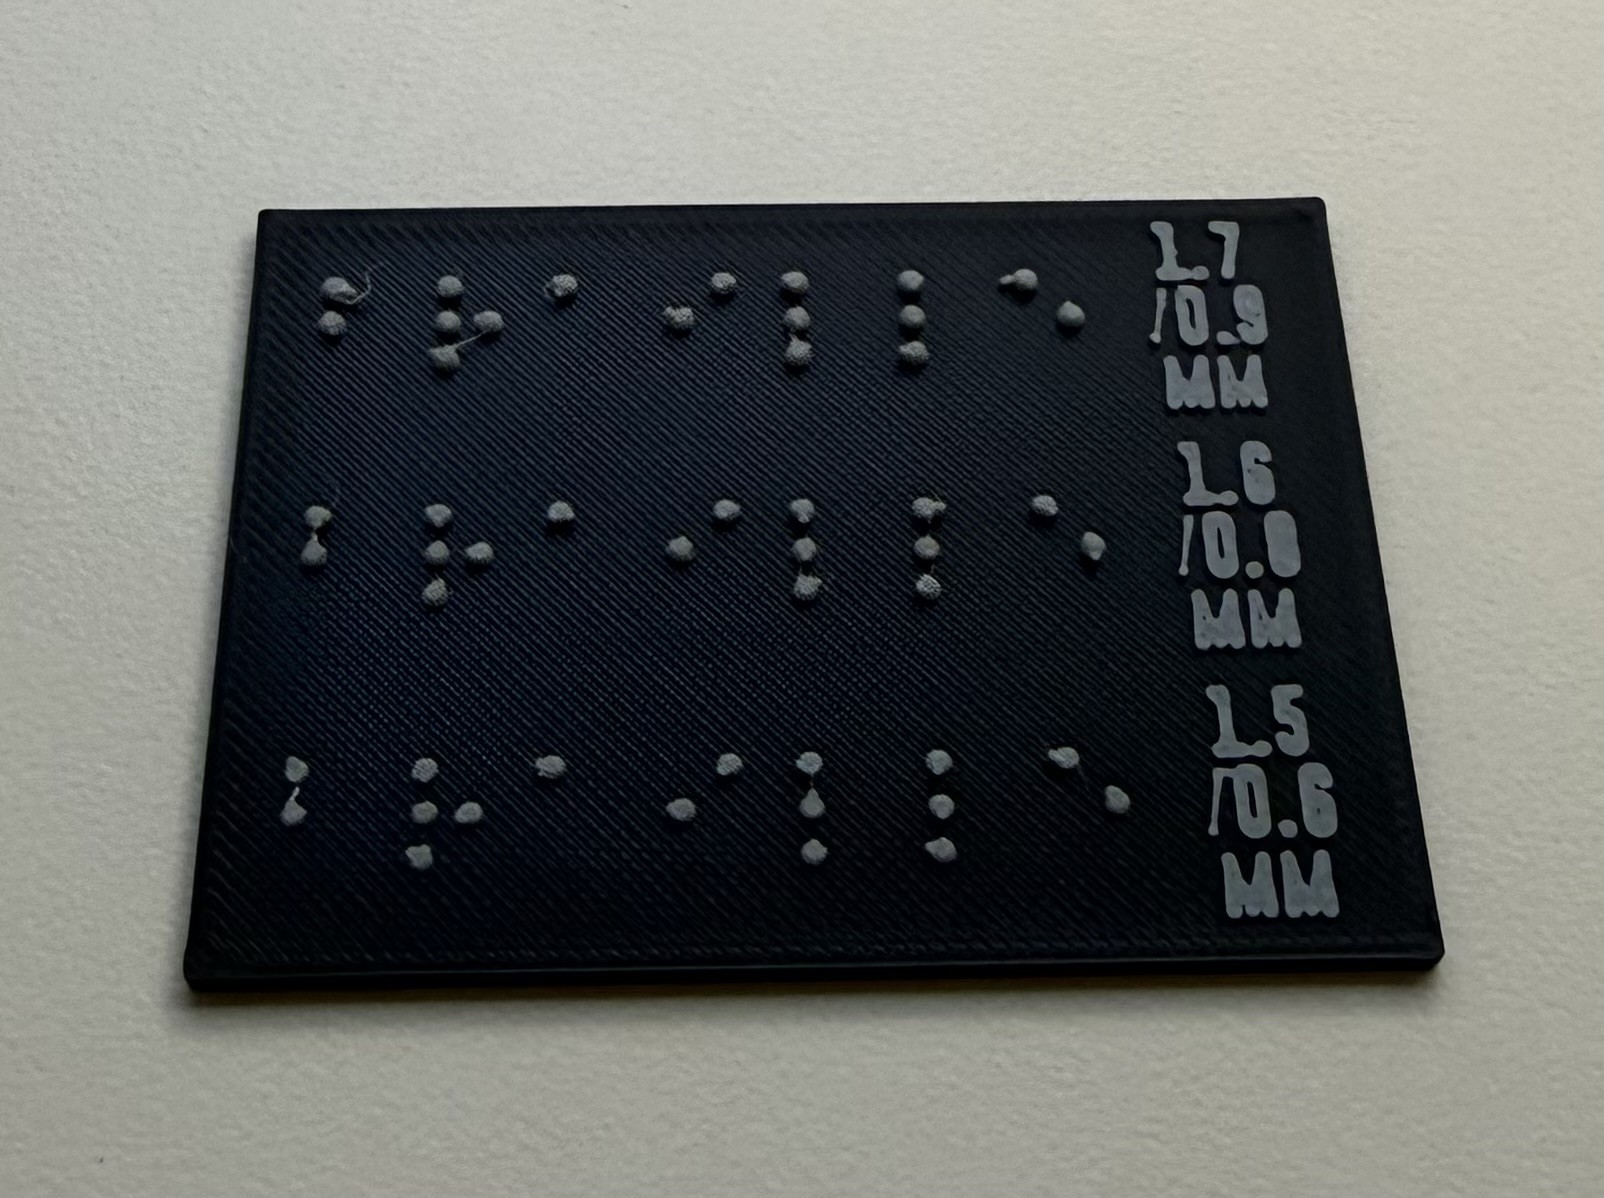
The research results aligned with the general tactile accessibility knowledge the team had at the beginning of the project. Excessive terrain detail introduces tactile noise: when every small variation in elevation is printed, fingertips struggle to separate meaningful landforms from surface roughness, and important features get lost. Roads needed to be clearly distinguishable without being overwhelming, meaning raised and wide enough to be found and followed, but not so wide or so dense that neighboring roads merge together or crowd out the terrain and labels around them. Braille dimensions required careful adherence to established standards, because braille readers rely on consistent dot size, height, and spacing to recognize characters quickly and accurately. In the first prototype, it was unclear whether the braille met these expectations; on the test tiles, the dots were sized at 1.44 mm wide and 0.48 mm tall so readability could be evaluated against a known baseline. Overall, the tests showed that an effective tactile map requires carefully selected features and intentional, specific design to improve comprehension and spatial understanding for blind and low-vision users.
With these additional tests and lessons learned, the design moved closer to the goal of maximizing understanding through touch.
Iteration 3: Building a Tactile Language
Armed with the lessons learned from testing, the third round of prototypes focused on creating a more deliberate tactile experience.
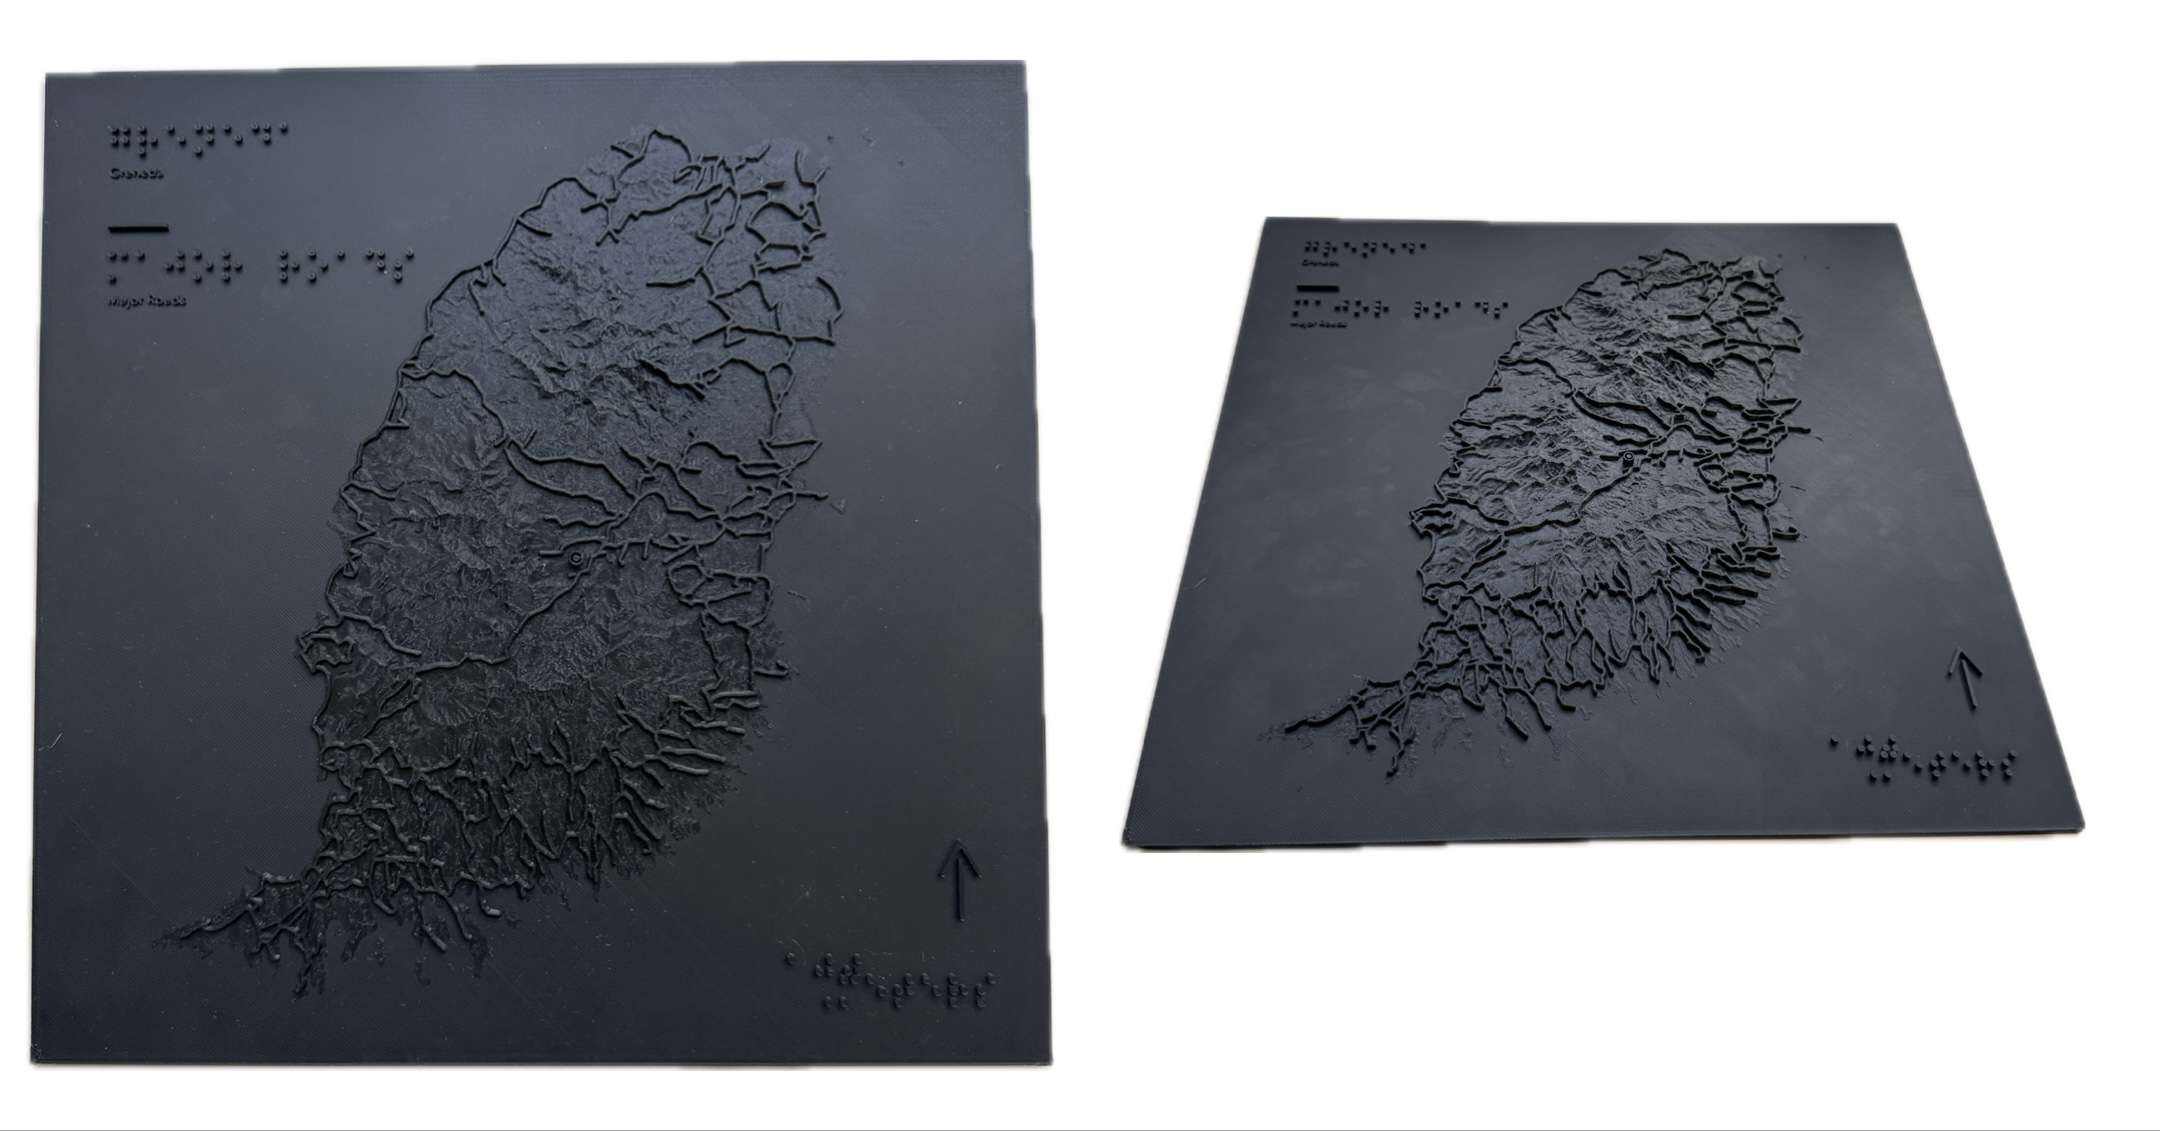
In these iterations, the Grenada 3D model was updated with a focus on generalization and simplification. The terrain was smoothed, making it less visually dramatic but significantly easier to interpret through touch. The road symbology was refined: roads were raised significantly higher above the terrain and further simplified to improve traceability. Feature spacing was improved throughout, from repositioning labels to reduce interference with surrounding features to more thoughtful braille placement across the print.
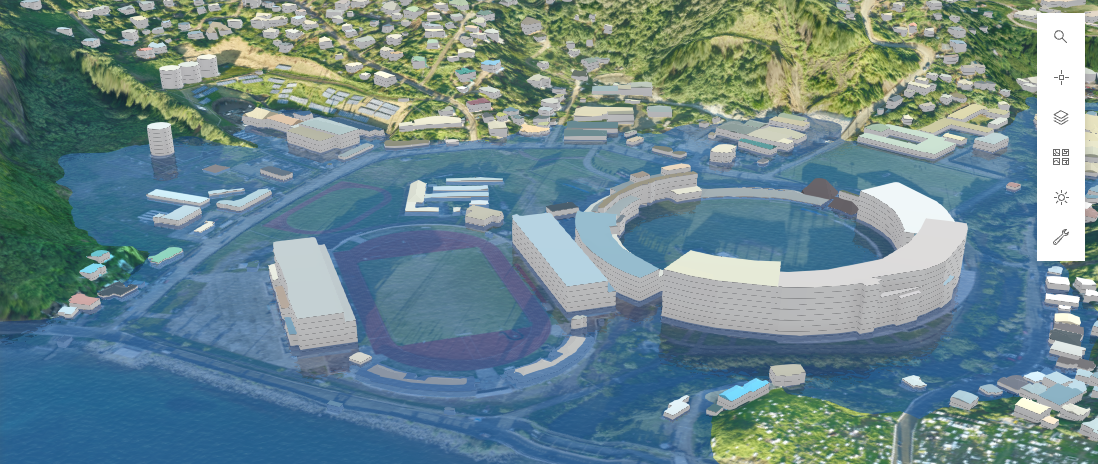
Beyond these accessibility improvements, the team expanded past the terrain and transportation datasets to explore how other map features could be represented through tactile textures in 3D. This testing focused on a smaller, more feature-rich area in St. George’s, Grenada, which included athletic fields, water features, and different types of land cover.
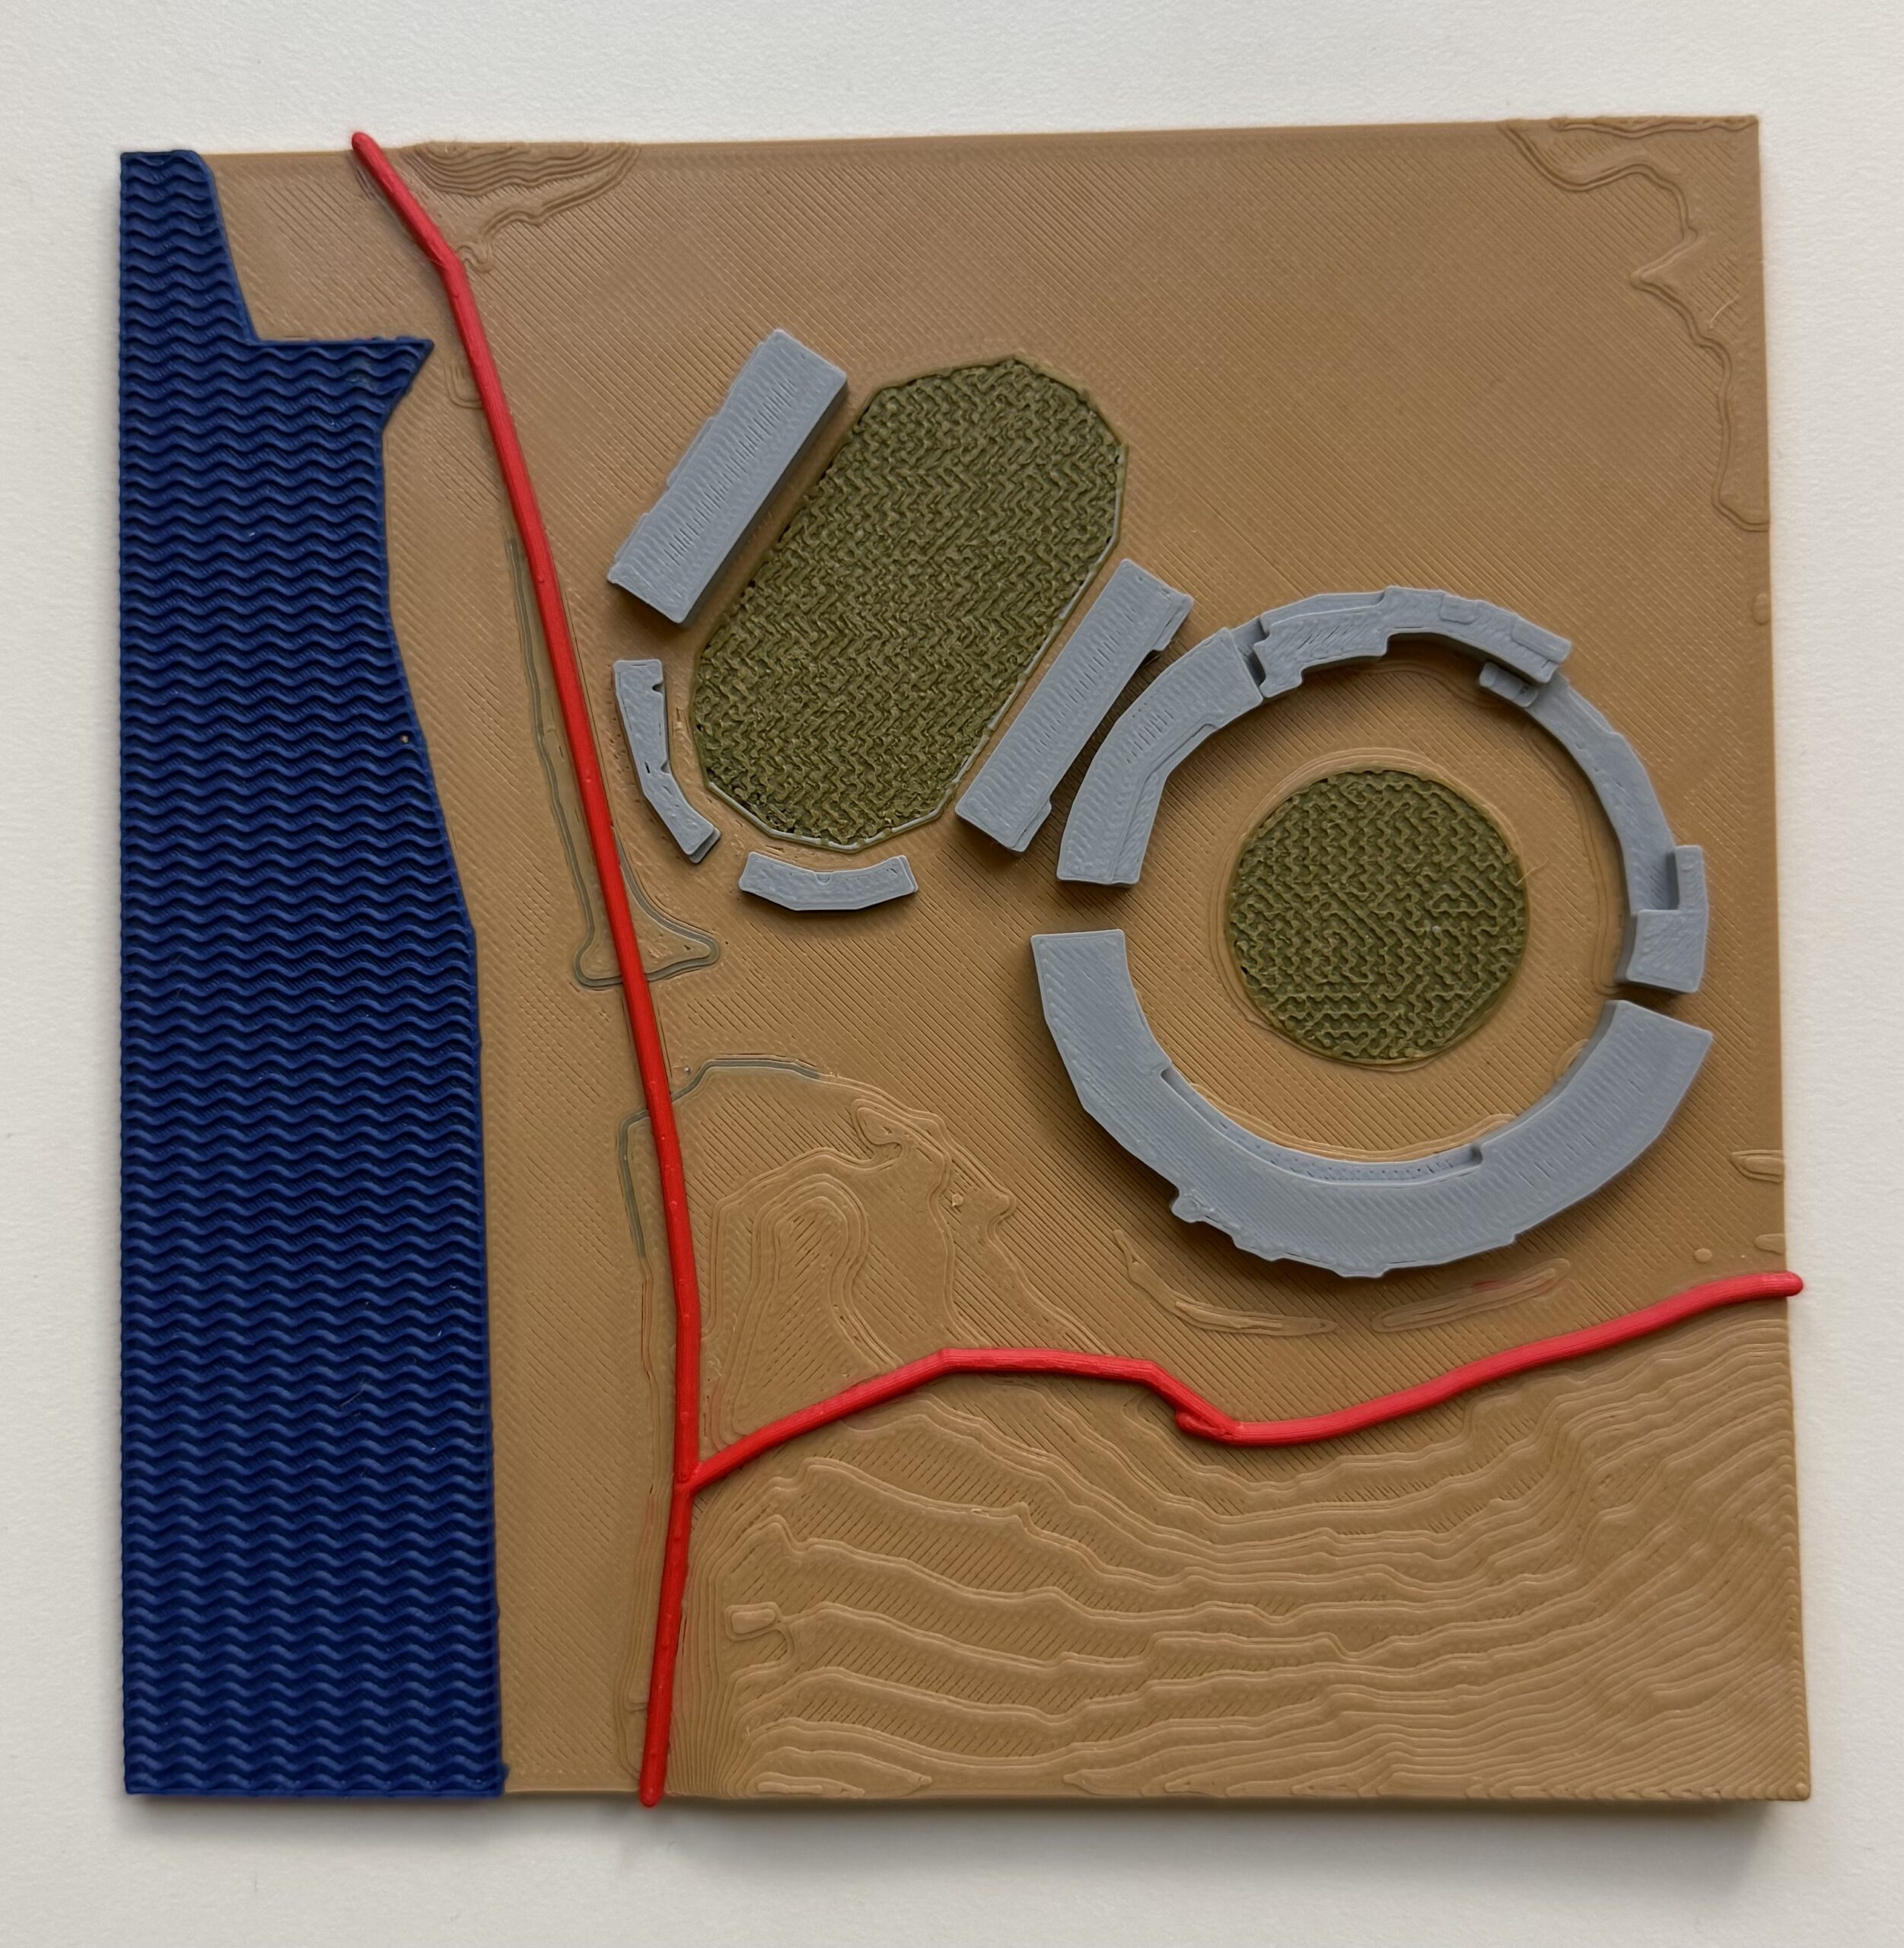
The 3D model for this focus area introduced texture-based symbology to distinguish different land cover and infrastructure types. Water was represented with a wave texture: closely spaced, parallel ridges that rise and fall in a gentle, repeating curve, so running a finger across the surface feels like moving over a series of small, rhythmic ripples. Vegetated areas, such as the athletic fields, received a grass-like texture: a dense, fine pattern of short, irregular raised squiggles that feels rough and slightly bumpy, clearly different from both the regular ripples of the water and the smooth base of the map. Buildings, such as the stadium seating, emerged as distinctly raised, flat-topped blocks standing well above the landscape. Roads stayed at the top of the tactile hierarchy: they remained tall, rounded, and continuous, so they could still be found and followed first, even with new textures surrounding them. Finally, the terrain itself became contextual rather than dominant. With the elevation smoothed and kept low, the gentle slope of the land provides background context, while the textured land cover, buildings, and roads carry the main story.
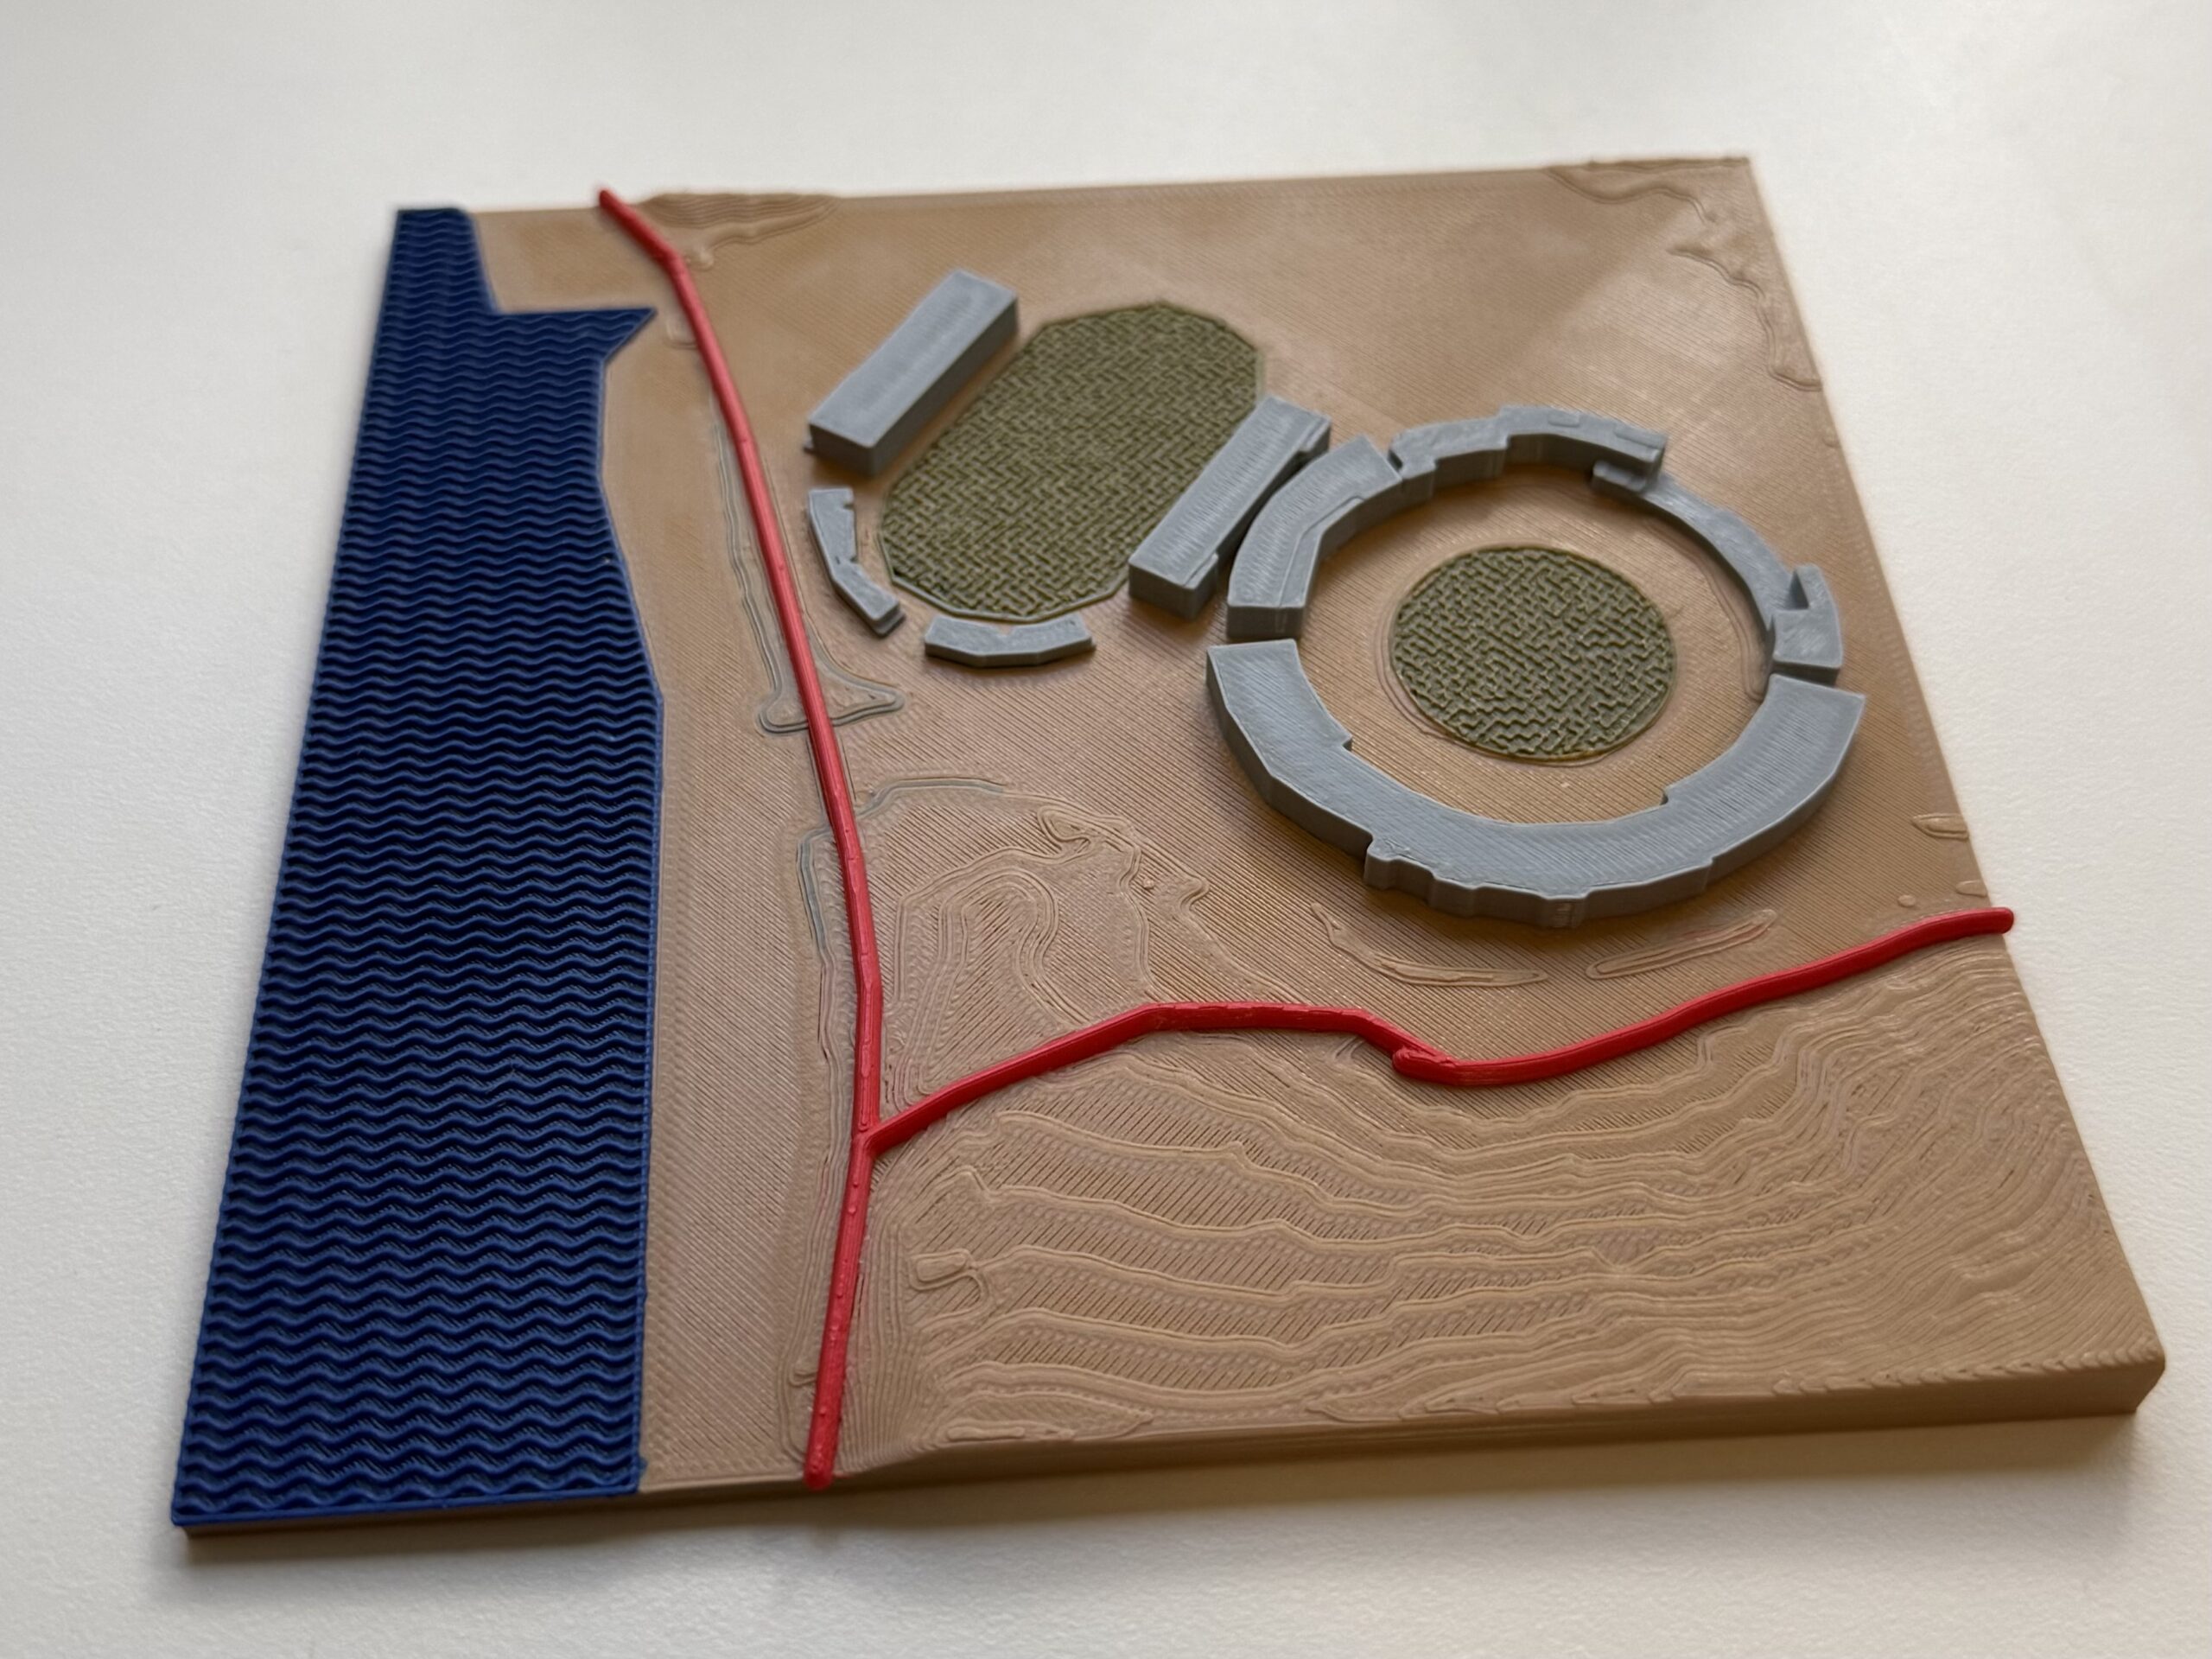
This version represented an important evolution in the research and development, moving beyond the basic landscape of Grenada and aligning more firmly with tactile mapping best practices. Abstraction and purposeful design came together to transform raw geographic information into meaningful spatial understanding through 3D printing.
These models shifted from communicating just a couple of features to communicating geographic relationships between features and the landscape: how roads interact with elevation, where buildings sit within the urban landscape, how vegetation relates to public spaces, and how different geographic features connect to form a larger environment.
User Feedback
While the prototypes successfully demonstrated multiple ArcGIS Pro to 3D printer workflows, they also reinforced an important reality: tactile mapping is not solely about having the right technology at your fingertips — it is about user-centered design.
With user-centered design as the driver, it is no surprise that some of the most valuable feedback came from members of the blind and low-vision community, as well as from accessibility experts. Their feedback gave the project valuable insights for improvement, such as refining braille implementation, simplifying tactile textures, improving legends, and focusing on specific locations, along with broader guidance on designing for how blind users conceptualize space, distance, and place.
Overall, we learned the following from user feedback:
- Smoother terrain surfaces were received well and often improved interpretation.
- Some 3D-printed braille dots had rough edges: rather than smooth little domes, they had an edge that could catch on a fingertip and distract from reading. A new printer nozzle should resolve this in future prints.
- Braille labels should use letter-for-letter (uncontracted) braille rather than contracted braille, where common letter combinations are shortened into a single symbol.
- The legend belongs on the map itself, so it can be referenced while exploring.
- Larger-scale maps of smaller geographic areas often provide more meaningful context than trying to represent an entire region at once. When a focus area is shown separately, a marker on the larger map indicating where it sits helps readers connect the two.
- Tactile exploration is most valuable when combined with contextual information about human activity, urban development, landmarks, and local identity.
Perhaps most importantly, these conversations reinforced that tactile maps should not merely replicate what sighted users see. They should support how blind and low-vision users understand and navigate the world.
Moving Forward
The project’s long-term vision continues to evolve beyond static models.
Future research will explore how tactile maps can become interactive experiences that combine physical touch, GIS data, and audio feedback, which is a common feature of accessible tactile exhibits in museums and a core accessibility support for websites and screen reader use.
Can you imagine a future where accessible tactile maps connect to digital twins, hazard data, environmental monitoring systems, or local storytelling experiences so that everyone has access to the same information? For us, what began as a simple map request became something much larger: an exploration of how geospatial technology can create more equitable access to knowledge, place, and understanding.
The maps themselves may be printed in plastic, but the goal has always been far greater than the object. The goal is to ensure that everyone has the opportunity to explore, understand, and connect with the world around them.

Article Discussion: