In ArcGIS, we have been adding the capability to integrate information from Revit Building Information Modeling (BIM) with GIS workflows. Users asked for better BIM-GIS integration to enable program management, construction, and asset management workflows. In 2018, ArcGIS Pro added the ability to directly read Autodesk Revit data files and with ArcGIS Pro 2.3, we have added the ability to share detailed building data from Revit files as a new type of streamable service, called the Building Scene Layer.
The true power of the confluence GIS and BIM is that the precision of your analysis hones down from a building’s volume to individual rooms, and the reach of your analysis broadens from the site of the floorplan to the entire city, even the earth.
Through this series of blog posts, we’ll be covering several topics to help you take advantage of new building-related capabilities in ArcGIS:
- Georeferencing a Revit file
- Building Scene Layer Packages
- Doing a variety of Site analysis
- Urban analysis – public spaces, right-to-light, best standards for buildings as dictated by City councils.
- Real Estate Analysis – visibility, site analysis
- Sharing the data online through a web scene
- Conducting analysis in the Webscene viewer
In this case, before you can start conducting site analysis and visualizing the model in a geographic context, you need to georeference it and place it at its planned location. You can georeference the Revit model by going through the steps in this blog by Don Kuehne.
Always design a thing by considering it in its next larger context – a chair in a room, a room in a house, a house in an environment, an environment in a city plan.
Conducting Visibility Analysis from inside a Building with ArcGISPro
Whether you are analyzing private real estate or a public space, visibility analysis is a tool to determine metrics of two basic observable aspects of the built and natural environments: objects (buildings, mountains, volcanoes) and open space.
For instance, a real estate analyst may want to analyze the comparative pricing of different rooms in a hill-resort. The resort might want to quantify some of the views from its individual rooms. With interactive analysis tools in ArcGIS, we can start analyzing viewsheds from separate rooms, and then use spatial analyst (Viewshed tool) to quantify the view from each room in a raster format.
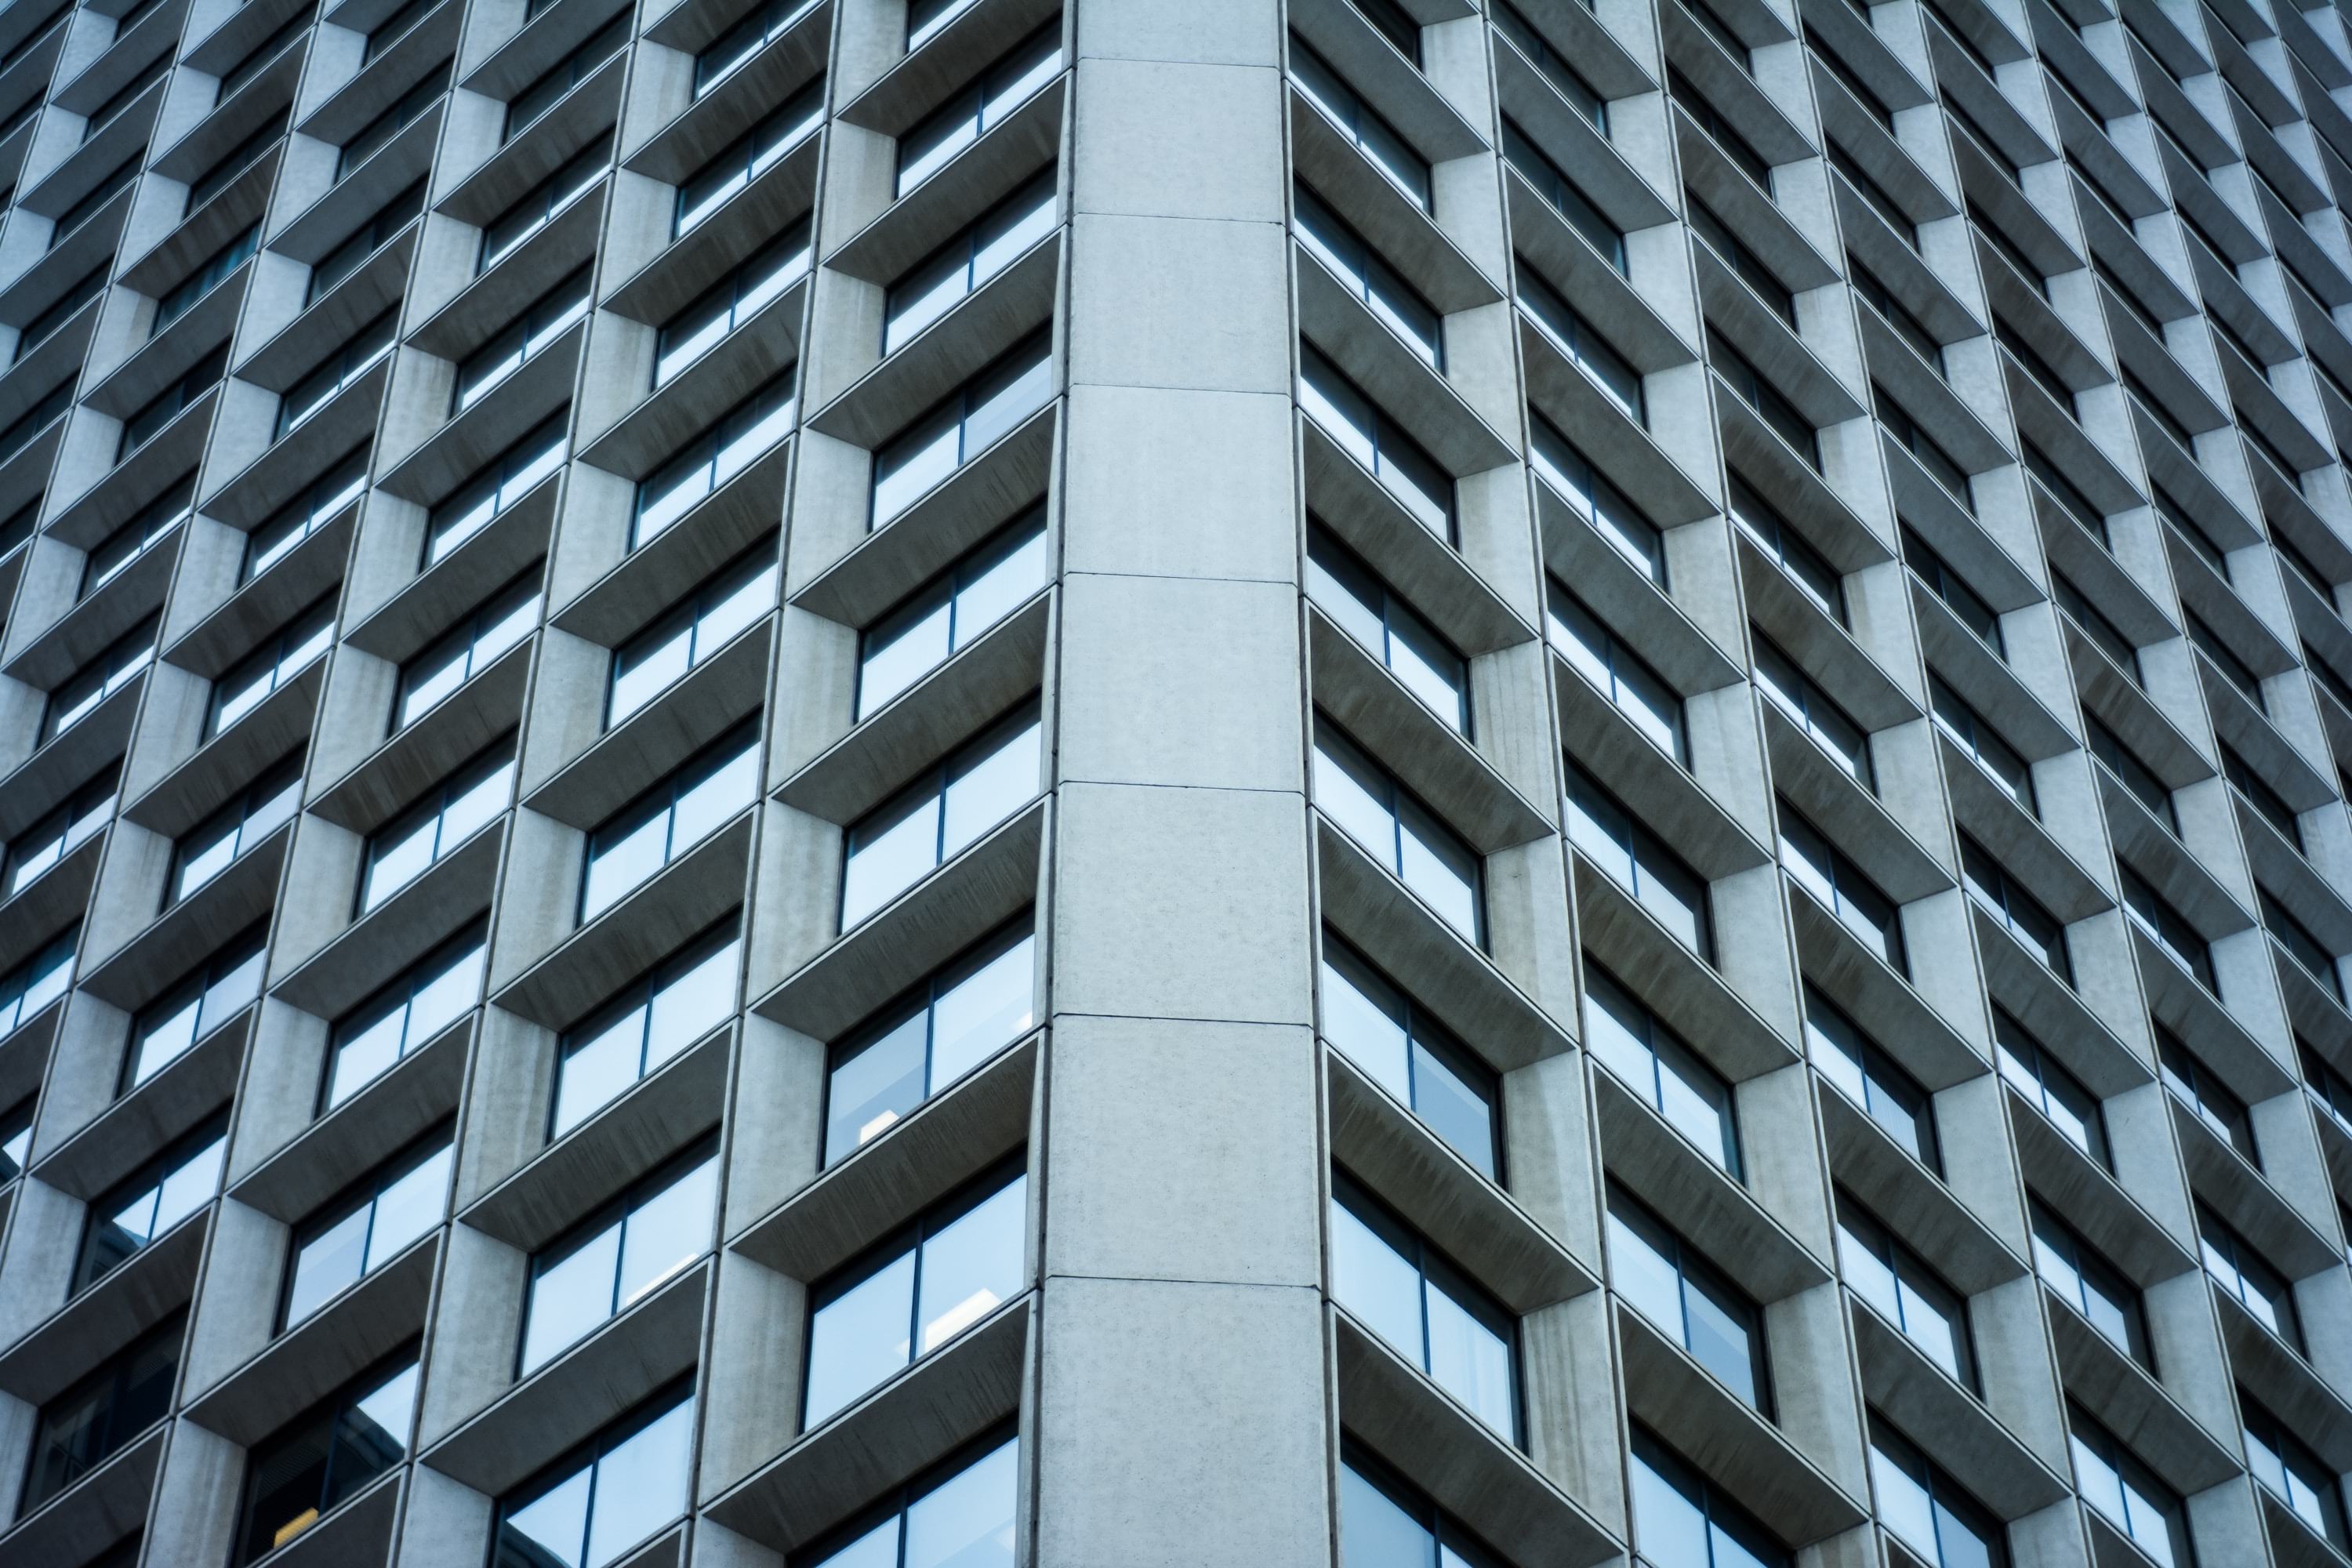
With ArcGIS Pro, we can perform multiple types of viewshed analysis, including both qualitative and quantitative analysis. In this blog, we will start by conducting a quick exploratory analysis using the interactive viewshed tool in ArcGIS Pro. We will use a building on ESRI’s campus to examine the view from a specific lounge. A planner or architect might want to answer questions such as: Can we see other buildings? Can we see the beautiful San Gorgonio mountains or the turtle pond in Building M from our vantage point? The same analysis, of course, may be applied to more complex scenarios for rapid exploration of viewsheds.
We will learn how to modify the input features to model the visibility from a known vantage point. Now your analysis can contain a viewshed from fixed vantage points, and you can evaluate the visibility of the entire area.
To begin with, add the data to your Project folder by downloading the following layer packages. It should have the following layers:
- Admin_BLDG_DA_vr11.rvt – Revit File
- bldgs – 3D features class containinig buildings on Redlands ESRI Campus
We’ll now dive into the step-by-step workflow to add and analyze the Building Scene.
Adding Revit files to a Local Scene
- Open ArcGISPro. Click on Local Scene. Name the project ‘Visibility of BIM’.
Note: In ArcGIS Pro, a 3D map is called a scene. A scene can be viewed in either global or local mode. In global mode, the earth is drawn as a globe and your viewpoint is usually thousands of kilometers from the data. This view is best for very large study areas. In local mode, the earth is drawn in perspective and your viewpoint is usually tens of kilometers from the data. This view is best for small study areas, like our case of Buildings.
It’s a good practice to use a projected coordinate system while working with Revit models, since Revit file are specific to the local context, and the degree of detail may be lost if the projected coordinate system is not used. This scene uses the NAD 1983 2011 StatePlane California V FIPS 0405 Ft US coordinate system.
The units of the Revit file should match the linear units of the projected coordinate system. If the Revit file was developed using metric units (m, cm or mm) the projection should be a projection that uses the meter as the linear unit.
- We navigate to the area in which we will place your model. In this example, it is the ESRI campus in Redlands. To quickly navigate to the area, in the ‘Map’ tab on the Ribbon menu on the top, Click on ‘Locate’.
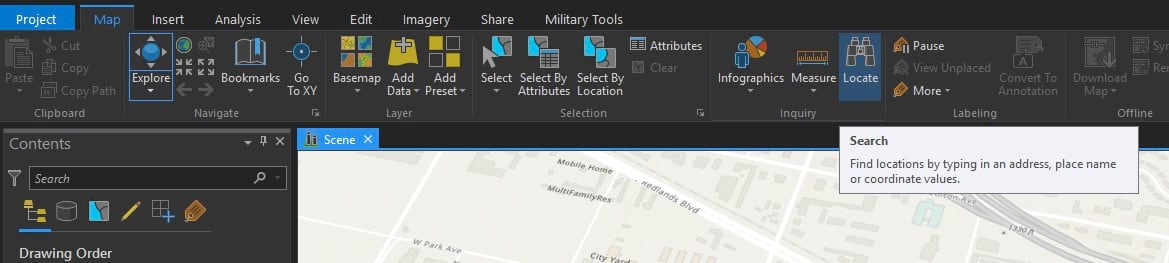
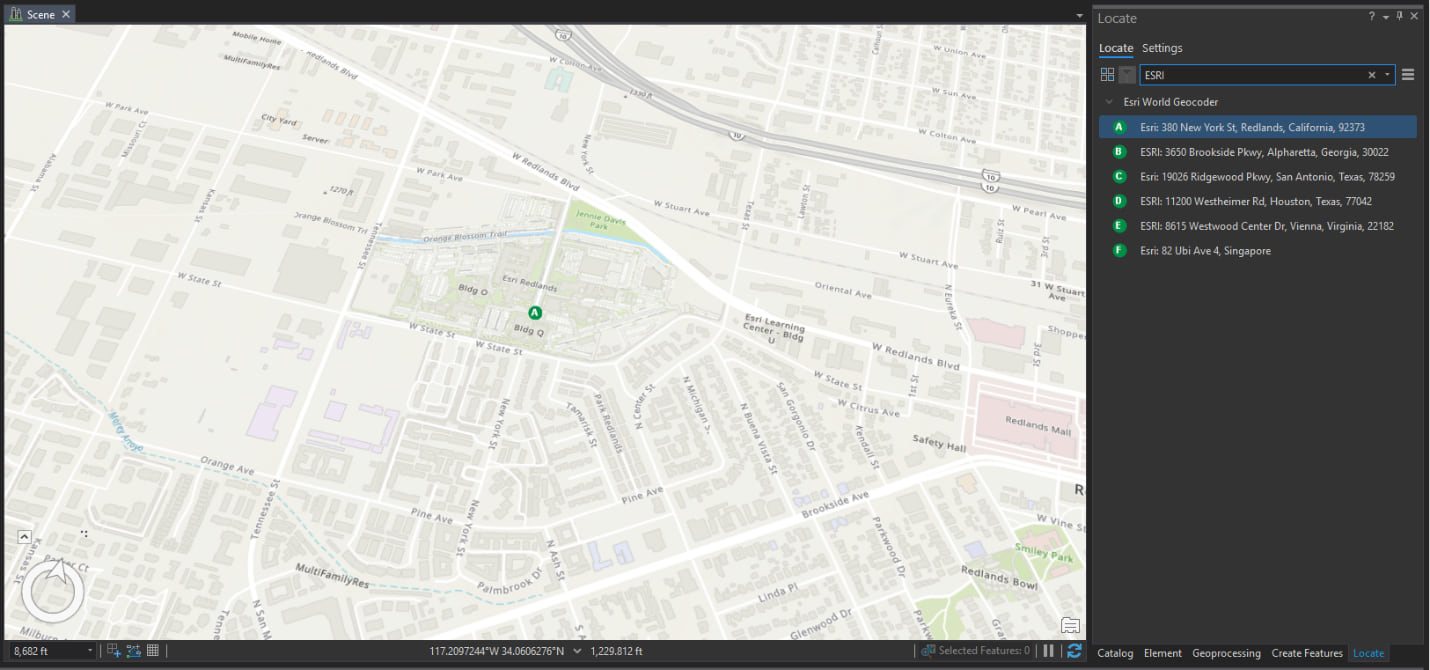
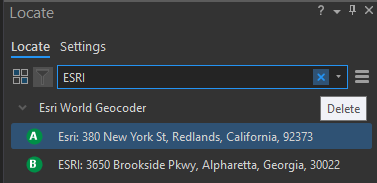
3. In the Search bar, type “ESRI” and press Enter. Double-click on the “Esri: 380 New York St, Redlands, California, 92373” option. The scene pans and zooms to the ESRI campus on Redlands.
4. Press “x” on the Search tool to remove the circle symbology and close the Locate pane.
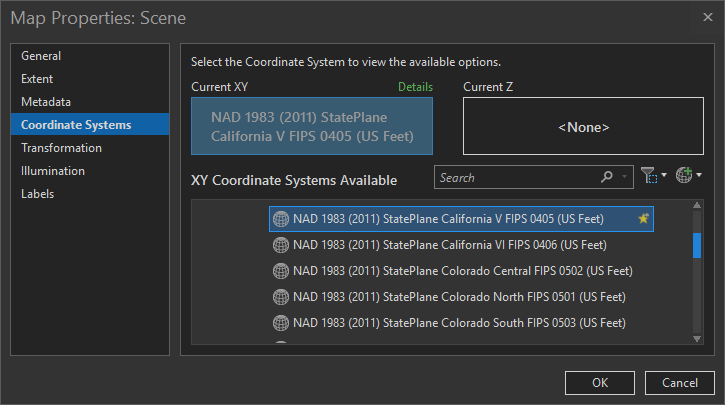
5. Right Click on Scene in Contents pane. Go to Properties.
Click on the ‘Coordinate System’ tab. We know our coordinate system, in the Search bar, paste “NAD 1983 (2011) StatePlane California V FIPS 0405 (US Feet)”.
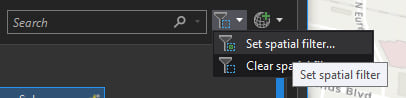
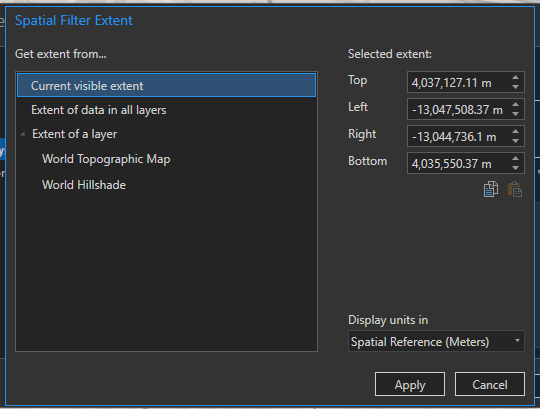
Note: If you do not know your coordinate system, you can click on the spatial filter button, next to the Search box. In the Spatial Filter Extent Window, Click on “Current Visible Extent”. This will tell the filter to give the relevant coordinate systems in the area we have zoomed to. (You can also set filters on the basis of other layers in the map if you have any, and the filter will look of coordinate systems in the extent of that layer.)
The XY Coordinate Systems available have now been filtered by your area. You can open and explore the Projected Coordinate systems available for the area and choose one. Note that our chosen coordinate system is also present in Projected coordinate system -> State Plane -> NAD 1983 (US Feet) -> NAD 1983 (2011) StatePlane California V FIPS 0405 (US Feet). Click Apply.
6. Click OK. The layout of the existing topographic map will change to fit the new projection
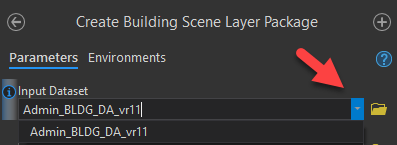
7. Locate the Admin_BLDG_DA_vr11.rvt file. Drag and drop the Revit model into the Scene window, or the Contents pane.
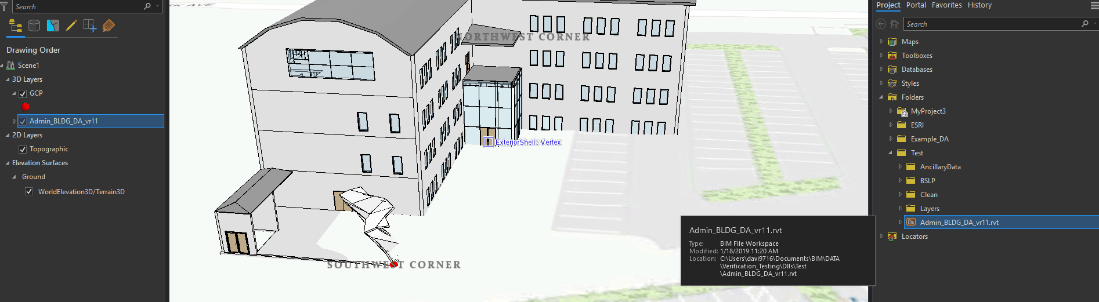
Note: A Revit model may be composed of 5 datasets (Architectural, Electrical Mechanic, Piping and Structural) from Catalog. When you drag and drop a Revit model into ArcGIS Pro, an additional ‘External Shell’ Discipline is added. This is purely a viewing category, which is added by ArcGIS Pro to increase the drawing performance of the scene and not a part of the Revit model itself.
Create a Building Scene Layer Package
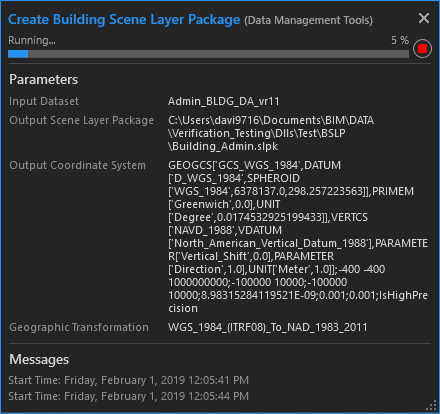
To make the performance of the Building model in ArcGIS Pro better, and to facilitate online sharing, we create a Building Scene Layer Package from the model.
- Open Geoprocessing tool “Create Building Scene Layer Package”. Pick the Building layer in your scene that you would like to publish.
- To Output Scene Layer Package
- Pick a location to save the .slpk
- Name the file Building_Admin
- Output Coordinate System
- Select GCS_WGS_1984 / VCS:NAVD_1988
- Transformation should be WGS_1984_(ITRF08)_To_NAD_1983_2011
- Click Run.
2. Browse to find Building Scene Layer Package – Building_Admin.slpk, created in step 1
- Drag and drop slpk into the scene. Deselect Admin_BLDG_DA_vr11 Revit model from the Table of Contents.
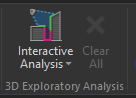
Interactive Analysis
Finally! Now that we have added our building model to the scene, we can start conducting exploratory analyses on it. For visibility, we can set our vantage points to different areas of interest within the building and set up our viewsheds.
- Locate the ESRI.gdb database. Add the bldgs feature class from the database.
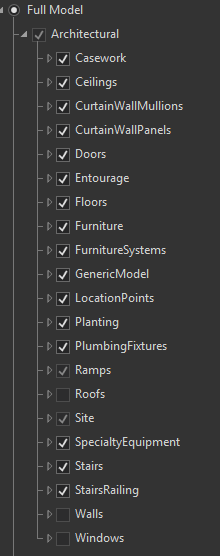
- Prepare the Building. Click on “Full Model” in the Contents pane (This will load the model in its entirety (as opposed to Overview which has just the exterior walls).
Click on the Analysis tab in the menu.
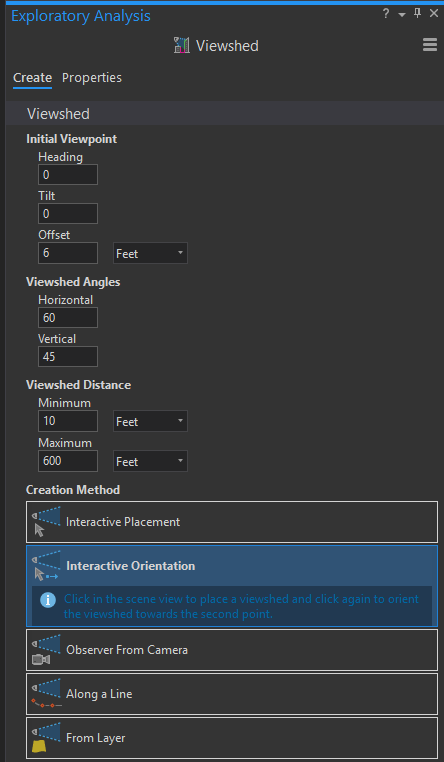
3. Go to Interactive analysis and click on Viewshed. The Viewshed pane opens allowing us to interactively place a viewshed in the view.
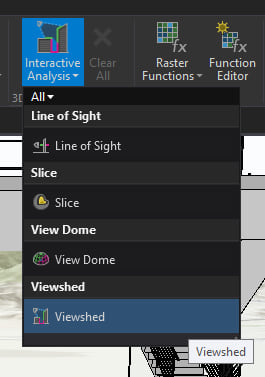
4. Click on Interactive Orientation, which lets us define a viewshed and then the orientation of the observer with a second click.
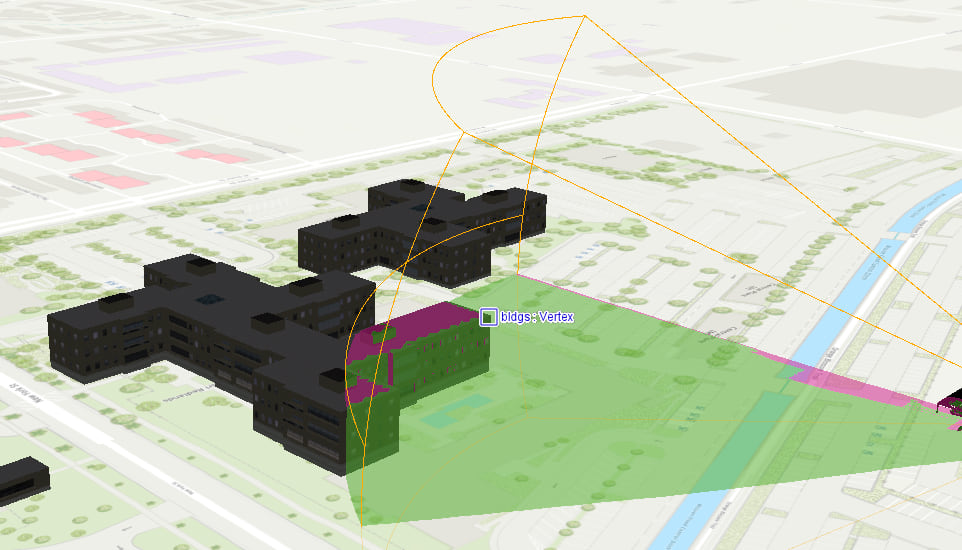
5. Now. we can make site-related exploratory questions. Especially, we will ask questions in context of different rooms and spaces within the building, and how they interact with the larger environment outside. For instance, Is the area around the closest building (Building MN) visible from the lounge area on the second floor of our Revit model? To define this, we’ll need to go inside the building.
6. Deselect the Roofs, Walls and Windows in the Architectural Discipline in the Contents for the model. You can now see inside the building’s top floor.
7. For this exercise, the area we’re interested in is the lounge, which may be a waiting area for visitors or a relaxation space for employees. Zoom to the lounge area in the South East corner (closest to Building MN).
Make sure that snapping is enabled in the toolbar below the Scene view. (For ease of navigation, press the C key while using mouse controls to enter explore mode).
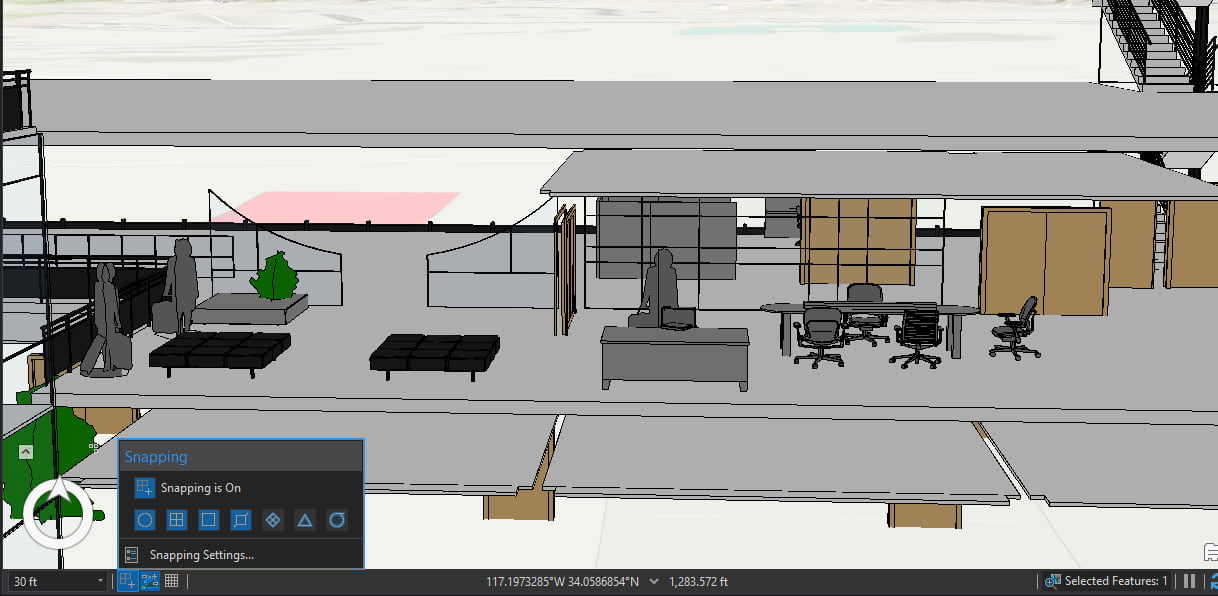
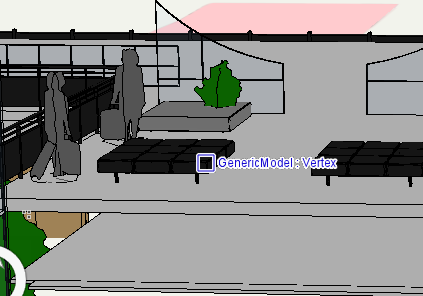
8. Snap to the “GenericModel: Vertex”. Click to define this as the observer point.
9. While pressing ‘C’ navigate to the north vertex of building MN and snap to the vertex (the point is “bldgs: Vertex”). Click is to define this as the target. This helps us define the general direction of the viewshed.
10. Reselect the Walls and the roofs in the model, not the windows. You can see the parts of the vision that are excluded from view. A part of the parking shed; the Turtle pond is occluded from the view.
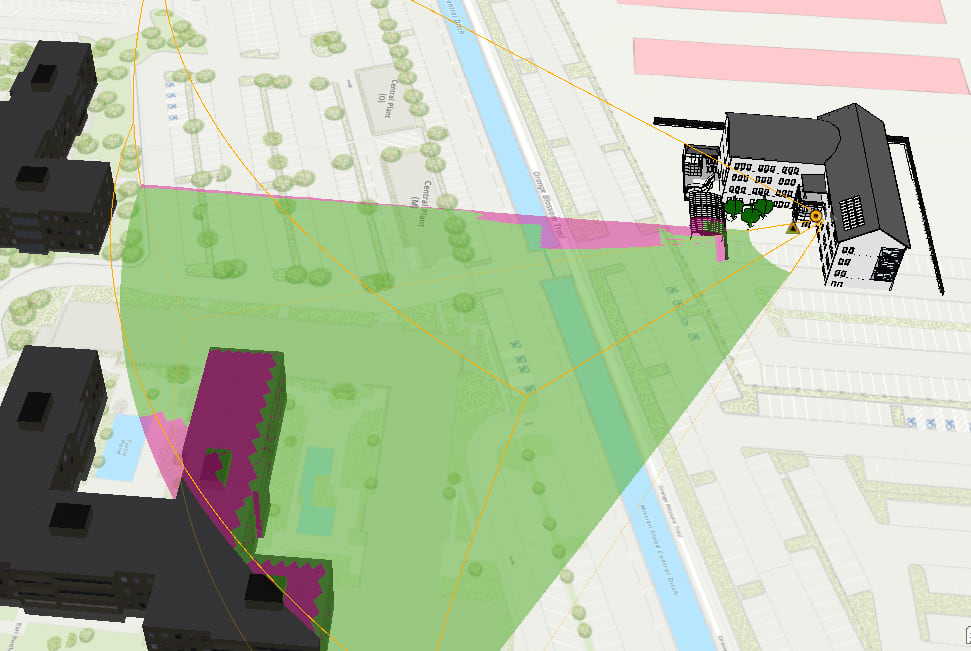
You have visualized the visibility from your model and how it would fit with other buildings and the natural landscape around the campus. You can use the same process to define viewsheds from other observer and target areas of interest.

Commenting is not enabled for this article.