In Part 1 of this series, we introduced WorldPop’s 1-km gridded population layers as recently added to The Living Atlas of the World. In part 2, we continue by sharing how to use ArcGIS Pro to explore and get started using these multidimensional gridded population layers.
But first, what do we mean by “multidimensional”?
A multidimensional dataset stores collections of data values, called “variables”, that occur along “dimensions” such as time and potentially others such as depth, height, type of sensor, or even specific sensor IDs. Common variables are air temperature, ocean salinity, or in the case of the WorldPop layers, total population, population density, and age and sex cohorts. For the WorldPop layers there is one dimension, time, expressed as the year for each annual population variable.
Multidimensional data are different. While a feature class or a raster dataset can effectively represent data about a single type of measurement or topic, a multidimensional dataset can represent arrays of observed values and dimensions about one or more measurements/topics (variables). A simple multidimensional raster dataset can be thought of a stack of rasters, where each raster slice in the stack represents the variable at a specific time or time interval. Multidimensional datasets do not duplicate dimension values in order to apply them to two or more variables.
ArcGIS Pro can Display and Analyze Multidimensional Datasets
We recommend reading the ArcGIS Pro help topic about multidimensional raster data to learn more. Next, we will present what we have found to be most useful for working with the multidimensional WorldPop layers in ArcGIS Pro.
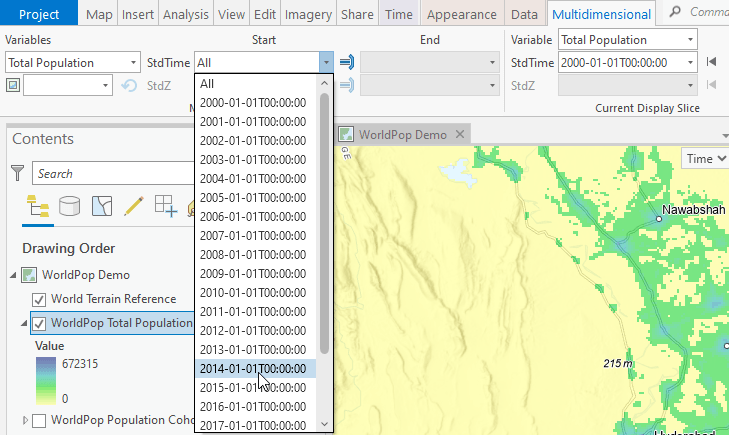
ArcGIS Pro’s Multidimensional tab:
- When a multidimensional layer is selected in the Contents Pane, the multidimensional tab will be shown. On the left side, the Multidimensional Extent group determines which slices (unique combinations of a variable and dimension values) of a multidimensional layer will be analyzed. The default when a multidimensional layer is added is all slices. To limit a multidimensional layer to just one relevant slice requires having only one variable and one dimension value selected.
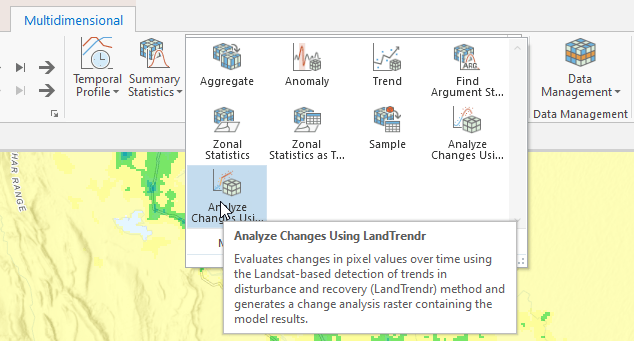
- The tools in the Analysis group use inputs of multidimensional raster layers to produce summaries and multidimensional output. In parts 2 and 3 of this series, we will cover some common workflows with these tools.
An important decision is whether to use the WorldPop multidimensional image service layers as the inputs for analysis in ArcGIS Pro, or whether to first copy the extent of your study area to your local disk. Using image service layers in ArcGIS Pro requires an ArcGIS Server to first fetch extents of the imagery from the data on the server, and send it to the ArcGIS Pro client to start the analysis. This requires at least two to five times longer than would be needed if analyzing the same imagery stored on a local hard disk; with slower Internet connection speeds, this can exceed even fifty times slower. Thus, we recommend that if you will be running more than one tool on your study area extent, then creating a local copy of your study area will likely result in completing your in-depth data exploration or analysis tasks faster.
The above decision is predicated on analyzing a study area, rather than the entire world. The reason these WorldPop data are delivered using a service is because they are large: the 1-km cell size collection of population data includes 842 global slices created from nearly 200,000 source .TIF datasets that total over 1.5 Tb on disk. Thus, we recommend checking your available disk space before starting. The larger the study area, the longer it takes to complete an analysis. We recommend breaking large study area extents in to smaller extents of between 500 x 500 and 1000 x 1000 cells, which cause the entire study area to be processed faster.
Because working with multidimensional data is different than working with traditional GIS data, we recommend starting with a very small study area to learn the nature of each tool’s output. This recommendation is true for all GIS analyses, but worth restating in this context.
To create a local copy with more than one multidimensional slice, the fastest method is to use the Subset Multidimensional Raster tool, which is in the Data Management group at the far right of the Multidimensional tab:

To create a local copy of an extent of just one slice, use the Copy Raster and Export Raster tools. With the WorldPop Population Cohorts layer, or any layer with more than one multidimensional variable, the task of isolating variables and dimension values is easier to accomplish by first using the Make Multidimensional Raster layer tool to create a layer with the desired combination of variable and year.
Important Settings and Recommendations:
- The Subset Multidimensional Raster will not copy the multidimensional transpose, which facilitates “vertical” queries through multiple slices. Use the Build Multidimensional Transpose tool to create a transpose for your study area dataset.
- Set the output format to CRF (Cloud Raster Format), as it is the only ArcGIS raster dataset format that supports multidimensional output and writes and reads faster than any other format. Even if the output is a single slice, CRF is fastest because it is the native raster format in ArcGIS Pro; otherwise ArcGIS Pro will write a temporary .CRF dataset and then copy it to the specified output format, such as .tif. Not using .CRF as your output format writing output rasters twice, taking at least twice the time.
- Check to be certain the output workspace is not a geodatabase – it should be a folder.
- Do not create pyramids – these will not speed up analysis or accurately portray population.
- If the output dataset will be visualized, we recommend creating statistics – these will represent the study area. If the dataset is intermediate data, and statistics are not required by the next tool in the process or model then do not produce statistics, as this adds time.
- Use LERC 0 (zero MaxError) compression – this matches the source data on the server and creates the smallest footprint for the data on your disk and enables the fastest performance for reading the local copy. Zero MaxError is required to ensure the estimated population values for each output cell do not change from those originally calculated by WorldPop.
- Do not use output cell size – this could cause resampling to occur and corrupt the data values.
- Do not use a snap raster, which will cause the cells to be offset from the locations where WorldPop’s analysis estimated population.
- If your computer has additional CPUs, use the Parallel Processing Factor environment setting*. We recommend between 4 and 6 CPUs, if they are available. We also recommend not using more CPUs than your computer’s total minus two, i.e., leave two CPUs for your operating system and other processes to continue to operate.
*Our testing shows Parallel Processing Factor will not improve speed for single slice outputs of the WorldPop layers when using the Copy Raster or Export Raster tools; this is because the bit depth is floating point. Parallel Processing especially helps the Subset Multidimensional Raster tool with larger study areas such as those greater than 500 x 500 cells; about the size of New Mexico with these 1-km cell size image service layers.
To conclude this post, we wish to acknowledge that learning to work with multidimensional data and services are skills to acquire. The acquisition of these skills takes time, usually a few weeks, before gaining comfort with the user interface and the ability to productively design workflows that answer the questions that multidimensional data makes it possible to answer efficiently. In Part 3 of this series, we will introduce using Zonal Statistics in ArcGIS Pro to create custom summaries of population data.

Article Discussion: