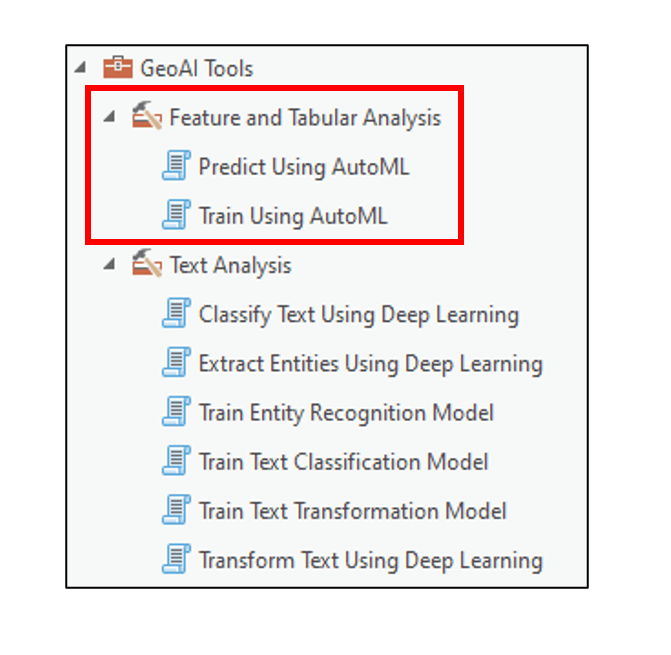
At ArcGIS Pro 3.0, we introduced the GeoAI toolbox, which brings new AI and machine learning algorithms to ArcGIS Pro. This toolbox contains eight geoprocessing tools that help to solve Natural Language Processing problems (Text Analysis Toolset – 6 tools), and classification and regression problems (Feature and Tabular Analysis Toolset – 2 tools).
In this blog article, we’ll focus on the two tools within the Feature and Tabular Analysis toolset: Train Using AutoML and Predict Using AutoML. We’ll briefly explain what AutoML is and why it’s useful, and then see an example of it applied to a real-world spatial data science problem.
What is AutoML, and why use it?
ArcGIS has a powerful set of existing tools that allow you to apply machine learning algorithms to solve complex, real-world problems. These tools, however, are typically not used in a vacuum; they are most often used as part of a broader set of steps within the machine learning process. This process starts with identifying the business problem and formulating the problem statement or question, and is then followed by data collection and preprocessing, algorithm selection, model training and tuning, model evaluation, and finally prediction.
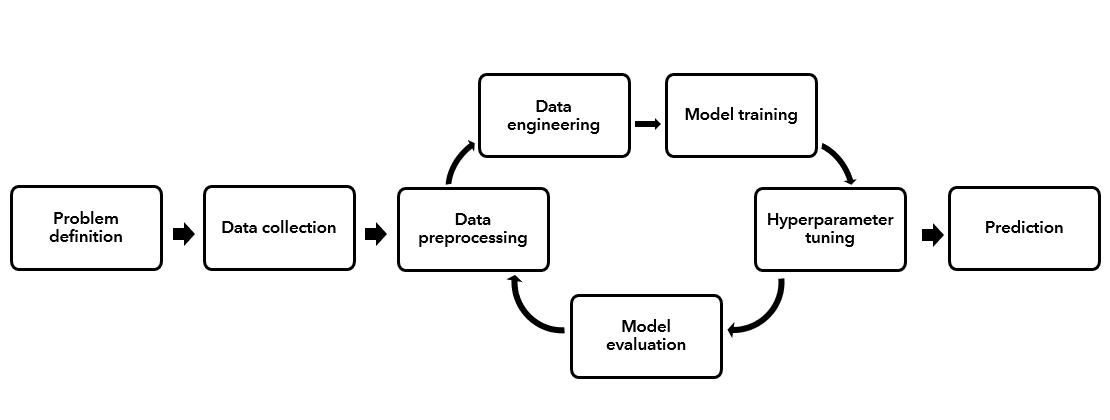
It is important to note that this is an iterative process that can involve extensive experimentation and repetition. You may get to the model training step, then realize that you need to go back a few steps to collect more data, preprocess it in a different way, or choose an alternative algorithm, then potentially do it all over again!
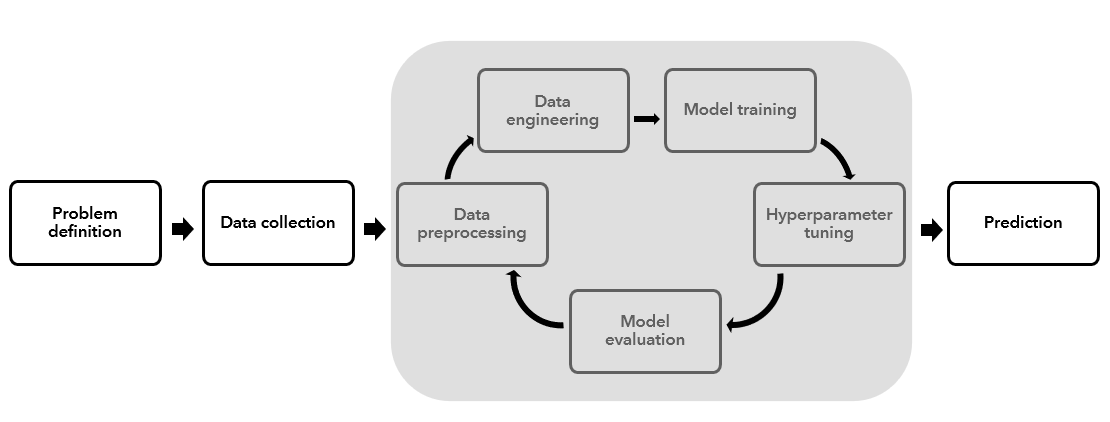
Automated Machine Learning (AutoML) is an approach aimed to automate much of this process, including data preprocessing and engineering, model training, hyperparameter tuning, and model evaluation. In doing so, it allows the user to repeat this process for many different machine learning algorithms, which helps them identify the best algorithm for their specific problem and data.
As a result of its automated nature, AutoML can be beneficial for users with all levels of machine learning experience.
If you are new to machine learning, AutoML allows you to bring your data in as is, and quickly develop quality models that you can build upon. It also produces output reports with charts and explanations to help you understand some of the details that go on behind the scenes.
If you already have a solid background and understanding of machine learning, AutoML can be used to do some of the time consuming iterating and experimenting tasks, and therefore you can focus your time and energy on other tasks that require your expertise. Think of AutoML here as a productivity booster, and as a way generate good baseline models with minimal human input and time.
Using AutoML to study water access in Uganda
To demonstrate the AutoML tools, I’ll focus on the issue of clean water access in developing countries.
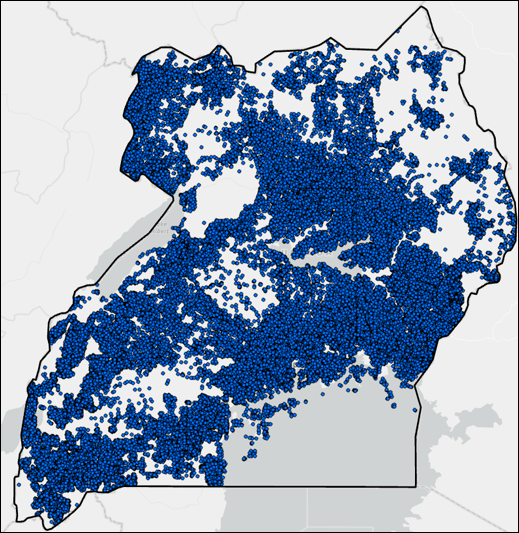
In Uganda, nearly 90% of the population lives in small towns and rural areas, and roughly two thirds of this group lack access to safe water. Those that do have access often have to walk long distances to collect clean water from various types of pumps or tapstands (a.k.a. “water points”).
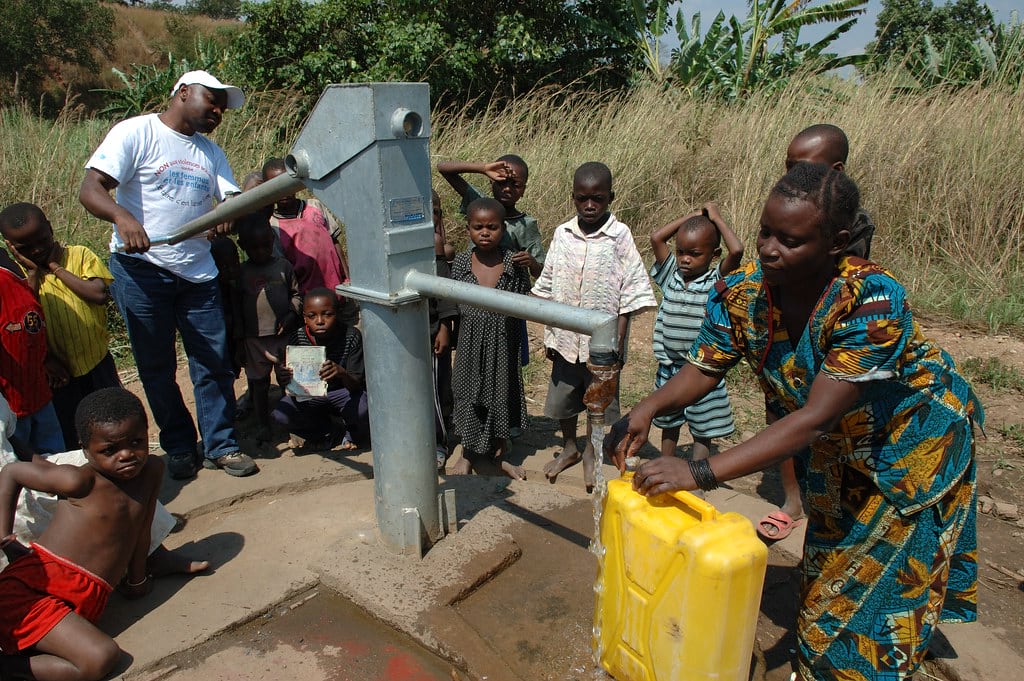
The Global Water Challenge has an initiative called the Water Point Data Exchange, which curates and provides data on the locations of these water access points. Currently, there are nearly 500,000 water access points available for 54 countries. Over a quarter of these water points are located in Uganda.
Using the new AutoML tools in the GeoAI toolbox, I’ll create models that predict whether a water point is functional or not, based on a large number of non-spatial and spatial covariates. The non-spatial covariates are part of the water point dataset, and include:
- Install date
- Water source (e.g. borehole, well, spring, harvested rainwater, surface water, etc.)
- Water technology (e.g. hand pump, tapstand, mechanized pump, rope and bucket, etc.)
- Management (e.g. community, school, religious facility, healthcare facility, private person, etc.)
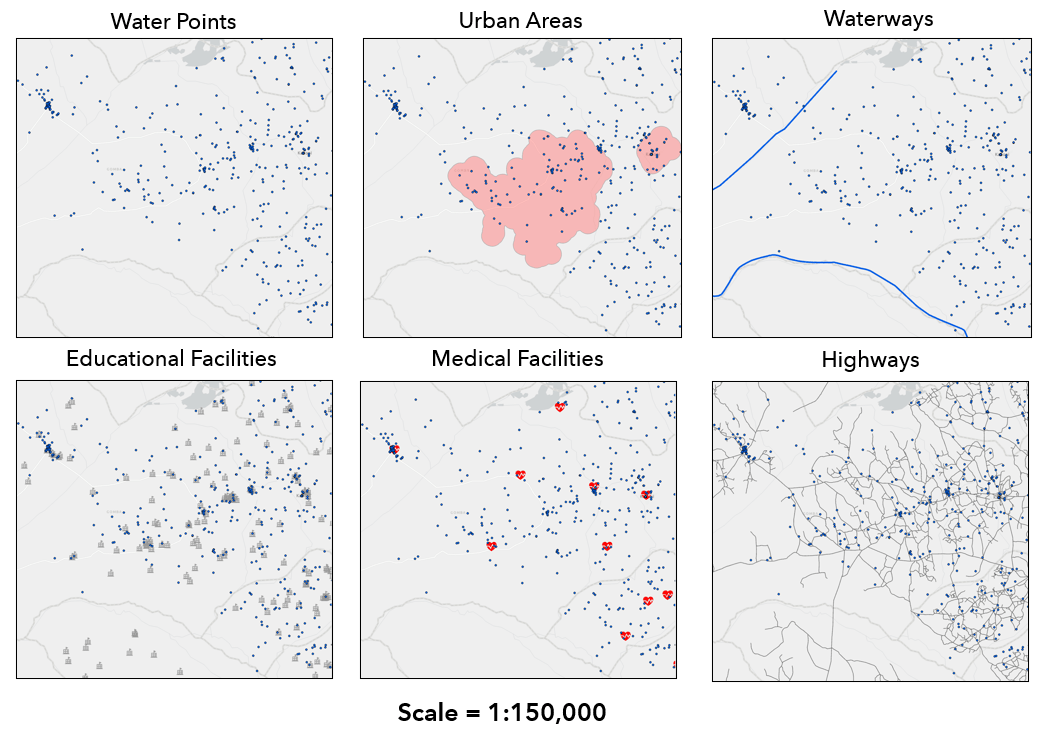
The spatial covariates represent geographic features or processes that we hypothesize will have an impact on whether a water point is functional or not. These are derived from various geospatial raster and vector datasets, and include:
- Surrounding population within 1 kilometer of each water point
- Distance from each water point to nearest urban area, waterway, educational facility, medical facility, and highway
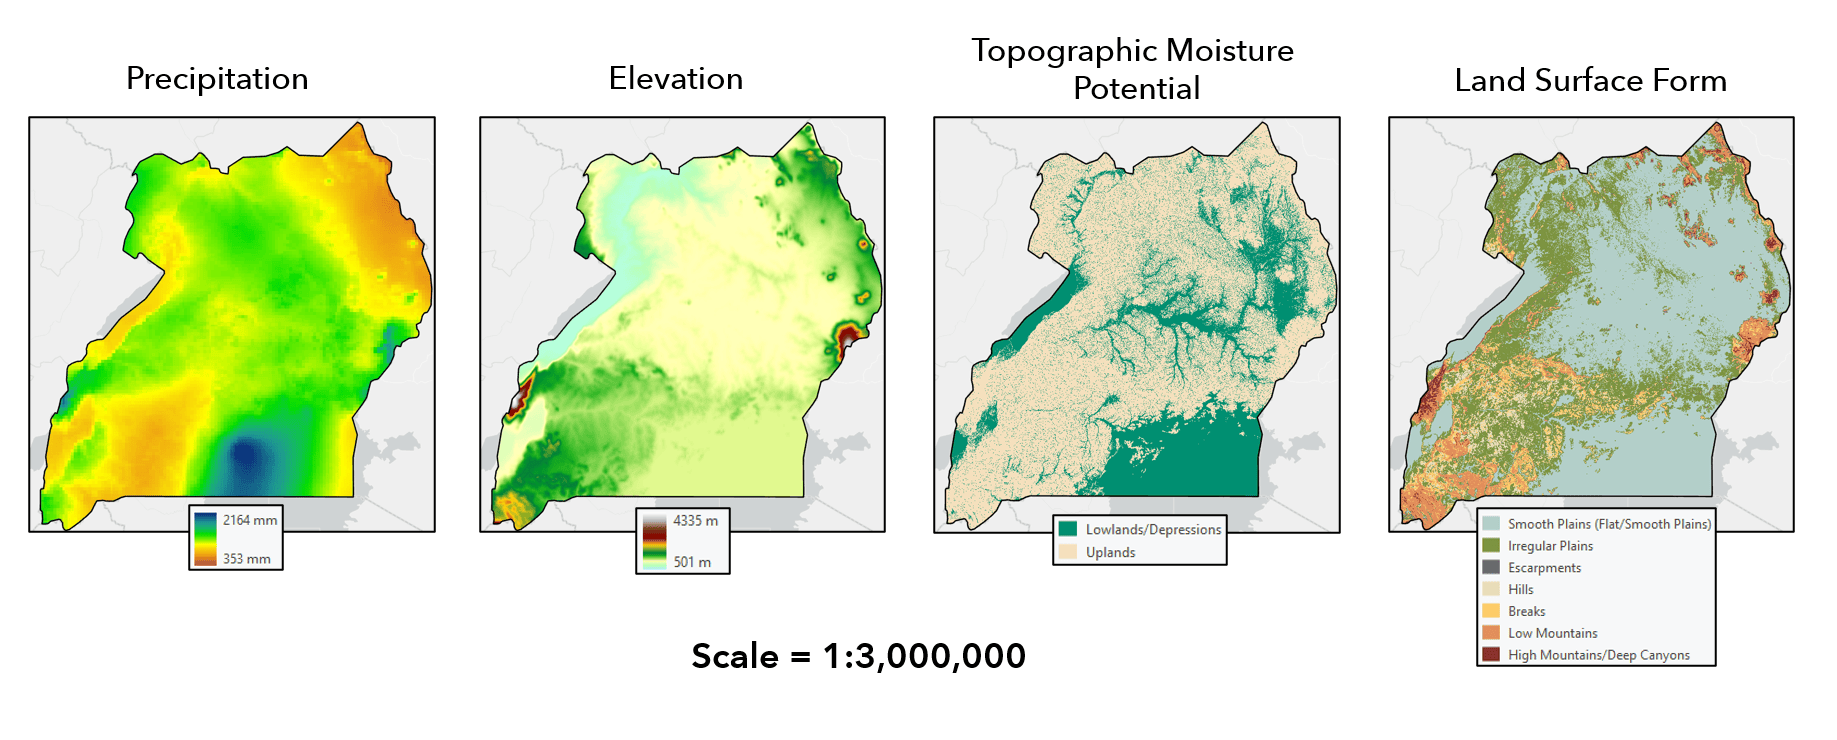
- Underlying land surface form (e.g. plains, mountains, hills, etc.)
- Underlying topographic moisture potential (e.g. lowlands/depressions, uplands)
- Underlying elevation
- Local average precipitation
AutoML workflow
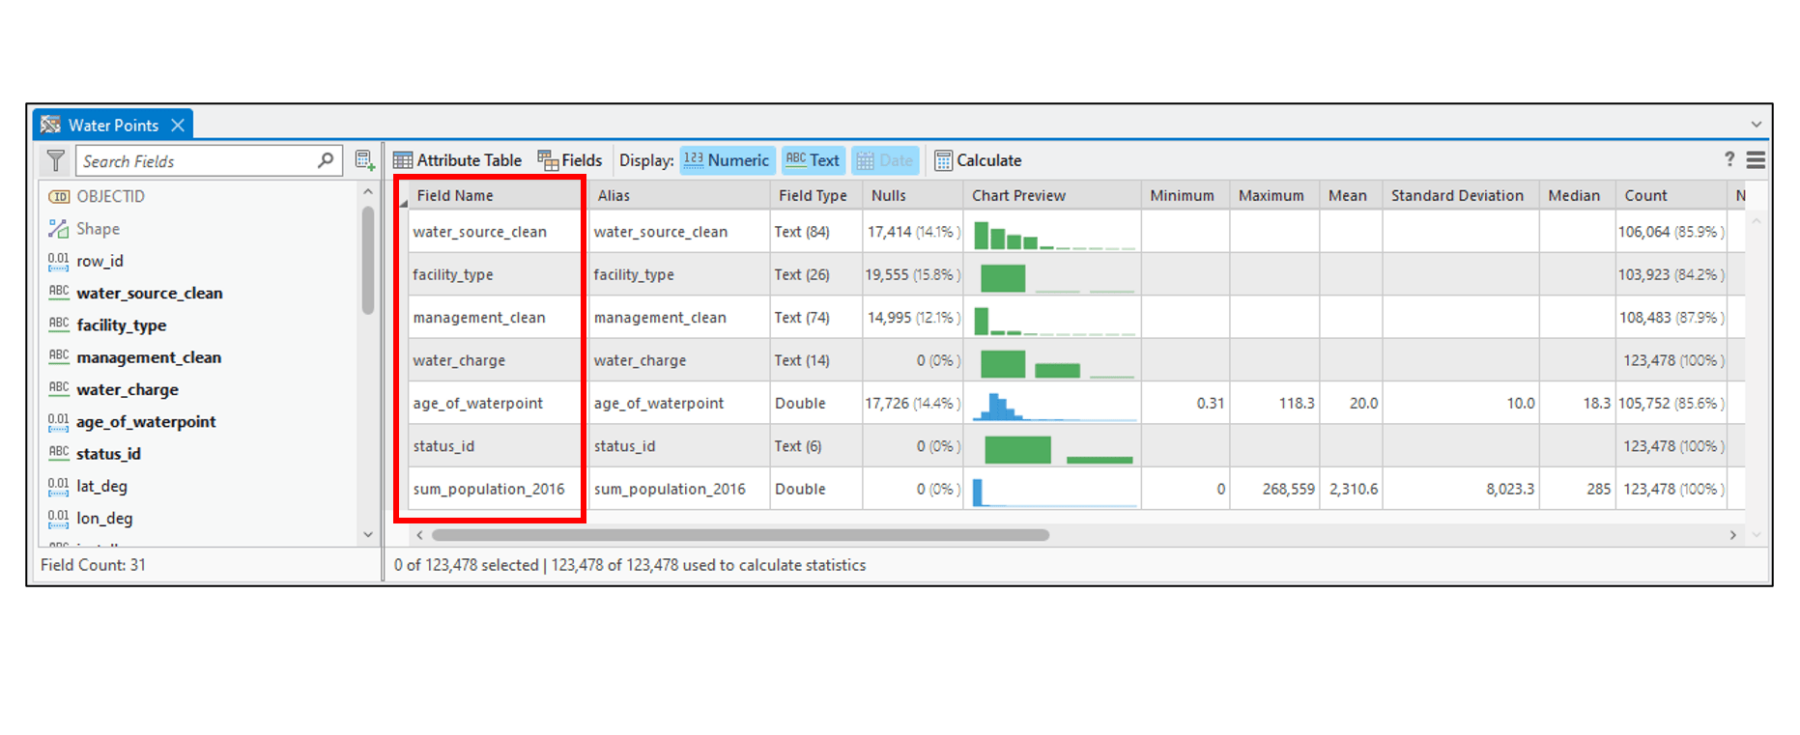
In any machine learning project, the most important first step is to get to know your data—what are the fields, do they represent the processes you are trying to study, is there data missing in them, are there incorrect values or outliers, do you need to create new columns from existing ones, etc. All of these questions are addressed during the Data Engineering phase of the project. This is where you clean, transform, wrangle, explore and otherwise prepare your data for modeling.
Using the Data Engineering view in ArcGIS Pro, as well as the ArcGIS API for Python and the pandas Python libraries within an ArcGIS Pro Notebook, we did some basic data preprocessing and engineering to prepare the data for analysis. These steps included: sanitizing field names, identifying null and missing values, dropping unnecessary fields, and engineering new fields based on existing fields or ancillary geospatial datasets.
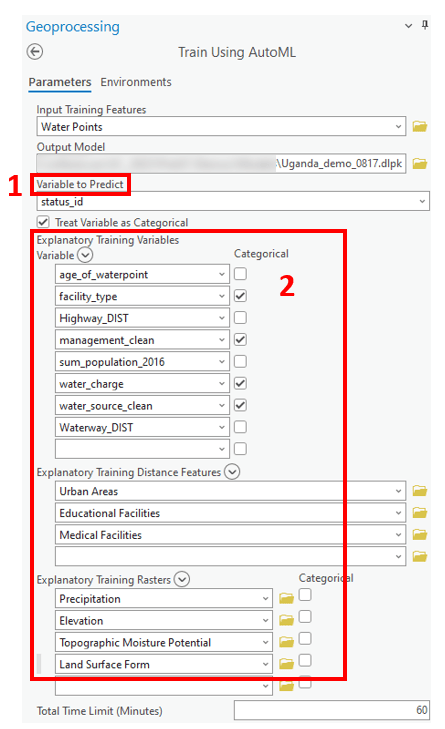
Once we’ve prepared our data for analysis, we’ll open the Train Using AutoML tool and explore the parameter options.
1. First, we’ll specify the variable to predict as the “status_id”, which is whether the water point is functional or not. Given that this is a binary classification problem, we’ll check the box to “Treat Variable as Categorical”.
2. Next, we’ll specify our independent variables, which include the non-spatial covariates from the Water Point Data Exchange, as well as the spatial covariates in the form of explanatory training distance features and explanatory training rasters.
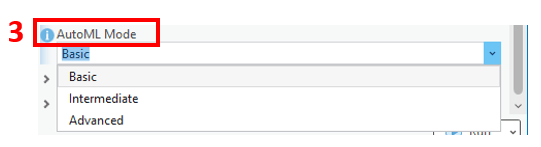
3. Then we’ll choose the AutoML mode. This parameter allows you to select from three different modes, which you choose based on whether your focus is model explainability or performance.
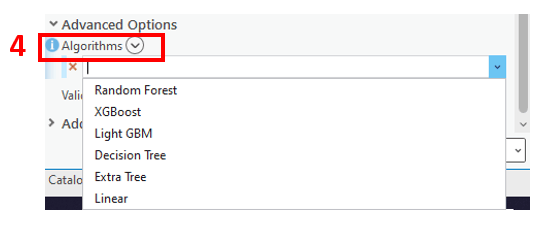
4. Under the Algorithms parameter, you can choose from several different ML algorithms. For example, the tool offers several gradient boosting algorithms, which are some of the most efficient and highly performant algorithms available today, and are a valuable complement to the existing machine learning tools in ArcGIS. Alternatively, you can leave this parameter blank and let the tool try them all. The idea of trying a whole bunch of different models and comparing results is a very important concept in ML, because different algorithms might be suited for different problems and data.
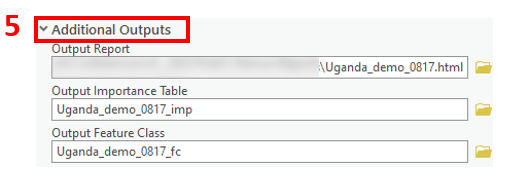
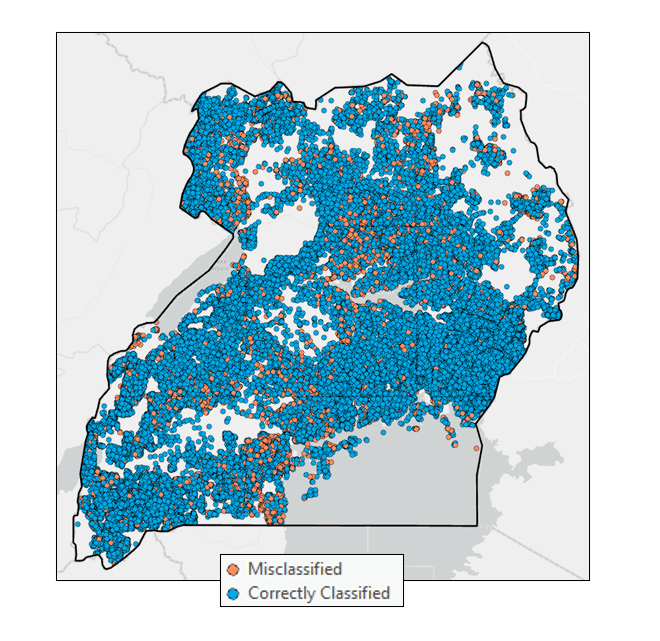
5. For Additional Outputs, you can choose to generate a HTML report that contains information to help you interpret the model training, including model specification, hyperparameter details, and model performance diagnostics. You can also choose to create an output importance table and an output feature class, which can help you understand the most important variables in your model and allows you to visualize the model predictions on the map, respectively.
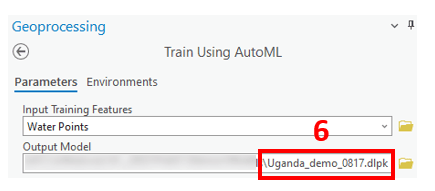
6. Last, we want to point out the output model parameter, which produces a deep learning package (.dlpk) that can be used to apply the trained model to unseen data using the Predict Using AutoML tool.
The geoprocessing tool message shows the best performing models that the tool selected according to the error metric. For this baseline model with minimal human input, and no new engineered attributes, feature selection, or hyperparameter tuning, a logloss score closer to 0 than 1 is a great start.
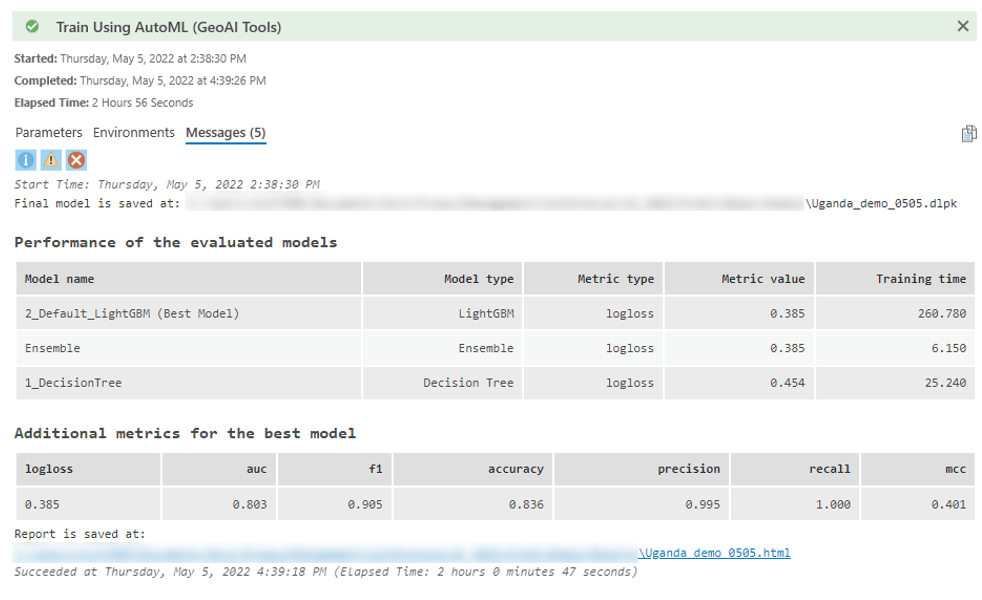
The output HTML report contains even more information for comparing the models.
Selecting one of the models (in this case LightGBM, the best performing one) gives us information on the specifics of that model, additional error metrics, a number of graphics to help interpret model performance, and several charts to help with model explainability and interpretability.
In the report, I can see the most important variables in predicting whether a water point is functional or not are how old the water point is, whether you have to pay for the water, and who manages it.
From this example, you can see how in just a few minutes, these tools can provide a decision maker or domain expert with both a report, and a map that they could use to perhaps prioritize maintenance of older water points, or determine if a certain entity or institution is associated with non-functioning water points… all without having a background or expertise in ML.
Conclusions and resources
For me personally, this was a perfect use case for AutoML. I came into this project with a good degree of machine learning experience and a solid understanding of the machine learning process. I actually did spend hours working on this dataset and doing many of these steps manually (e.g. exploring data, crafting new attributes, trying different models), so it was a great opportunity to take these new tools out for a spin and perform the analysis in an automated way. To my delight, this tool in just a few minutes produced several models that were very competitive with my baseline results with much less manual effort and in much less time. Going forward, I could dive in deeper into these initial models and fine-tune them to try to improve their performance.
So that is a brief background on what AutoML is, why you would use it, and an example of it’s application in a real-world problem. In summary, it is two geoprocessing tools in the new GeoAI toolbox which aim to automate several steps in the machine learning process, providing you with yet another valuable approach in your machine learning toolkit.
We are excited to hear your feedback about the tools in the new GeoAI toolbox!


Article Discussion: