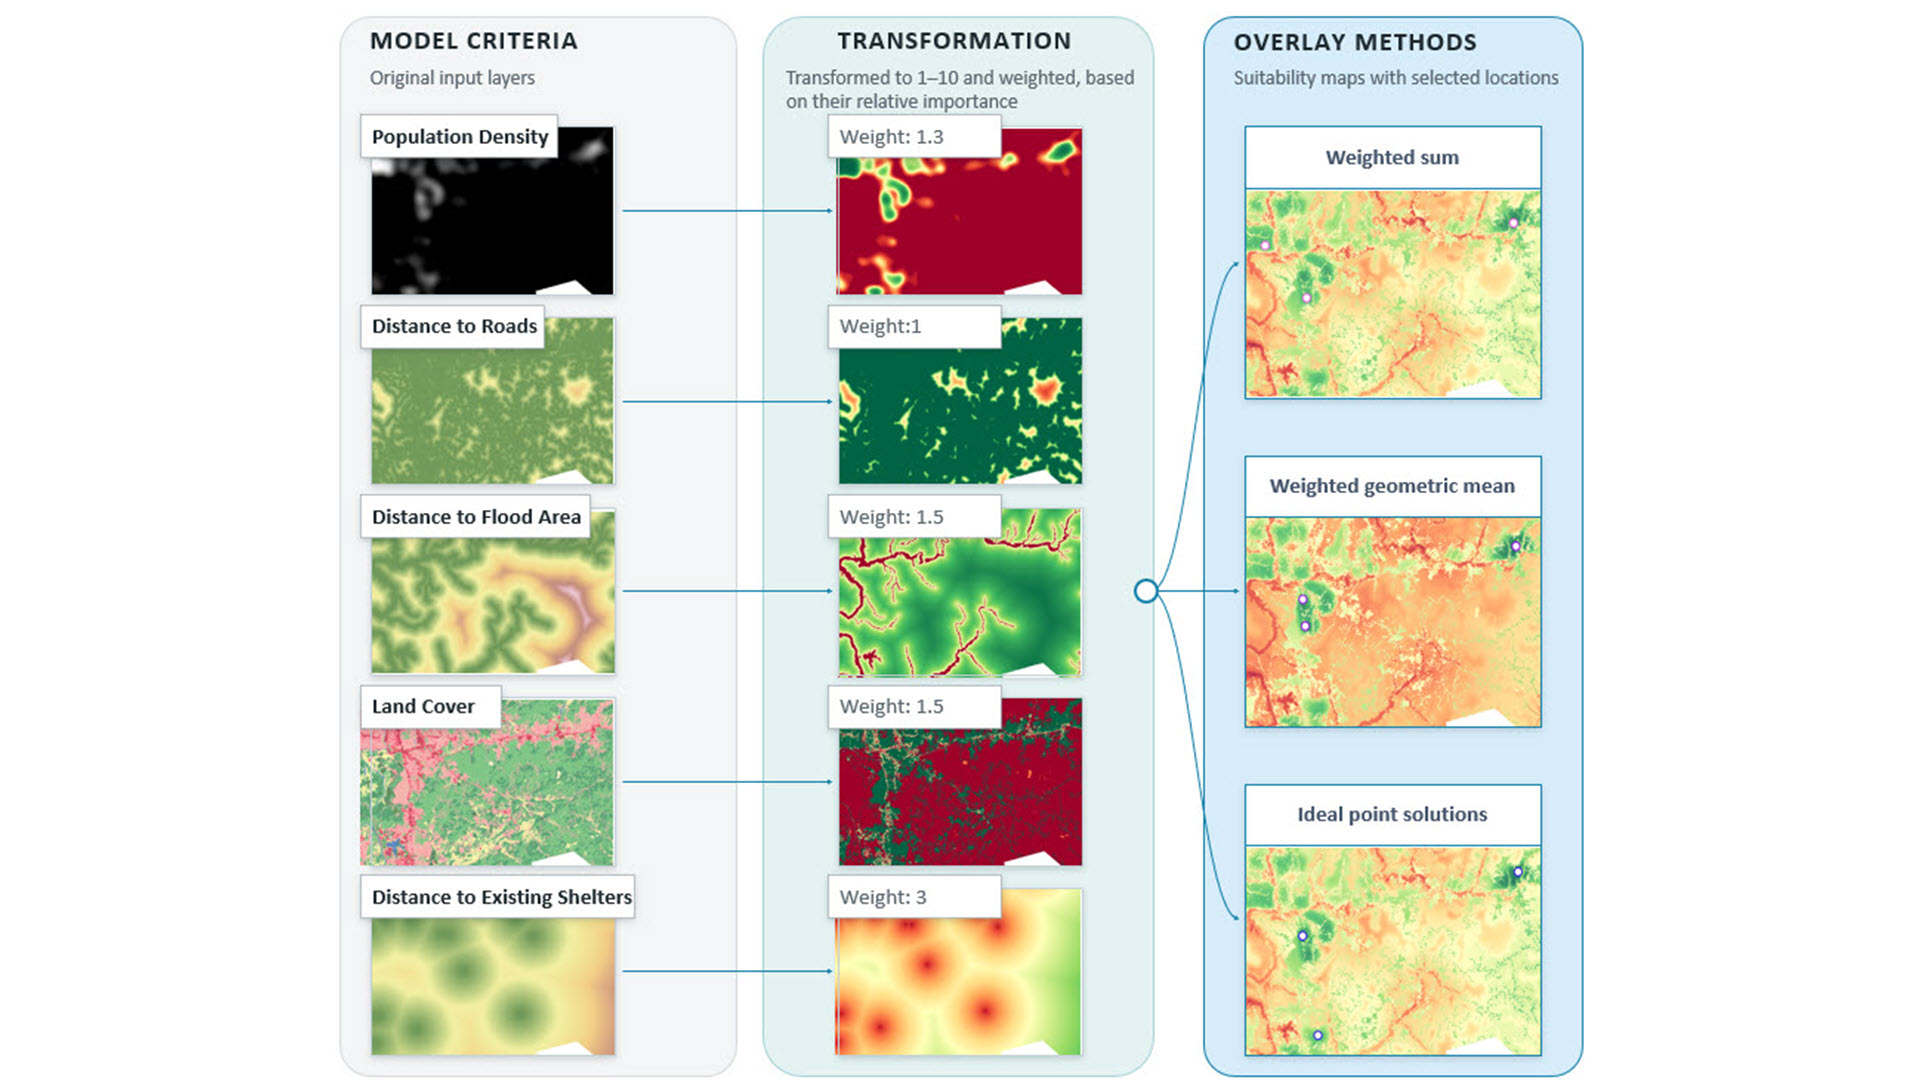
Building a suitability model involves more than selecting criteria and assigning weights. You must also decide how the criteria should interact. Should a highly suitable criterion compensate for a low value in another criterion, or should that low value limit a location’s overall suitability? Because different overlay methods allow you to capture these varying interactions, choosing the right overlay method is an integral part of building the model.
The suitability modeling workflow
The general steps for creating a suitability model are as follows:
- Identify criteria
- Transform the criteria onto a common scale
- Weight the criteria relative to one another
- Combine the weighted and transformed criteria to create a suitability map
- Locate the most suitable regions from the suitability map
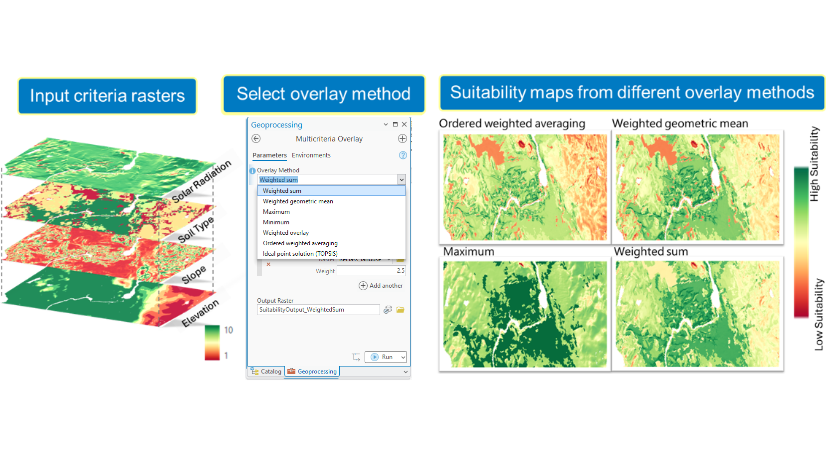
In the Suitability Modeler, there is a rich set of functionality to complete each of these steps. However, one step needs more attention: Step 4, combining the weighted and transformed criteria. This step is critical because the method used to combine criteria captures interactions among the criteria and allows you to explore different decision strategies. With ArcGIS Pro 3.8, seven Overlay Methods are now available. Each captures different interactions among the criteria.
Comparing overlay methods
This blog uses the example of deciding where to place emergency shelters to demonstrate three overlay methods. It compares the results and explains why you might choose one method over another.
In a flood-prone area, we want to add three emergency shelters. We will use a suitability model to find the best locations for these shelters. Five criteria are identified for the siting shelters: Population Density, Distance to Roads, Distance to Flood Area, Land Cover, and Distance to Existing Shelters. Each criterion is transformed to a scale from 1 to 10 and weighted by importance.
To demonstrate the impact of the various methods, we will keep the criteria, transformations, and weights the same and compare the results from the three overlay methods:
- Weighted Sum
- Weighted Geometric Mean
- Ideal Point Solutions (TOPSIS)
Let’s explore how the methods and outputs differ.
Weighted Sum
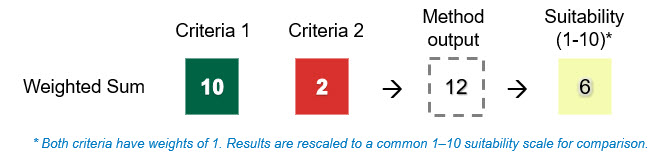
The Weighted Sum method combines criteria by adding the weighted transformed criteria. It assumes that criteria can fully compensate for one another, so a very suitable value in one criterion can balance a less suitable value in another. For example, if two equally weighted criteria have values of 10 and 2, the Weighted Sum result is 12.
In the examples shown throughout this discussion, the result is divided by the total weight (2), giving 6, for easier comparison with the other methods.
The final suitability map with the three selected locations (A) is shown below alongside the transformed Distance to Existing Shelters (B) and Population Density (C) criterion maps.
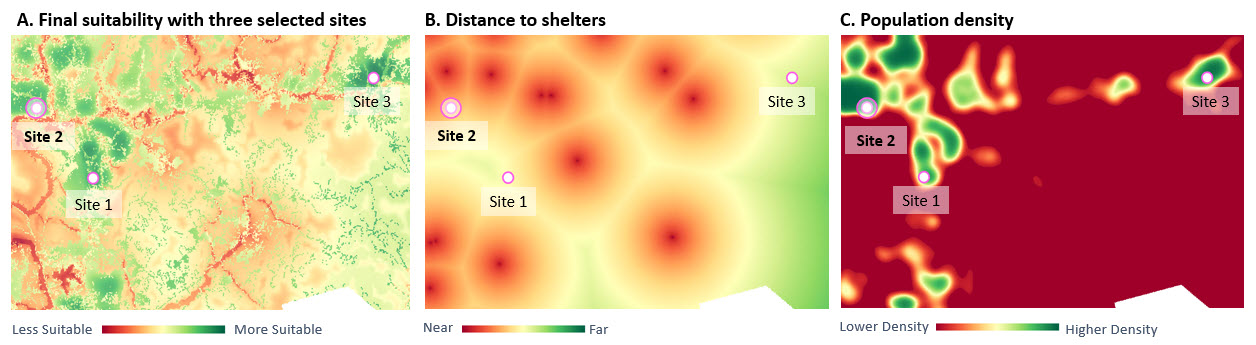
On the middle map (B. Distance to Existing Shelters), the closer a location is to an existing emergency shelter, such as a school or church, the darker red it appears and the less suitable it is for a new shelter. Site 2 is very close to several existing shelters and therefore scores low on the Distance to Existing Shelters criterion. However, it is located in a highly populated area and scores highly on Population Density. With the Weighted Sum method, the high value for Population Density compensates for the low value for Distance to Existing Shelters, and Site 2 is selected as a candidate location.
However, we may not want a low suitability value to be fully compensated for by high values in other criteria, especially when it represents an important limitation. For example, even if a site has excellent road access and serves a densely populated area, it may still be unsuitable if a shelter already exists nearby. The Weighted Geometric Mean method can reduce this compensatory effect.
Weighted Geometric Mean
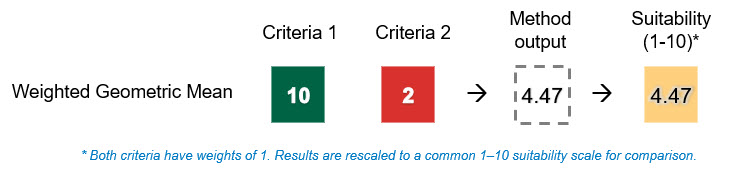
The Weighted Geometric Mean method combines criteria by multiplying the weighted transformed criteria and taking the root based on the sum of the weights. It reduces compensation between criteria, so a low suitability value has a stronger influence on the overall suitability score. For example, if two equally weighted criteria have values of 10 and 2, the Weighted Geometric Mean result is 4.47, compared with a mean of 6 for Weighted Sum. Because Weighted Geometric Mean already produces a weighted mean value, no additional normalization is needed for comparison. This difference can change which locations appear most suitable.
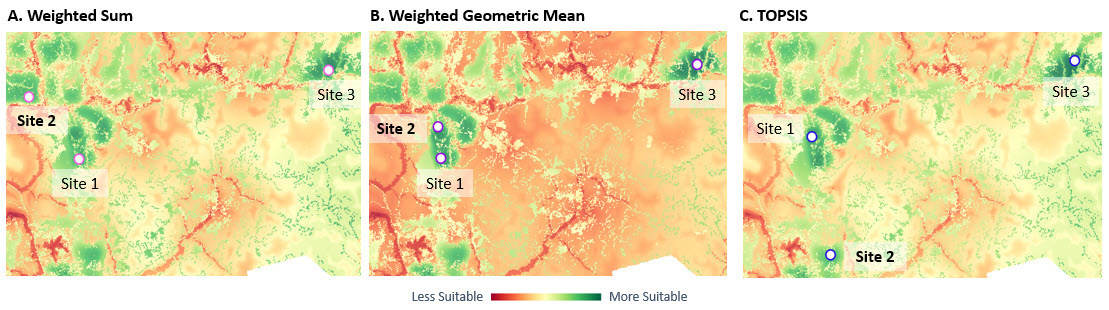
The Weighted Geometric Mean suitability map with the three selected locations (A) is shown below alongside the transformed Distance to Existing Shelters (B) and Population Density (C) criterion maps. The site near an existing shelter is no longer selected; instead, a site farther away is preferred.
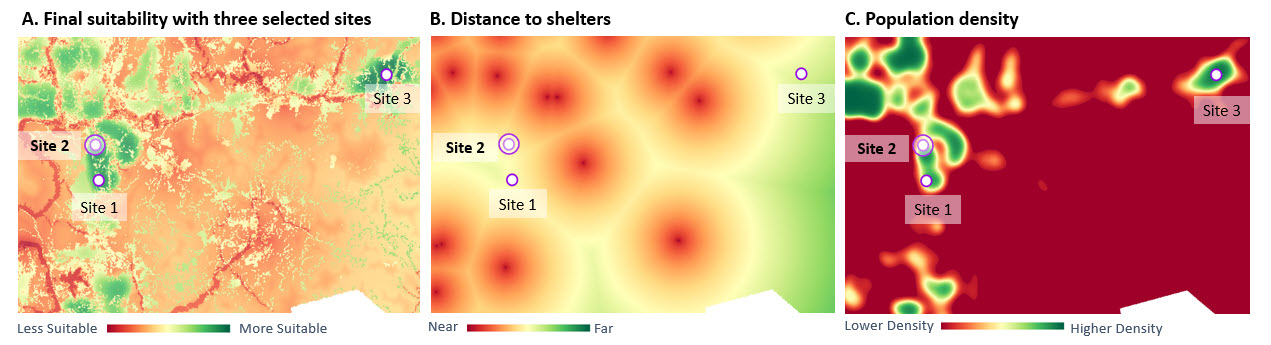
However, a shelter near an existing one may still be desirable in a densely populated area where demand exceeds the capacity of a single shelter. Rather than focusing on one low value, we may want locations that are closest to the ideal conditions overall, which will take the low value into account but not overemphasize it.
Ideal Point Solutions
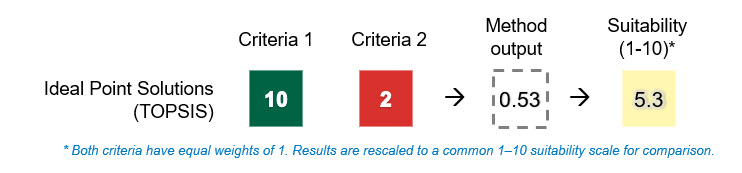
Ideal Point Solutions (TOPSIS) method compares each location with the best and worst conditions across all criteria. It is useful when the preferred location should perform well across all criteria without requiring every criterion to have a high value. Using the same example of two equally weighted criteria with values of 10 and 2, TOPSIS produces a score of 0.53, which is rescaled to 5.3 on a 1-10 suitability scale for comparison with the other overlay methods. The low value matters, but it does not reduce the result as strongly as it does under Weighted Geometric Mean.
As shown in the maps below, TOPSIS selects a location slightly closer to an existing shelter than the location selected by Weighted Geometric Mean. However, the selected location has a more balanced combination of criterion suitability values and is therefore closer to the ideal overall solution.
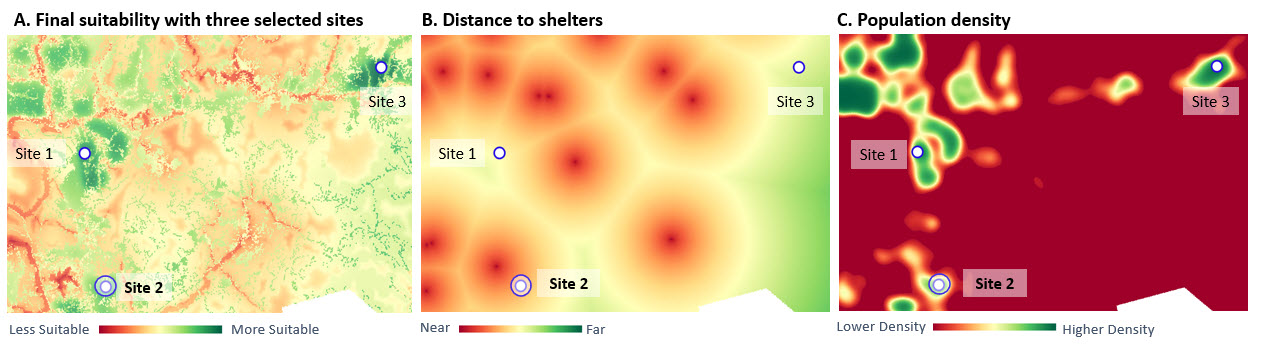
These three methods provide different ways to combine the same criterion values, which can lead to different suitability results. Understanding these differences is important when choosing the appropriate overlay method for a planning objective.
Choosing an overlay method
Although all three methods use the same criteria, transformations, and weights, they produce different suitability patterns because they treat low suitability values differently. The simplified example below compares how the three methods combine the same two criterion values.
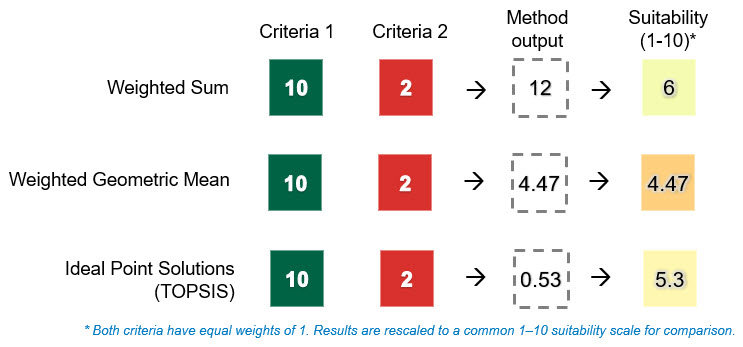
These differences in how criterion values are combined can also affect the spatial patterns and locations identified as most suitable.
In the shelter example, Weighted Sum selects some sites near existing shelters when they perform strongly in other criteria, such as serving densely populated areas. Weighted Geometric Mean gives low suitability values greater influence, shifting selected sites farther away from existing shelters. TOPSIS takes a middle ground: low suitability criteria still matter, but they don’t overweigh everything else, so it favors sites with a more balanced set of criterion values.
So which method should you use? It depends on the planning objective, how criterion values should interact, and the types of trade-offs that are acceptable. The overlay methods available in Suitability Modeler and their common applications are summarized below.
| Method | Best used when: |
| Weighted Sum | A high value can compensate for a low value, for example, favoring highly populated areas even if a site is near an existing shelter. |
| Weighted Geometric Mean | Compensation should be reduced so that a low value has a greater impact. |
| Minimum | The lowest criterion value should determine suitability. |
| Maximum | A single high criterion value is enough to make a location suitable. |
| Weighted Overlay | Weights are expressed as percentages. |
| Ordered Weighted Averaging | You want to control how much high values can compensate for low values. |
| TOPSIS | You want locations closest to the ideal conditions overall, with balanced values across criteria. |
Summary
Using the same criteria, transformations, and weights, different overlay methods can identify different suitable locations because they treat low values differently. Choosing an overlay method based on your planning objective helps you build a more meaningful model and make better decisions. Try the different overlay methods on your own suitability model and compare the results.

Article Discussion: