Turning a continuous surface into defined boundaries is how maps become plans. For some time now you have been asking for percent-based contours directly from density rasters— without employing multiple other tools or external scripts and processes to calculate area based on percentiles. Introduced in ArcGIS Pro 3.6 release, the Value Percentile Contours and Volume Percentile Contours tools provide a one-step solution to what previously was a multi-step workflow. This blog walks you through the tools and some of its key capabilities, what each tool does, how to use them individually and together and how they flow into decisions.
Why use these tools?
Many of you across different domains– from public safety, public health to planning and ecology– often start with events or observations points data leading to a density or risk surface. The challenge is turning that surface into a defined area or boundary to answer the questions of which are the priority areas for investment or where are the hotspots that the policymakers can easily understand. Historically, extracting this information required a multi-step workflow, external scripts or manual data processing. Now you can create percent-based contours in just one step– right from the Density toolset in ArGIS Pro.
What do the two tools help answer?
The Percentile Contours tools answer two different but complementary questions about the same surface. Value Percentile Contours outline the footprint of the highest local intensities by area. Think of them as the map of where the extremes spread— the top end of the surface. You do not need to specify a numeric break; the tool finds the percentile threshold and returns polygons where values meet or exceed that cut.
On the other hand, Volume Percentile Contours outline the smallest area that contains the specified share of the whole. They show where most of the phenomenon resides— a compact core for strategy. Behind the scenes, the tool ranks cells from high to low and accumulates volume (value × cell area, with Planar or Geodesic method available for area calculation) until the target share is reached, then draws the boundary at that threshold. To simply express, Value is the extent of highs and Volume is the core of the whole.
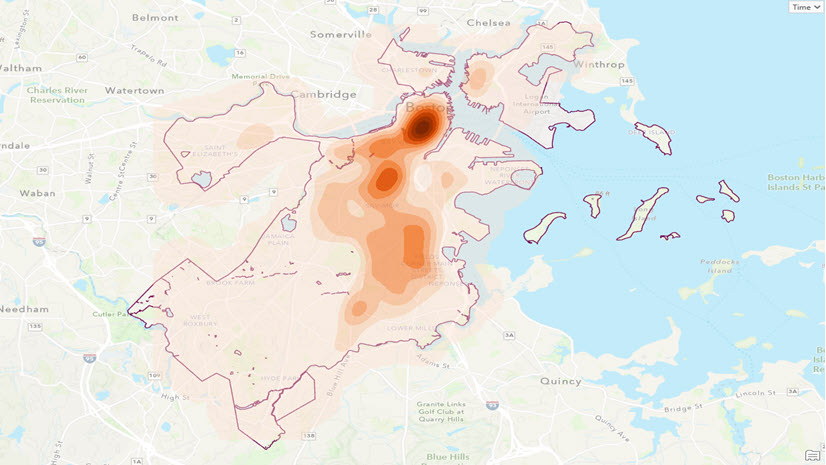
 and Value Percentile Contours (right)")
To learn more about these tools, how they work and the algorithms behind them, see How Value Percentile Contours works and How Volume Percentile Contours works.
Why two separate tools and why use both?
Using the percentile contours tools, we answer two different questions from one Density surface. Value is ideal for short-term initiatives. It’s sensitive to the sharp local highs that matter tonight or this week— perfect for directed patrols, inspections, or immediate mitigation. Volume is ideal for long-term strategy. It’s built from the accumulation of the whole surface and tends to be stable from month to month— perfect for staffing, lighting, Crime Prevention Through Environmental Design (CPTED) approaches, capital planning, or sustained outreach.
Using both prevents blind spots: you see how hot a place is and how central it is to the overall burden. A cell can be very high (Value) yet peripheral to the total, or only moderately high but inside the core where most of the problem accumulates (Volume).
Let’s see how these two tools can be used in a public safety application workflow.
Example: from a density surface to strategy and tactics
We’ve converted reported crime incidents (2015–2024) into a continuous surface using Kernel Density. First is to identify the strategic core with Volume Percentile Contour. For that we can use the 50th percentile values as the threshold. The tool ranks the highest cells first and accumulates until half of the overall amount is captured. The result is the smallest area holding half of the problem. This is where broad, sustained actions pay off without spreading thin.

While the output is useful for long-term planning, what about the spots that need immediate attention? For that, we will use the Value Percentile Contours tool. With the same Density raster, now we will set the percentile value to 95%. The output value percentile contour shows all locations where the density is in the top 5% – places most likely to need immediate attention: patrols, site checks, quick fixes.

Now we can use outputs from both these tools and generate actionable intelligence. For example, if you see a place with Value 95 and Volume 25, that location is both very high and captured early in the accumulation—hot and central. In contrast, if you see Value 90 | Volume 75, it’s still high but more peripheral—better for monitoring and targeted follow-ups than heavy deployment.

When to use which tool?
Use Value Percentile when your question is about extent: “Where are the highest values occupying a given share of area?” Typical uses include top-end heat islands, noise exposure footprints, worst travel-time areas, or the upper tail of risk surfaces.
Use Volume Percentile when your question is about amount: “What is the smallest area that holds a chosen share of the whole?” Typical uses include compact cores of expected storm losses, crime intensity, outbreak burden, or wildfire likelihood. You can also pair Volume and Value to delineate the core (with volume 90), envelope (with volume 50) and tactical spikes (with Value 95).
Way forward: Doing more with Density analysis
Percentile contours are a natural next step after Kernel Density, Point Density, or Line Density. They also shine when you build “burden” rasters (e.g., travel time × population) and need cores that hold most of the person-time burden (Volume) and footprints of extreme exposure (Value). Percentile contours turn a density surface into actionable intelligence in minutes. Value shows where the highest intensities spread, Volume shows where the most issue resides. Run both on the same raster and you move from a density surface to decisions– strategy you can defend, plans & initiatives you can execute.
Data source
The Crime Incident Reports data used here was collected from Analyze Boston.
References
- Crime Incident Reports (August 2015 – To Date) (Source: New System) – Analyze Boston. (2024). Boston.gov. https://data.boston.gov/dataset/crime-incident-reports-august-2015-to-date-source-new-system
- Gibin, M., Longley, P., and Atkinson, P. (2007). “Kernel density estimation and percent volume contours in general practice catchment area analysis in urban areas.” In Proceedings of the GIScience Research UK (GISRUK) Conference, Maynooth, Ireland.
- Hyndman, R. J., & Fan, Y. (1996). “Sample Quantiles in Statistical Packages.” The American Statistician, 50(4), 361–365. https://doi.org/10.1080/00031305.1996.10473566.
- Lewis, D. (2015). “Kernel density estimation and percent volume contours.” In C. Brunsdon & A. Singleton (Eds.) Geocomputation: A Practical Primer, 169-184. SAGE Publications.

Article Discussion: