Complex problems often require us to use a variety of tools and approaches, and Esri’s partnership with SAS extends the variety of data science tools and approaches available at your disposal.
The upcoming release of ArcGIS Pro 2.8 introduces the SAS®-ArcGIS Bridge, and here’s three things you need to know.
1. SAS is a statistical software suite with advanced data science capabilities

A few examples include:
- Taming Unstructured Text Data and Performing Sentiment Analysis
- Perform Power and Sample Size Analysis
- Run Analysis of Covariance Tasks
- Developing A/B Tests for Customer Control Groups
Whether you are an experienced SAS user or just getting started, the breadth of statistical and machine learning tools available in SAS is a powerful asset for your work as a data scientist.
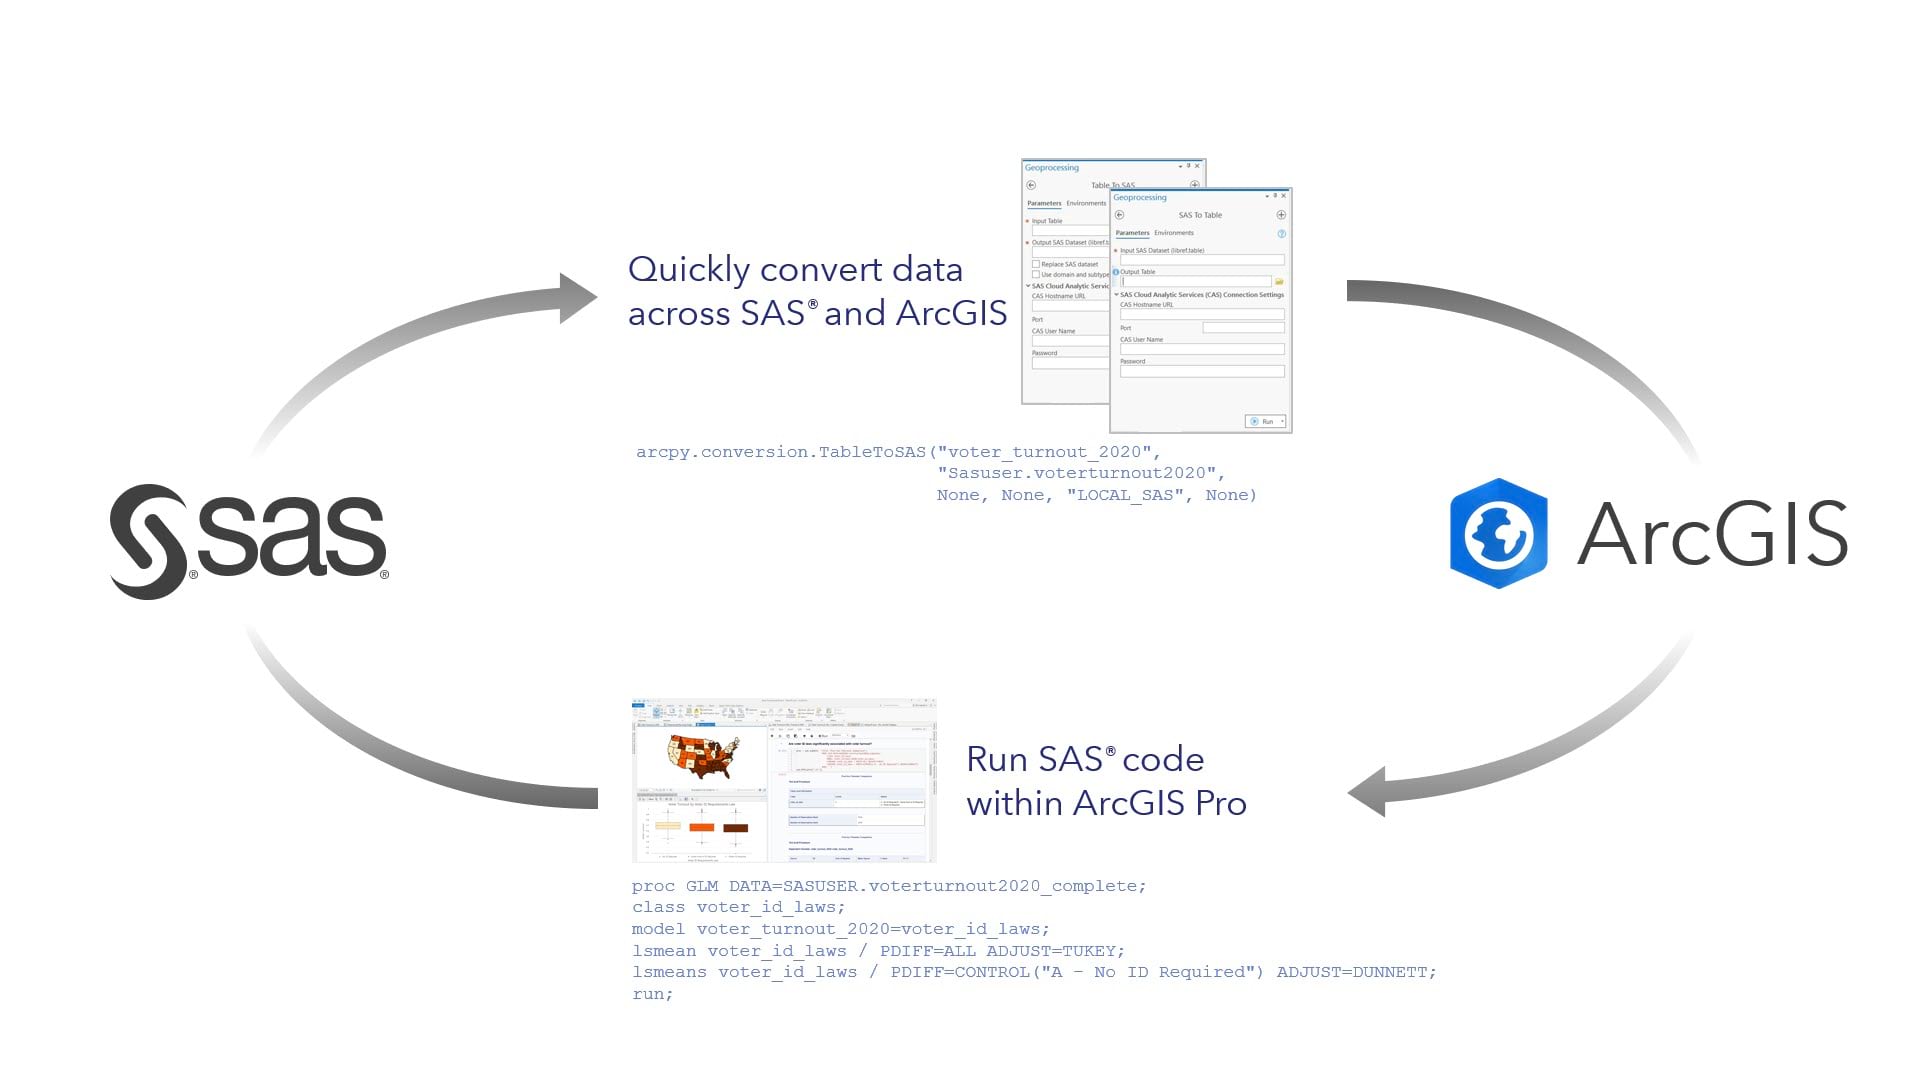
2. The SAS®-ArcGIS Bridge allows you to quickly convert data across SAS and ArcGIS

With the release of the SAS®-ArcGIS Bridge, ArcGIS Pro now supports integration with SAS using two new Geoprocessing tools: SAS to Table and Table to SAS.
SAS To Table provides an easy way to convert SAS datasets to a table format that can be spatially enabled and used within ArcGIS Pro. The interface is quite simple, you simply specify the source SAS dataset in libref.tablename format, the output table name, and run the tool:

You may also connect to SAS Cloud Analytic Services (CAS) to read data shared on the SAS Cloud.
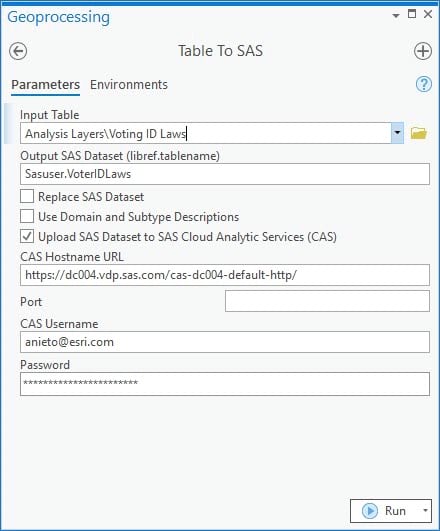
Table To SAS accepts any feature layer with an attribute table and converts it to a format that can be used in the SAS software suite. A few additional parameters allow you to designate whether you want to overwrite an existing SAS dataset, leverage any domain and subtype descriptions, and optionally connect to SAS CAS to upload your dataset to the SAS Cloud.

The tools can be found in the conversion toolbox, within the new SAS toolset, and they provide you an easy path for converting data back and forth across the two systems.

As part of the Geoprocessing framework, the tools can be run within the ArcGIS Pro GUI or scripted via ArcPy or ModelBuilder.
3. The SAS®-ArcGIS Bridge allows you to run SAS® code within ArcGIS Pro
The SAS®-ArcGIS Bridge also allows you to use SAS analysis procedures directly within ArcGIS Pro.

To leverage this feature, you can use the newly included SASPy and SWAT python packages to write and submit SAS code within ArcGIS Pro.
Here’s a basic example:
Voting in elections is voluntary in the United States and analyzing voter turnout is an important need to ensure public policy reflects public needs. While recent elections have benefitted from increased voter participation, new targeted policies that require strict government-issued IDs can have a disproportionate burden on low-income, racial and ethnic minorities, the elderly, and people with disabilities. The ACLU and other organizations advocate for states to allow alternate forms of identification, such as library cards or student IDs, to be accepted as forms of identification.
To analyze this, you may load a dataset containing 2020 US presidential election voter turnout and voter ID laws in the Untied States to ArcGIS Pro. Each state has one of three categories of voter ID requirements: No ID required, Some form of ID required, and strict government-issued ID required:

The goal of this exercise will be to assess whether the change in voter ID laws for each state has a statistically significant effect on voter turnout. While we are used to assessing variable relationships between variables in ArcGIS Pro, it becomes more challenging when we work with categories. For this reason, we will use the SAS®-ArcGIS Bridge to export the data to SAS and run a basic procedure to assess this relationship.
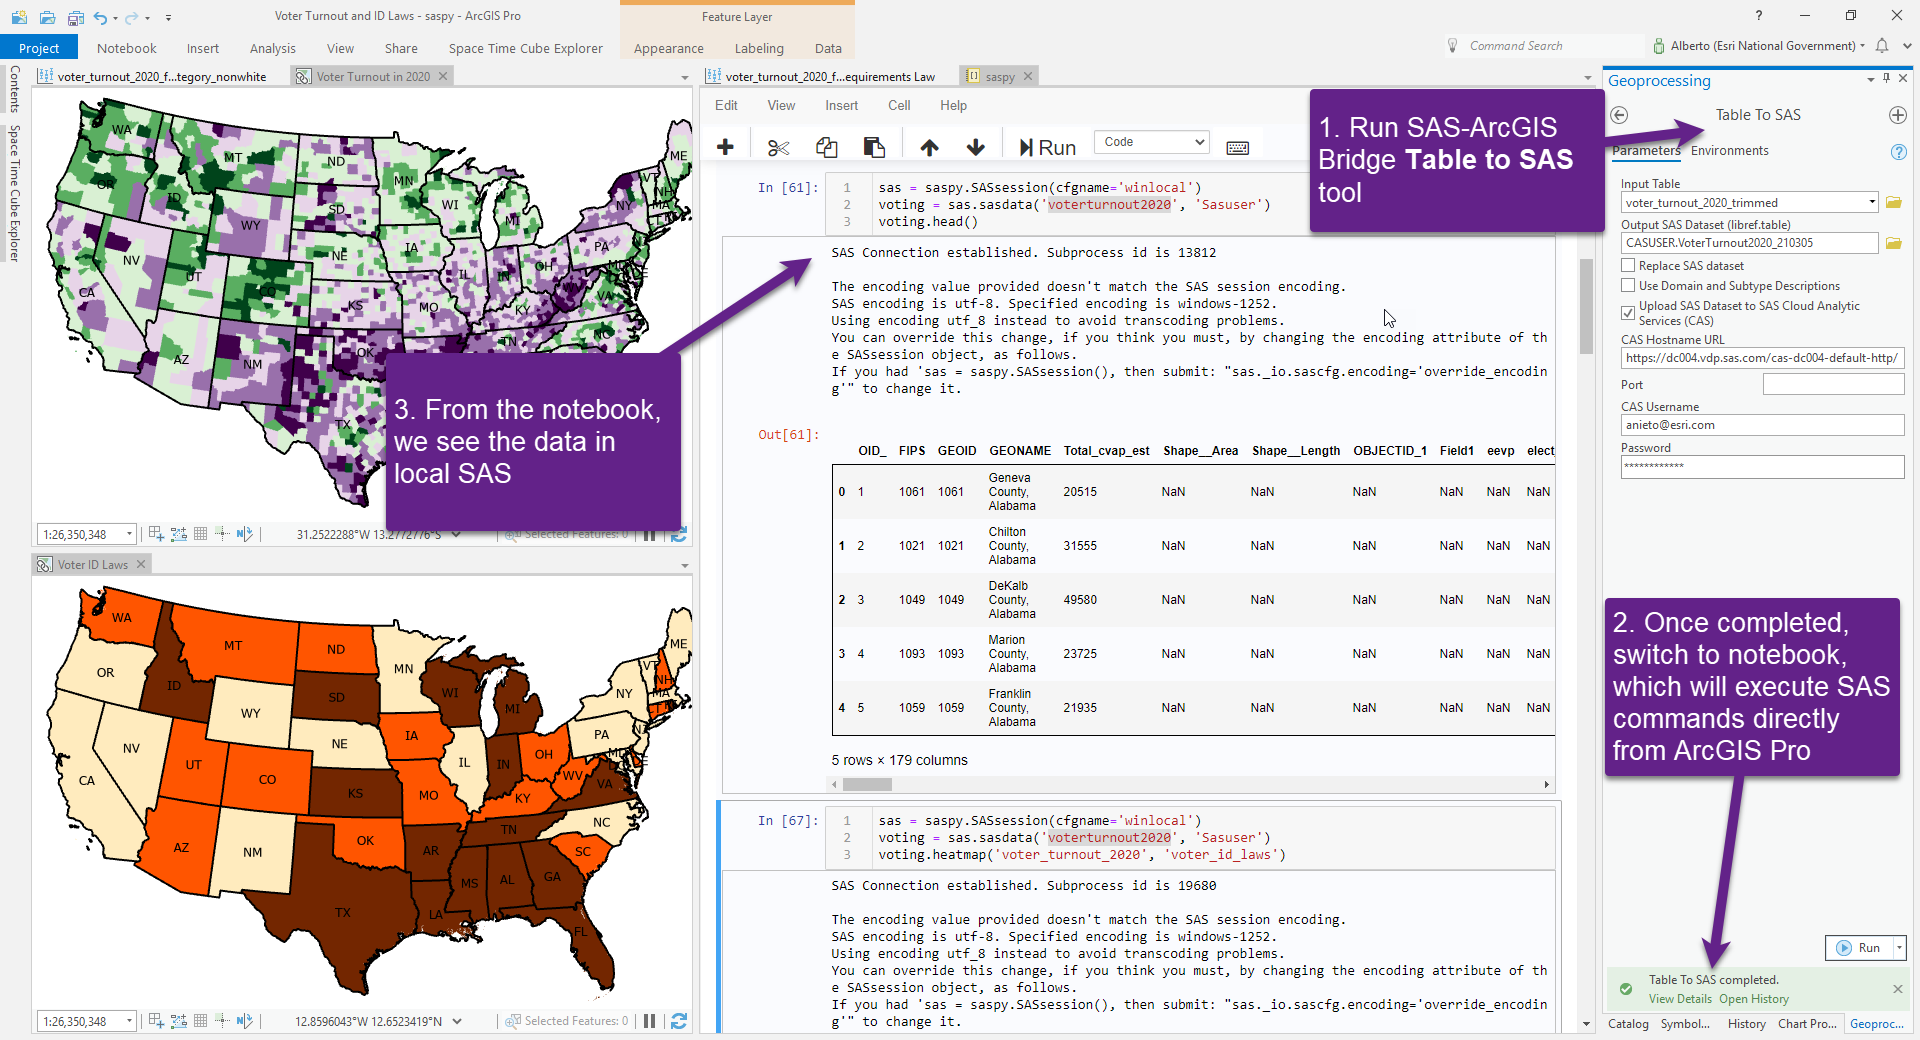
- Run the Table To SAS tool, passing our data as an input and receiving a SAS libref.table as an output:
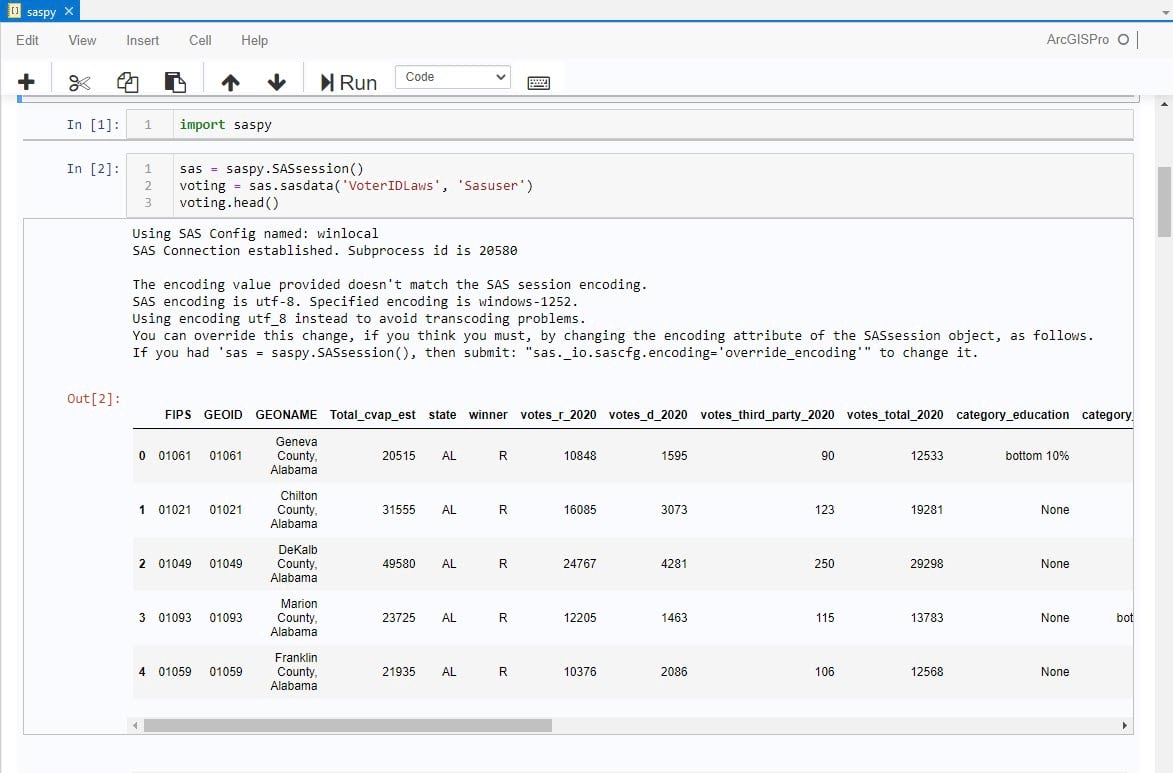
- Once completed, open a notebook inside ArcGIS Pro. Import the SASPy module (SAS® desktop) or SWAT module (SAS Cloud Analytical Services) and load the table:
- Run the SAS GLM procedure with the Tukey and Dunnett adjustments to test for statistically significant changes in voter turnout for each voter ID law category:

The results are displayed as a series of tables and charts. One of the charts displays p-values in comparisons across the categories of the Voter ID Laws variable and the Voter Turnout variable:
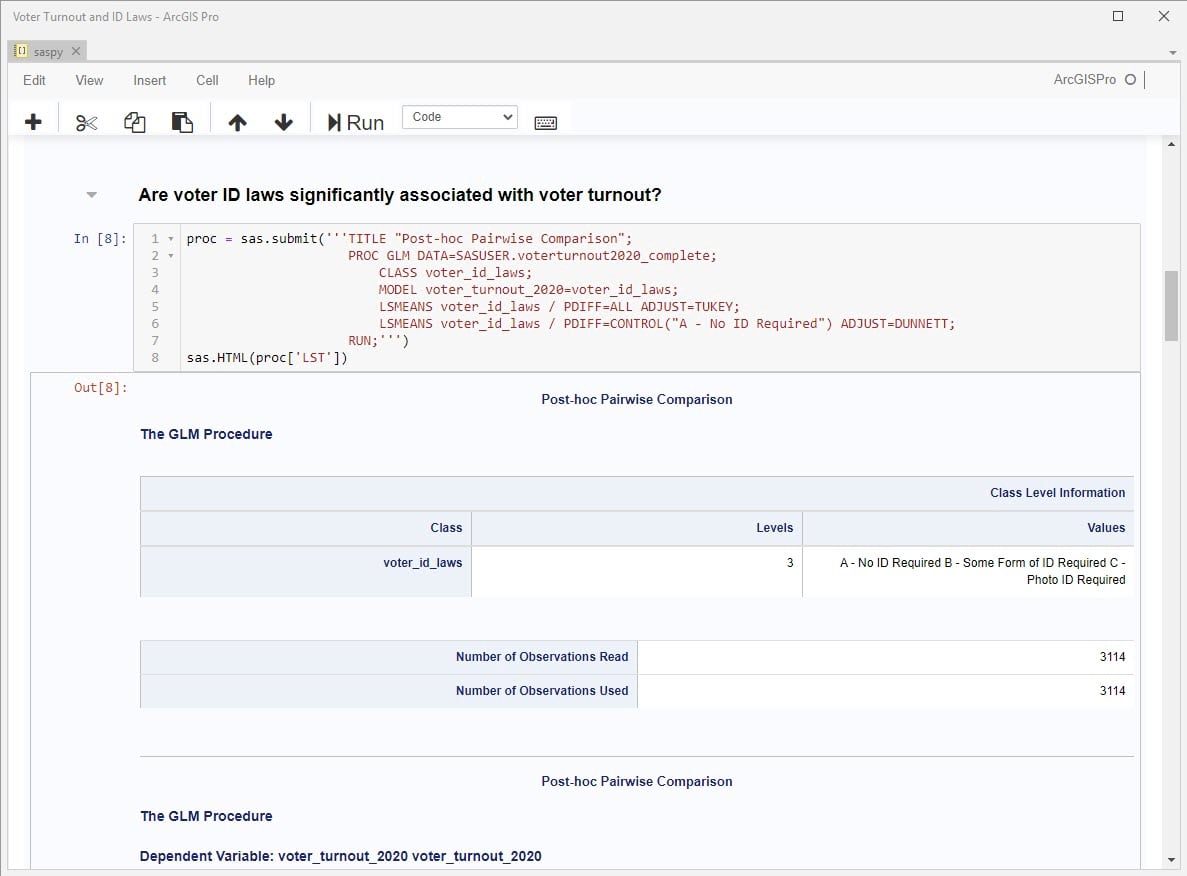
The low p-values suggest a statistically significant relationship between voter ID laws and voter turnout.
With this answer we may make the decision to include the Voter ID Laws variable in a model that estimates voter turnout, or we may dive deeper into additional questions to control for other policies at each state, such as the ability to vote by mail.
This was a basic exploratory example, but we covered a lot. Here’s a summary of the steps we took:
The SAS®-ArcGIS Bridge is an integration to continue empowering your science and analysis
With the ArcGIS Pro 2.8 release, we are excited to bring an entire repertoire of statistical and machine learning analysis tools via the integration with SAS. As you continue tackling important problems in the world, we recognize the need to integrate with other systems and toolsets, and we hope that the SAS®-ArcGIS Bridge becomes a useful aspect of your data science and analysis efforts.

Article Discussion: