Charts are an integral part of any analysis. Not only do they help make sense of your data, but they also help convey the results of your analysis to your collaborators and the public. The output feature class of several tools in the Spatial Statistics and Space Time Pattern Mining toolboxes includes a pop-up chart that appears when you click on a feature. The information visualized in the pop-up charts provides valuable insight into the results of the analysis. In some cases, the information only appears in the pop-up charts. It cannot be found in the Geoprocessing messages after running the tool or in the attribute table.

Its important to share these pop-up charts when you share the results of your analysis to ArcGIS Online. This is now possible with the new Convert Spatial Statistics Popup Charts for Web Display tool. You can now share the results of your analysis online and retain the pop-up charts. This tool is scheduled to release in ArcGIS Pro 3.2. However, you can download the sample tool. This sample tool is supported in ArcGIS Pro 2.9, ArcGIS Pro 3.0, and ArcGIS Pro 3.1.
The following workflow will demonstrate the functionality of the Convert Spatial Statistics Popup Charts for Web Display tool. You will publish several feature classes containing pop-up charts as web layers to ArcGIS Online and add them to a web map. If you share this web map with collaborators or the public, they can see the pop-up charts. View the final webmap.
Preparation
- Download the Convert Spatial Statistics Popup Charts for Web Display sample tool, if you are using ArcGIS Pro 3.1 or earlier.
- Open ArcGIS Pro. In the Insert tab in the Project section, click Toolbox. In the dropdown, select Add Toolbox.

-
- In the Add Toolbox dialogue box, navigate to where you downloaded the Convert Spatial Statistics Popup Charts for Web Display tool. Click Convert_Spatial_Statistics_Popup_Charts_for_Web_Display.pyt then click Ok.
- In the Catalog pane, expand the Toolboxes dropdown then expand the Convert_Spatial_Statistics_Popup_Charts_for_Web_Display.pyt dropdown. Double click Convert Spatial Statistics Popup Charts for Web Display to open the tool.
- Download the space-time cubes and ArcGIS Notebook in Pro.
This workflow uses the space-time cubes created in the blogpost Looking to the future: Using GIS to model and predict population. Three space-time cubes contain forecasts of US population created by the three forecasting tools in the Time Series Forecasting toolset. The final space-time cube was created by evaluating and merging the three forecast cubes using the Evaluate Forecast by Location tool. Follow this workflow to create the space-time cubes or download them. - Sign in to your ArcGIS Online account in ArcGIS Pro. This workflow will share a web feature layer to ArcGIS Online, so the account must have the privilege to publish hosted feature layers.

Convert the spatial statistics popup charts for web display
- Run the Visualize Space Time Cube in 2D tool to convert the first space-time cube into a 2D feature class.
- Input Space Time Cube: USA_County_Population_2030_CF.nc
- Cube Variable: POPULATION_SUM_ZEROS
- Display Theme: Forecast results
- Enable Time Series Pop-ups: checked
- Output Features: USA_County_Population_2030_CF

- Run the Convert Spatial Statistics Popup Chart for Web Display tool on the output feature class created by the Visualize Space Time Cube in 2D tool. This will create a new feature class with the pop-up charts saved as image attachments.
- Input Features: USA_County_Population_2030_CF
- Output Features: USA_County_Population_2030_CF_popups

Automate the process with an ArcGIS Notebook in Pro
- You can repeat the process with the remaining space-time cubes, or you can automate the process with an ArcGIS Notebook in Pro. Download the notebook.
- In the Insert tab in the Project section, find New Notebook . Click the dropdown arrow beside New Notebook and select Add Notebook.
- Navigate to the folder you downloaded and select Convert Spatial Statistics Popup Chart for Web Display.ipynb. Click OK.
- In the Catalog pane, expand the Notebooks drop-down. Find the notebook Convert Spatial Statistics Popup Chart for Web Display.ipynb. Double click Convert Spatial Statistics Popup Chart for Web Display.ipynb to open the notebook.
- In the first cell of the notebook, use arcpy.env.workspace to set the path to your folder containing the space-time cubes. Set path_toolbox to the path to the toolbox Convert_Spatial_Statistics_Popup_Charts_for_Web_Display.pyt.

- Click the Cell dropdown and click Run All.
- The notebook will iterate through the remaining space-time cube. It first creates a 2D feature class using the Visualize Space Time Cube in 2D tool.

-
- The notebook then applies the Convert Spatial Statistics Popup Charts for Web Display tool to create a new feature class with the popup charts saved as image attachments.

- Once the ArcGIS notebook has executed, you will have four feature classes that contain image attachments.
Share the results to ArcGIS Online
- Enable unique IDs. In the Contents pane, right-click Map and click Properties.
- In the Map Properties dialogue box in the General tab, check the box Allow assignment of unique numeric IDs for sharing web layers. Click OK.

- In the Contents pane, right click on the layer USA_County_Population_2030_CF_popups. Select Sharing, then select Share As Web Layer.

- In the Share As Web Layer pane, provide the following values:
- Name: US Population Curve Fit Forecast
- Summary: US population forecast using the Curve Fit Forecast tool
- Tags: spatial statistics, space-time pattern mining, curve fit forecast
- Layer type: Feature
- Share with: Everyone

- Click Publish.
- Repeat the process to share the following layers:
- USA_County_Population_2030_FB_popups
- USA_County_Population_2030_ES_popups
- USA_County_Population_2030_EFBL_popups
Use the name, summary, and tags that describe the respective layers.
View the results in Map Viewer
- Once you have successfully published the final layer, click the Manage the web layer link to view the web layer.

- In the browser window, click Open in Map Viewer. If you see Open in Map Viewer Classic, then click the dropdown arrow next to Open in Map Viewer Classic and select Open in Map Viewer. The feature layer will open in Map Viewer.

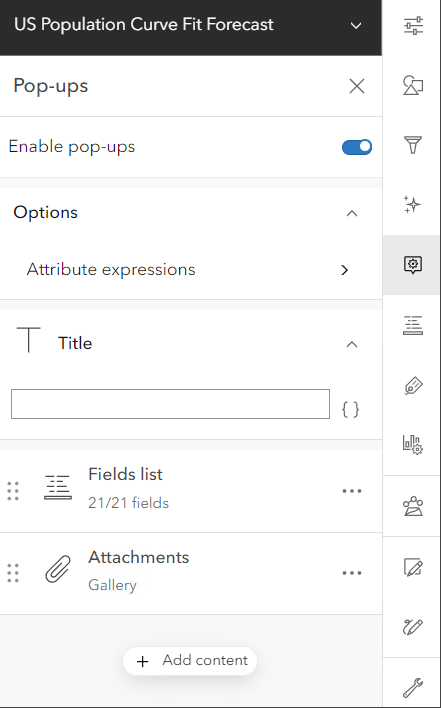
- In the Settings toolbar in Map Viewer, configure the pop-up settings. Click on the Pop-ups button. Expand the Title dropdown. Delete any text in the textbox. Click the X next to Pop-ups.
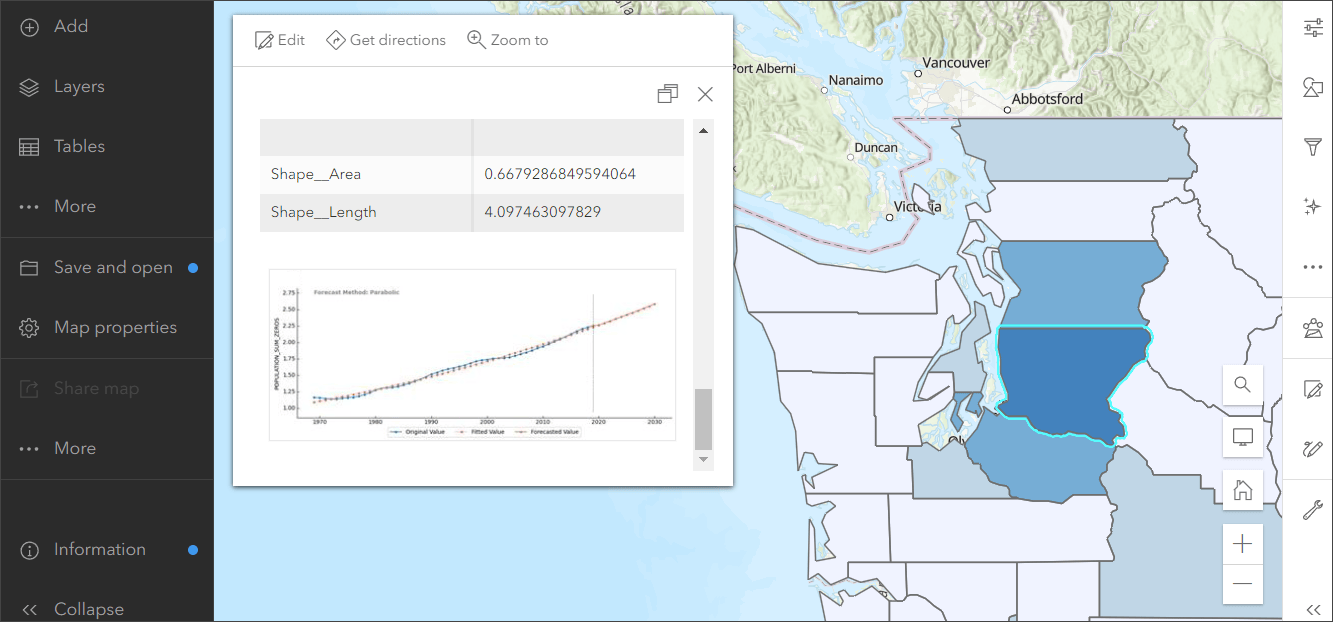
- Click on a feature and a pop-up will appear. Expand the pop-up and scroll to the bottom to see the chart.
Create a web map to share all the web layers
- In the Layers pane, click the Add button.

All the web layers you shared will appear in My Content.

- Find each web layer you shared and click the + button next to each. This adds the web layers to your web map. All four layers should now appear on your web map.

- If necessary, click on each layer to configure the Pop-up title. In the Settings toolbar, click on the Pop-ups button. Expand the Title dropdown. Delete any text in the textbox. Click the X next to Pop-ups.
- In the Contents toolbar, click Save and open then click Save as.

- Configure the following settings then click Save:
- Title: US Population Forecast Analysis
- Tags: spatial statistics, space-time pattern mining, time series forecasting, population
- Summary: The time series forecasting results from the analysis outlined in the Looking to the future: Using GIS to model and predict population.

- Finally, copy the url and share this web map with your collaborators or the public. View the final result.
Conclusion
In this lesson, you shared feature classes with pop-up charts from ArcGIS Pro to ArcGIS Online. You used the Convert Spatial Statistics Popup Chart for Web Display tool to create feature classes where the pop-up charts were saved as image attachments. You then shared these feature classes to ArcGIS Online and the pop-up charts appeared in the web map.
The new Convert Spatial Statistics Popup Chart for Web Display tool is an excellent way to share the pop-up charts from your analysis to ArcGIS Online. The Convert Spatial Statistics Popup Chart for Web Display tool is compatible with the output feature class from the following tools: Local Bivariate Relationships, Time Series Smoothing, Change Point Detection, Forest Based Forecast, Time Series Clustering, Curve Fit Forecast, Exponential Smoothing Forecast, and Evaluate Forecasts by Location. Download the sample tool or look out for it in the upcoming release of ArcGIS Pro.


Article Discussion: