The Spatial Analyst extension introduces new and enhanced capabilities in ArcGIS Pro 3.2. This release gives you capabilities for evaluating the quality of suitability models. New tools are available for Density, Distance, and Solar analysis. Zonal analysis has a new option to improve workflows, as well as some new statistic types.
Where do I get it?
ArcGIS Pro 3.2 was released on November 7, 2023.
For a complete summary of all the changes that have been made for this release, have a look at the What’s New in ArcGIS Pro 3.2 blog post.
What’s changed for Spatial Analyst?
Listed here are the main functional areas with improvements over the last release:
- Suitability Modeling
- Density analysis
- Distance analysis
- Solar analysis
- Zonal analysis
1. Suitability Modeler
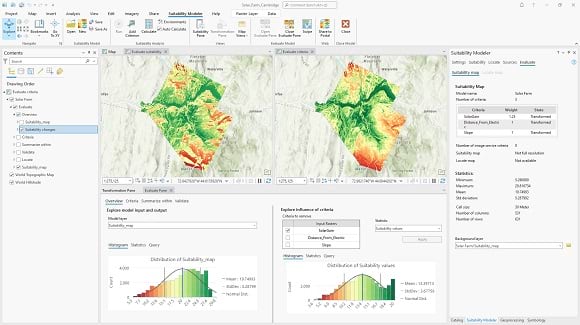
The new Evaluate capability of Suitability Modeler provides an integrated environment to evaluate the quality of a model. In the Evaluate tab, the maps, panes, plots, and content update dynamically with changes to the model criteria, weights, and transformations. You can use this immediate feedback to better understand your model. In the Evaluate pane, you can explore the composition of the weighted transformed criteria values at locations that have equally high suitability so you can make better choices between them. You can also explore the criteria interactions in several ways, including by individual cells, within parcels, relative to known observations, or in the final regions identified from a Locate operation.
See the following topics for more information:
- Evaluate environment in Suitability Modeler
- Evaluate workflow and suitability modeling constraints
- Evaluate tab in Suitability Modeler
- Evaluate Pane in Suitability Modeler

2. Density analysis
The new Space Time Kernel Density tool allows you to analyze density for other dimensions than relative position and magnitude in density calculations, such as time and depth. Some example of other dimensions and example applications of this capability include the following:
- Calculating the density of an attribute on a 2D surface in different time intervals.
For example, identifying clusters of monthly crime in Kyoto from 2003 to 2005. - Calculating the density of an attribute in a 3D cube using z as the additional dimension.
For example, calculating the salinity based on depth in a certain area of ocean, or the PM2.5 particulate matter concentration in the air above a city. - Calculating the density of an attribute in a 3D cube in different time intervals.
For example, calculating the salinity in a certain area of ocean in different weeks, or the PM2.5 concentration for different hours of the day.
3. Distance analysis
Use the new Optimal Corridor Connections tool to calculate create an optimal network of corridors between locations based on a constant width that you specify. Some applications this tool is well suited for are planning power lines, pipelines, railroads, other right-of-way corridors or transport systems.
4. Solar analysis
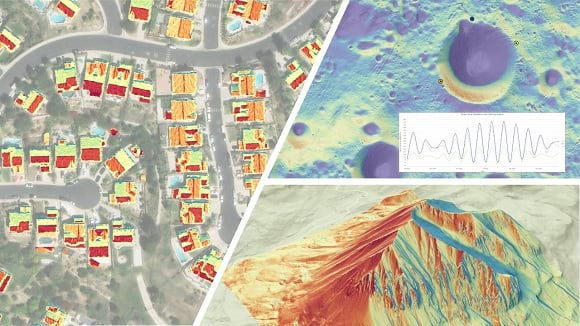
Spatial Analyst has two new tools that offer significantly enhanced capability for solar analysis over the original tools. The Raster Solar Radiation tool calculates the solar insolation per unit area for every raster cell of a digital surface model (DSM). The Feature Solar Radiation tool calculates the incoming solar insolation for input points or polygon features relative to the surface (ground).
Key improvements from the new tools include the following:
- The new algorithms support geodesic calculations and analysis over larger geographic areas.
- These tools achieve enhanced performance by taking advantage of multi-threaded, parallel processing, and support the use of graphics processing unit (GPU) processing.
- To improve raster analysis workflows, you can save time by supplying pre-calculated input slope and aspect rasters, which is particularly helpful if repeating analysis for a large area of interest. You can also include a mask to constrain the analysis to defined analysis areas or locations.
- For feature analysis, you have the ability to specify size and orientation of the locations that receive solar radiation based on attribute information.
- When calculating solar radiation for a time interval, such as weekly or monthly, the results are returned as a time series raster (multidimensional raster) or a feature table.
One thing to keep in mind is that calculating insolation can be computationally intensive for large data extents and when calculating many time intervals. This may require a substantial amount lot of computing power, memory, and hard disk space. Systems with high-end GPUs will see significant reductions in processing time compared to systems that are limited to performing calculations only on the CPU.
Along with the many improvements, one of the most exciting enhancements is that we now support solar analysis on the Moon! This was done to help science and research by organizations such as NASA-JPL and the Canadian Space Agency in an effort to support future moon missions.

5. Zonal analysis
You can now join the output table from the Zonal Statistics as Table tool directly to the input zone data with the new Output Join Layer parameter. This eliminates the step where you had to add the table to the input data with a separate tool before doing further analysis.
Several new zonal statistics options were added. For the Zonal Statistics tool, the Zonal Statistics raster function, and the Zonal Statistics as Table tool, the four new statistics options are Majority count, Majority percentage, Minority count, and Minority percentage. The Zonal Statistics as Table tool has two additional options, one being Majority value, count, and percentage, with the other being Minority value, count, and percentage.
Summary
That covers the notable new capabilities the Spatial Analyst extension makes available to you for ArcGIS Pro 3.2. Be sure to check back here, where we will add links to new blogs that cover aspects of these improvements in more detail.
See the following links for notifications of new resources as we add them.
- Spatial Analyst Resources blog:
https://www.esri.com/arcgis-blog/products/analytics/analytics/spatial-analyst-resources/ - Spatial Analyst Communities blog:
https://community.esri.com/t5/arcgis-spatial-analyst-blog/bg-p/arcgis-spatial-analyst-blog

Commenting is not enabled for this article.