There are a few different ways that you can debug python code for ArcGIS Pro.
The ArcGIS Pro Debugger for Visual Studio Code (VS Code) is a handy tool that can assist in the development of custom script tools. It can be used to step through the code in python scripts and python toolboxes while the tool is running in ArcGIS Pro. This will allow you to debug issues in real time with your data. The extension leverages all the usual VS Code debugging tools to set breakpoints and step into/through/over your code while also being able to view the current values of variables.
To begin, it is best to open an ArcGIS Project folder in VS Code. This will give you access to elements of the project and and is a necessary requirement for parts of the extension to work.
The ArcGIS Pro Debugger extension can be downloaded and installed from the Visual Studio Marketplace or from the Extensions tab on the side bar within VS Code. Once installed, you’ll notice two new features in VS Code.
The ArcGIS Pro Debugger
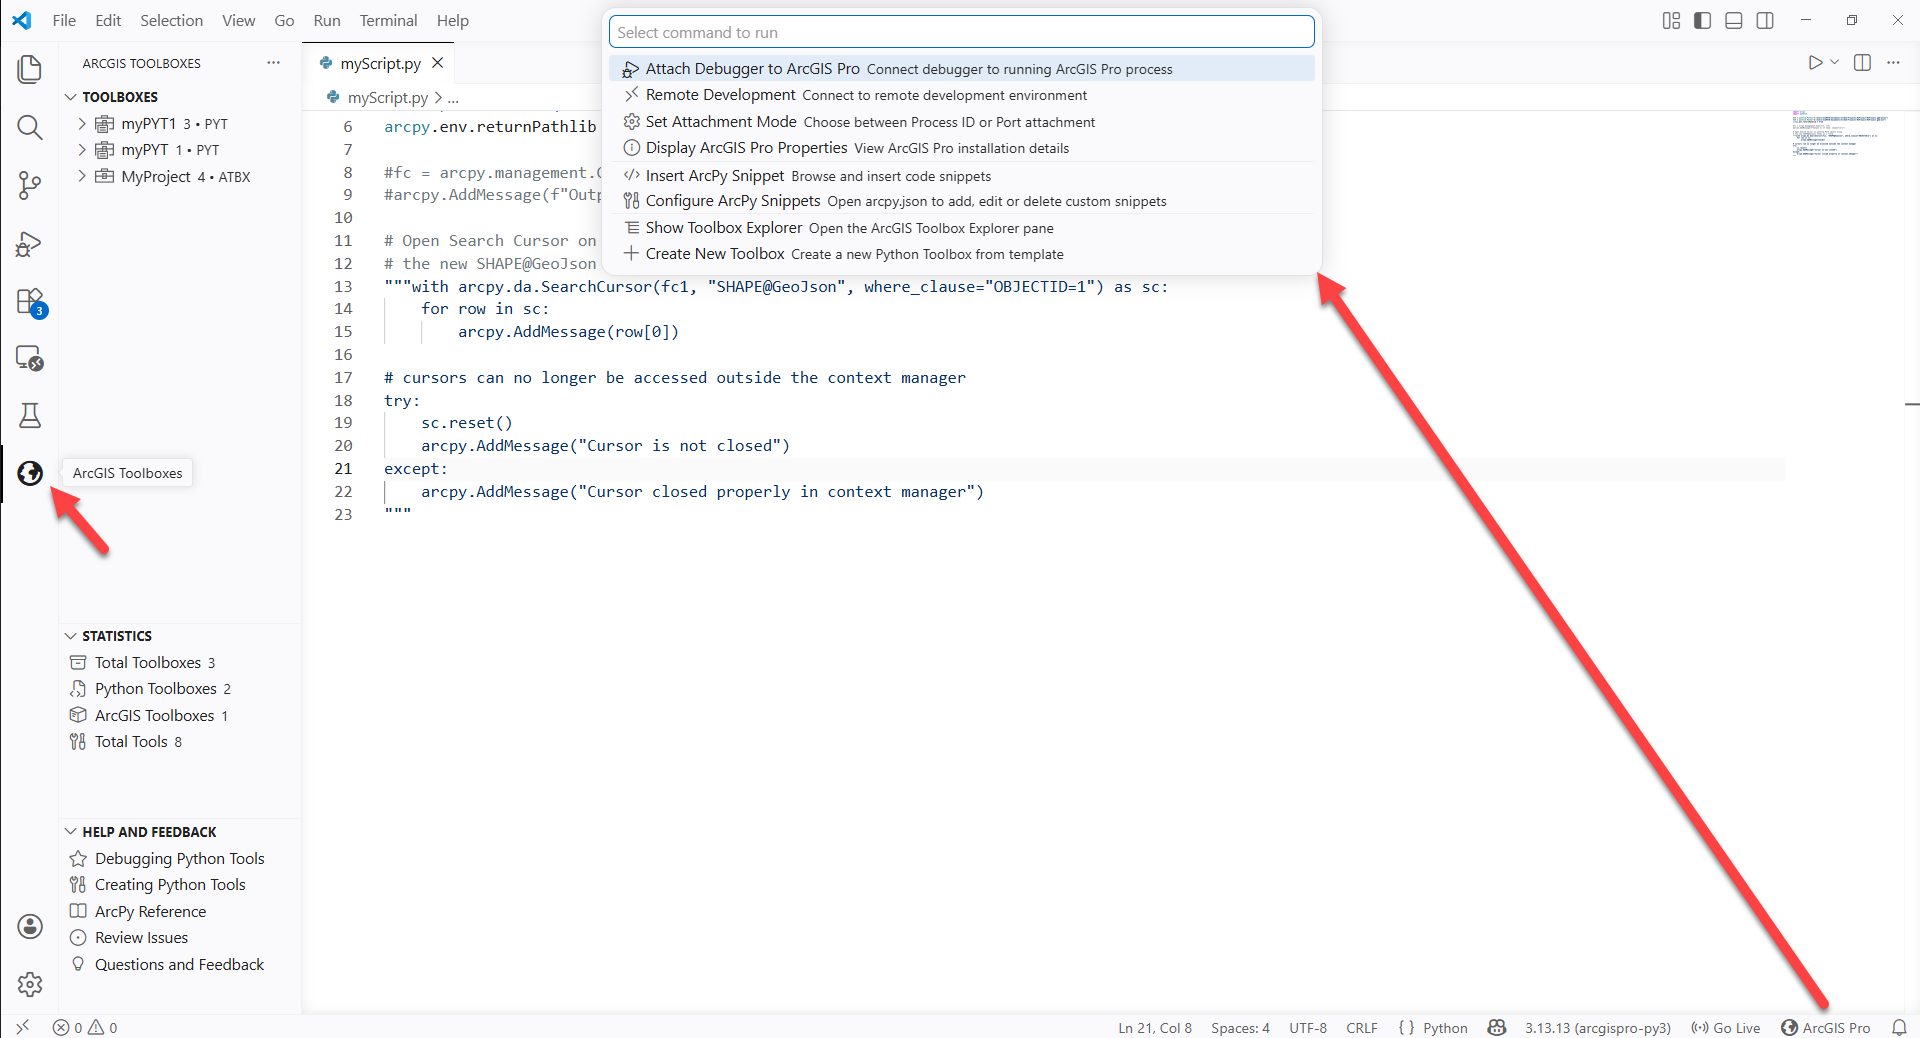
The primary side bar on the left now contains an icon resembling the Earth that when clicked, will open the ArcGIS Toolbox Explorer.
The status bar on the bottom right now contains an ArcGIS Pro button. Clicking this ArcGIS Pro button will open the menu from the top where there are a few choices.
- Attach Debugger to ArcGIS Pro: This will allow you to choose an instance of ArcGIS Pro to attach to.
- Remote Development: This will allow you to connect to another instance of VS Code on a remote machine to debug a python script in ArcGIS Pro located on that remote machine.
- Set Attachment Mode: This will allow you to change the attachment mode to Port if you are remote debugging or back to Process ID, which is the default.
- Display ArcGIS Pro Properties: This will display the install location, current active python environment, and the python root for ArcGIS Pro.
- Insert ArcPy Snippet: This will allow you to browse and insert ArcPy code snippets into your script at the location of your cursor.
- Configure ArcPy Snippets: This will open the arcpy.json file where you can add, edit, or delete your own custom snippets. These will appear alongside the default ones when you open Insert ArcPy Snippet.
- Show Toolbox Explorer: This will open the ArcGIS Toolbox Explorer pane where you can view toolboxes in your currently open workspace.
- Create New Toolbox: This will create a new Python Toolbox (.pyt) with the name you provide in your currently open workspace.
When to Debug
Debugging your script tool can be useful if either the tool is not giving the expected results or if it is producing an error. You can use the VS Code Debugger for ArcGIS Pro to dive into your tool to determine if it is an issue with the code, with the data, or a combination of the two. Place a breakpoint anywhere before the issue, or at the beginning of the script if you don’t know where the issue is located. You can then step through the code, inspecting the variables as necessary to determine the issue and fix it.
Debugging a Script Tool
To begin debugging a script tool in ArcGIS Pro, the script needs to be in an external python file and not embedded in the toolbox.
Open the python script within VS Code and set breakpoints where you’d like it to pause when running the tool.
Click the ArcGIS Pro button on the bottom ribbon to open the menu and select Attach Debugger to ArcGIS Pro.
Select the ArcGIS Pro instance to attach to. If you have more than one instance of ArcGIS Pro running you will need to determine the process ID of the one you want to attach to and select using that.
You should see a message that the debugger is fetching running processes and may need to wait a few moments for the debugger to attach to ArcGIS Pro. When it has successfully attached to ArcGIS Pro there will be a message in the debug console of VS Code.

Once attached you should see the debug controls at the top of the screen. These will allow you to pause, step over, step into, step out, restart, and disconnect while debugging.

To debug your script tool, open the tool within the geoprocessing pane in ArcGIS Pro. Open the script in VS Code and place a breakpoint. From ArcGIS Pro run your tool, VS Code should begin flashing when the breakpoint is hit.
There are two ways you can inspect variables while debugging. The first is using the Variables section in the Run and Debug pane which displays all currently active variables.

The second is by hovering over variables to inspect their values in a popup. These two methods display the same information for each variable.

For easy access, the value of variables will appear at the end of the line they are used in yellow highlighted text.

All of this should provide a seamless experience to debug your python script tools.
When you are done debugging you can click the Disconnect button from the debug controls to disconnect VS Code from ArcGIS Pro.
Debugging a Python Toolbox
Debugging a python toolbox with the ArcGIS Pro Debugger extension is the same workflow as debugging a script tool. Just open the .pyt file in VS Code and set your breakpoints.
Debugging Validation Code
To debug validation code, you will need to copy the contents to a python file and open that within VS Code. Then import that file within the validation pane in the toolbox. You may need to restart ArcGIS Pro to reload the files if you run into any issues. After this setup, debugging is the same as the main script. See the documentation for a step-by-step guide.
Summary
The ArcGIS Pro Debugger is one of a few different ways that you can debug your python code for ArcGIS products. It is a powerful extension for VS Code that provides seamless integration of debugging capabilities with ArcGIS Pro.
Article Discussion: