
When it comes to electrical power distribution over transmission or distribution wires, a lack of vegetation management around the powerlines can lead to high maintenance costs. Vegetation management is crucial, as uncontrolled vegetation encroachments can lead to forest fires, power outages during a storm, and so on.

Identifying these maintenance spots that will need trimming or vegetation management takes time. Often, you will need to conduct a manual survey, or one partially assisted by remote sensing data. Companies must spend time, money, and resources on vegetation encroachment management.
With the recent advancements in deep learning for remotely sensed data, this problem can be solved much faster and at scale. There are deep learning-assisted workflows for this, using satellite imagery, drone imagery, and 3D data. This blog will discuss performing vegetation encroachment analysis (city-wide) on 3D data (LiDAR point clouds) with the help of ArcGIS Pro and Esri pretrained models. For beginners, see Introduction to deep learning and point clouds to learn more about 3D deep learning in ArcGIS Pro.
The data used for the analysis is point cloud data, acquired using an airborne LiDAR sensor flown over the city of Ballarat, Australia. The point cloud was unclassified and saved in LAS format.
For ease in managing and processing the multiple LAS files in ArcGIS Pro, a single LAS dataset is created for the whole data using the Create LAS Dataset tool. The data used for this analysis was already preprocessed for noise points, so the Classify LAS Noise tool that can be used for the classification of noise points is not needed for this dataset.
After that, use Pro tools to classify ground and building points in the dataset. These tools are available in the 3D analyst tools extension of ArcGIS Pro.


For classifying ground points, use the standard classification algorithm available in the Classify LAS Ground tool (shown in figure 2). Then use the Classify LAS Building tool to classify building points (shown in figure 3).
After classifying building and ground points in the dataset, leverage deep learning using Esri pretrained models for other classes of interest that are needed for the vegetation encroachment analysis. The pretrained models for the tree points classification and power line classification are used to classify vegetation, distribution wires, and poles.
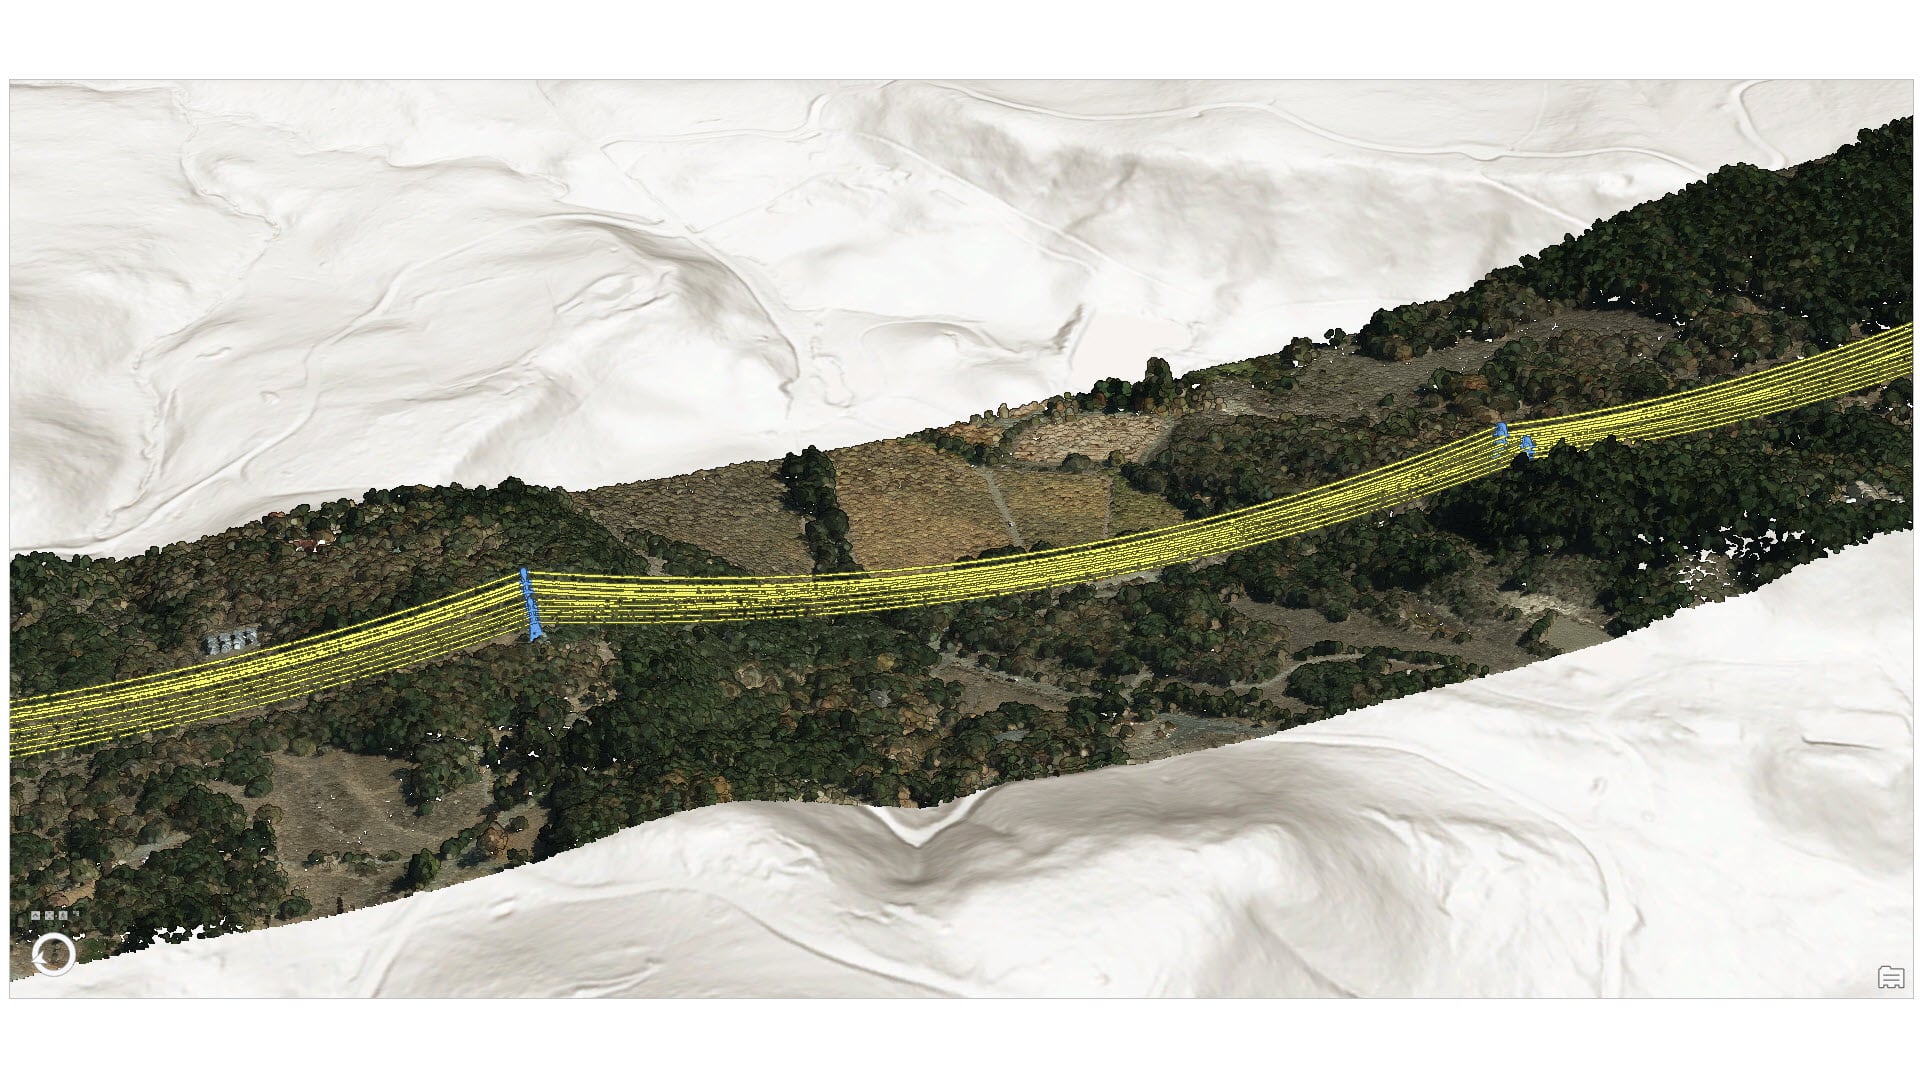
First, use the power line classification model to classify distribution wires and distribution poles while preserving the existing classes, which are building and ground in this case. Then classify vegetation points using the tree points classification model while preserving all of the previously classified classes (shown in figure 4). The preserve classes feature is useful in optimizing the post-processing effort by reducing the number of false positives in the output. For both these steps, the 3D deep learning inferencing tool, Classify Point Cloud Using Trained Model is used.

Now that all the classes of interest – ground, buildings, distribution wires, distribution poles, and vegetation – are classified (shown in figure 5), you are ready for the GIS post-processing.

In the GIS workflow, the initial step is to create rasters of filtered distribution points and vegetation points. The intersection of these two rasters gives us the potential sites of vegetation encroachment (shown in figure 6).

Lastly, categorize the encroachment site’s feature classes based on their kind: above, below, outlier, and intertwined.
This is accomplished by comparing the values of the highest and lowest heights of vegetation points and distribution wire points in a particular encroachment site polygon. Use the LAS Point Statistics By Area tool to obtain the z-values of the highest and lowest points. Create new fields in the encroachment site feature class, and use the Calculate Field tool to add a category for each encroachment site (shown in figures 7 and 8).


Using the above deep learning–assisted approach, we performed the vegetation encroachment analysis at scale using ArcGIS Pro. See the web scene showing the results of the vegetation encroachment analysis explained in this post.

The workflow not only helps in identifying encroachment sites but also in prioritizing them based on whether the vegetation encroachment is above the wire, below the wire, or intertwined with the distribution wires. This saves costs and optimizes the process of vegetation management for utility companies.
This analysis was showcased as a demo at the Esri IMGIS Conference:
Credits:
The dataset used here is provided to Esri by the AAM group for Artificial Intelligence/Machine Learning exploratory research.

Article Discussion: